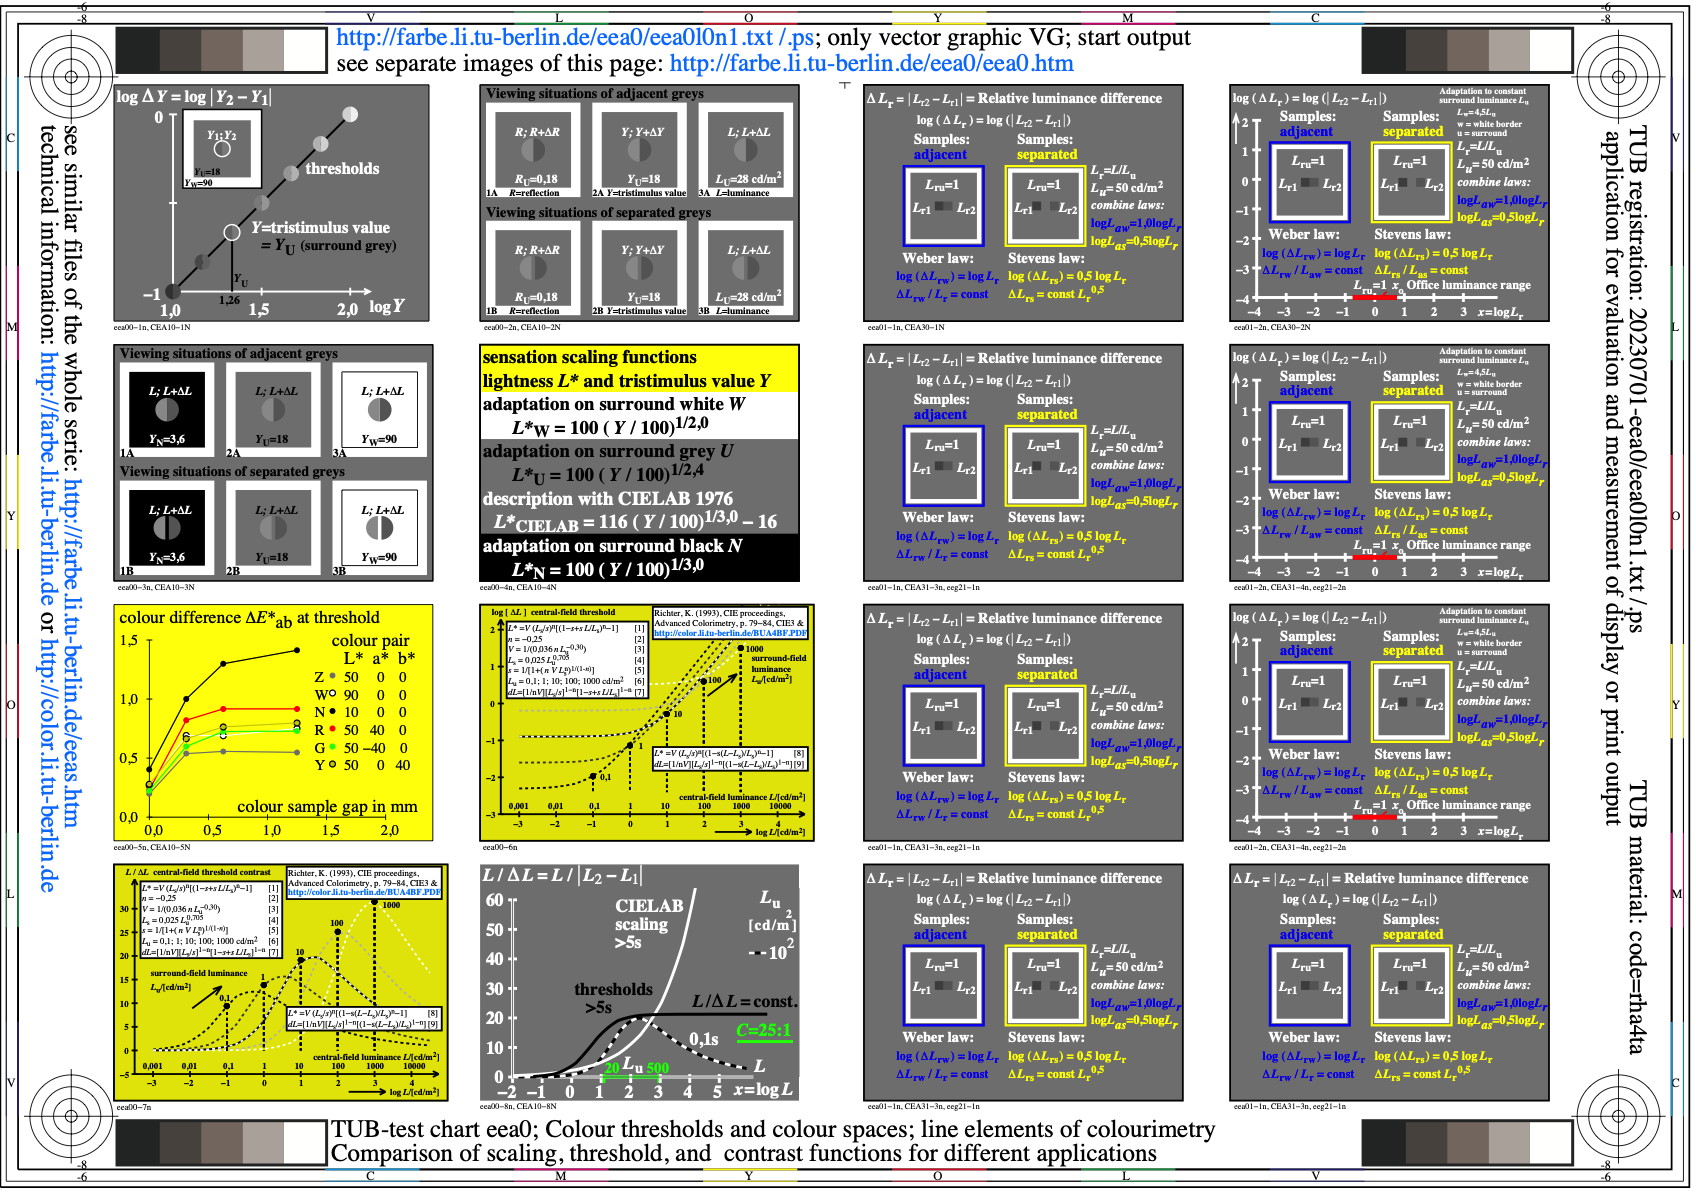
Image eea0l0n1.jpg: Output in format A6 of the file eea0l0np.pdf, see
eea0l0n1. PS / TXT / PDF / jpg
Section 2, Chapter E:
Colour Metrics, Differences, and Appearance (2023)
This image page with 260 image series:
ee2s in English,
eg2s in German.
Previous image page:
de2s in English,
dg2s in German.
Next image page, see
fe2s in English,
fg2s in German.
Introduction, content list and summary:
eeai,
eea_i,
eea_s in English or
egai,
ega_i,
ega_s in German.
Section 2: Colourimetry, Colour Vision and Applications for Colour Image Technology (2019-2024), Image part ee2s
Chapter E: Colour Metrics, Differences, and Appearance (2023)
The following 260 image series between eea0 and eez9
show the content with links to the single figures
in up to six formats.
Image eea0l0n1.jpg: Output in format A6 of the file
eea0l0np.pdf, see
eea0l0n1.
PS /
TXT /
PDF /
jpg
eea0: TUB-test chart eea0; Line elements of higher colorimetry
CIELAB, LABJND, TUBJND, CIEDE200, see CIE 230:2019
Relative lightness L*/L*u as bais for the grey scaling
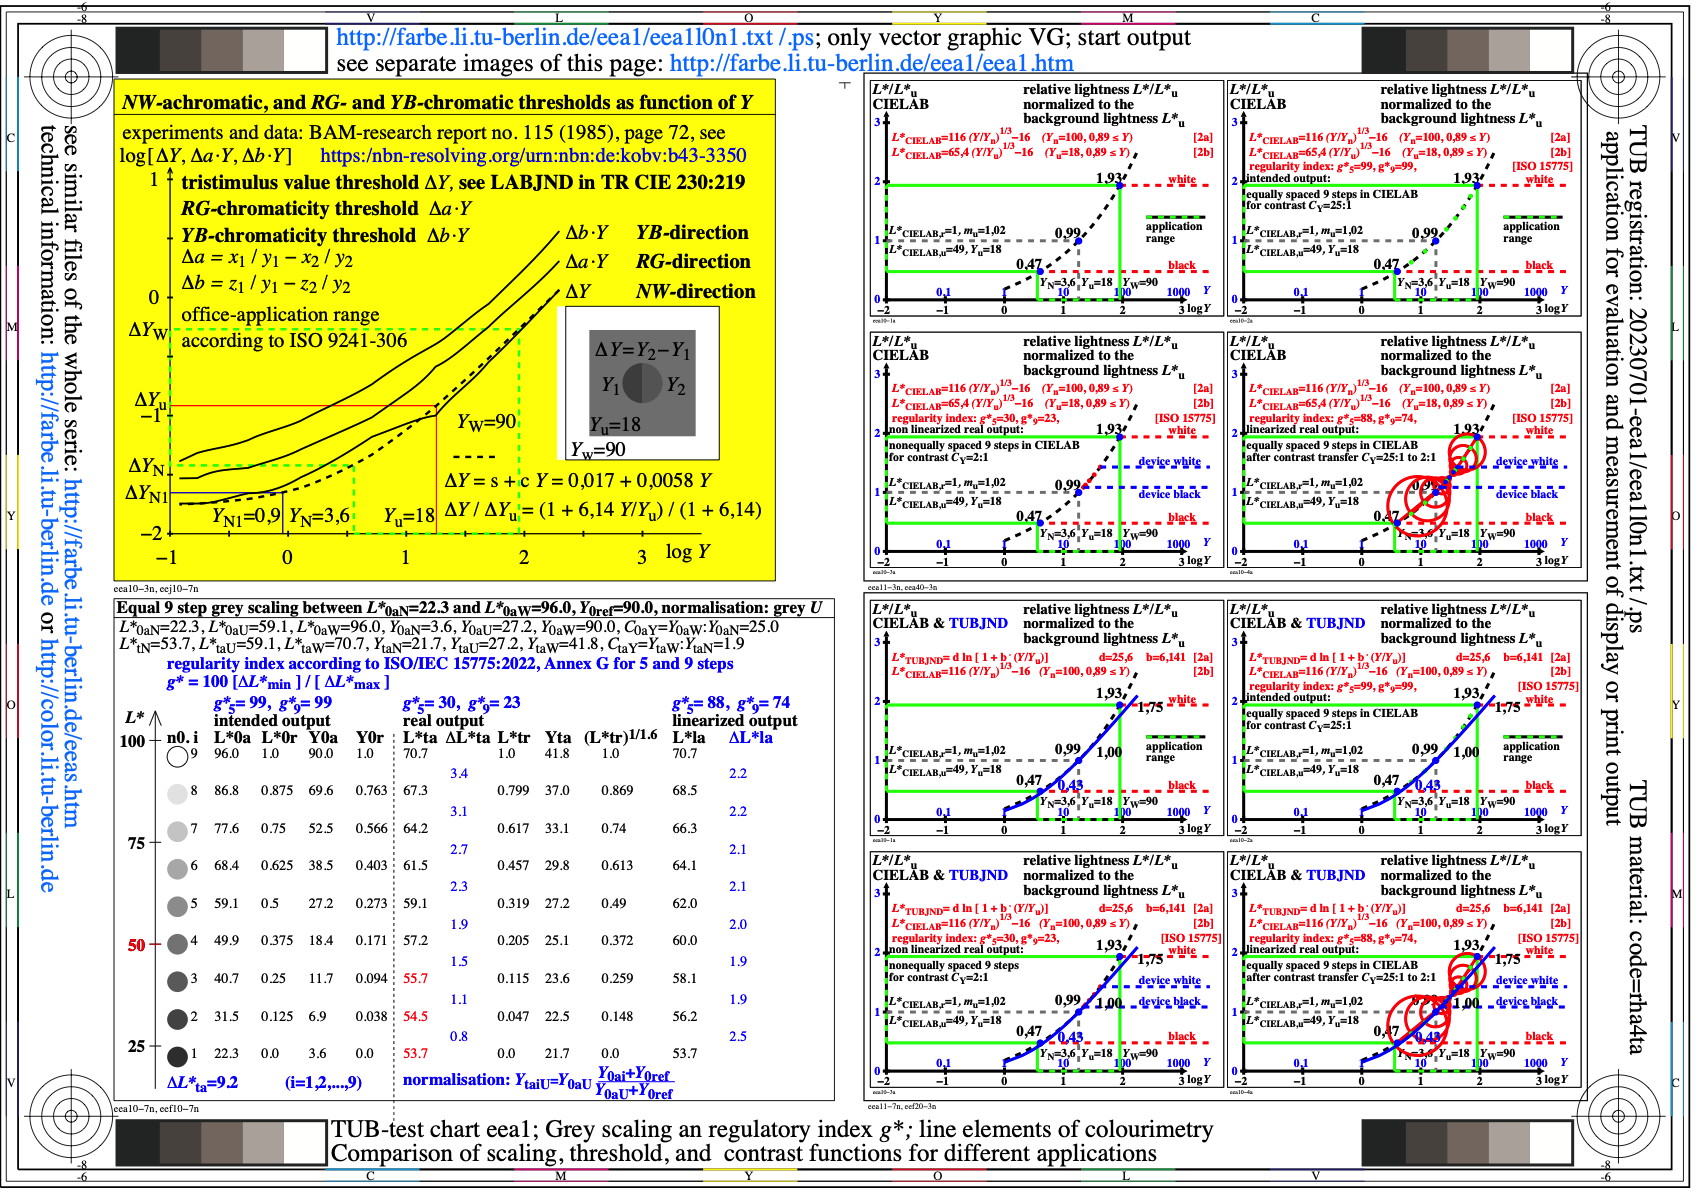
Image eea1l0n1.jpg: Output in format A6 of the file
eea1l0np.pdf, see
eea1l0n1.
PS /
TXT /
PDF /
jpg
eea1: TUB-test chart eea1; Line elements of higher colorimetry
CIELAB, LABJND, TUBJND, CIEDE2000 and others
Regularity index according to ISO/IEC 15775 for the grey scaling
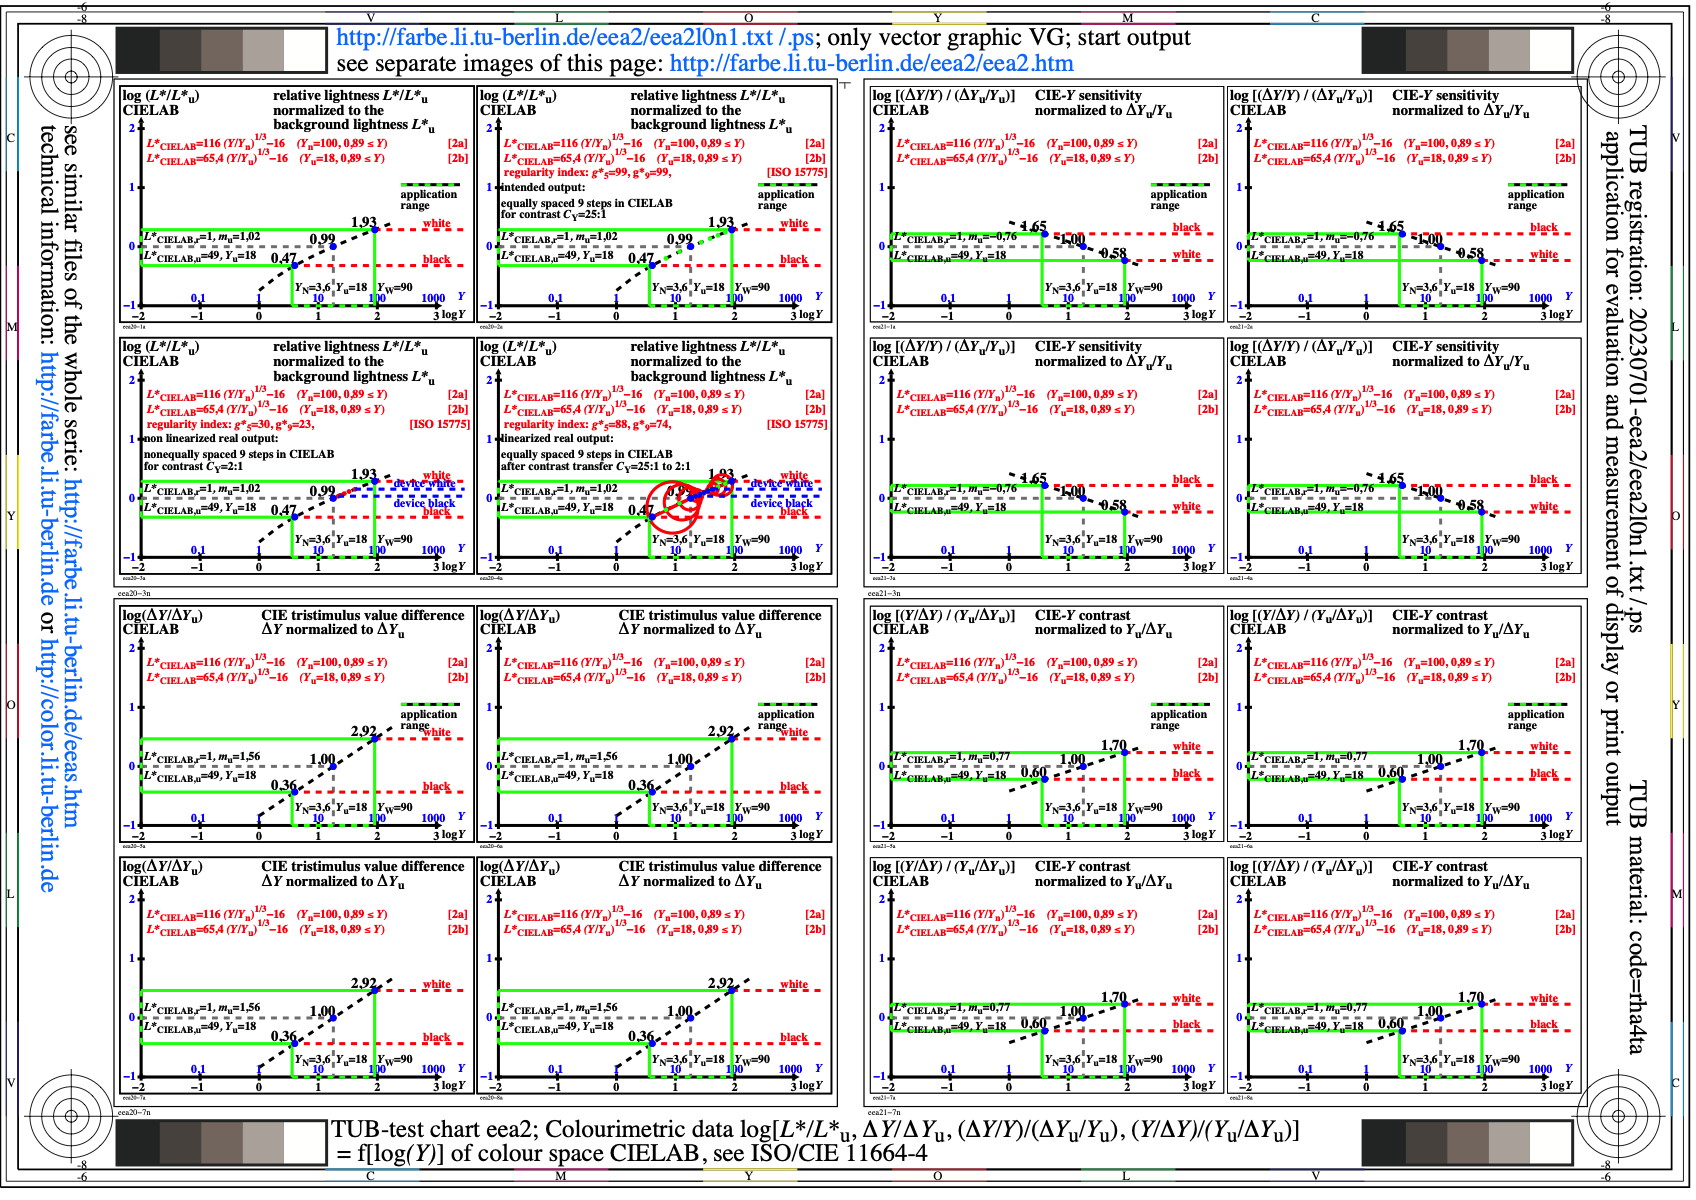
Image eea2l0n1.jpg: Output in format A6 of the file
eea2l0np.pdf, see
eea2l0n1.
PS /
TXT /
PDF /
jpg
eea2: TUB-test chart eea2; Colourimetric data
log[L*/L*u, dY/dYu, (dY/Y)/(dYu/Yu), (Y/dY)/(Yu/dYu)]
= f[log(Y)] of the colour spaces CIELAB & TUBJND, see CIE 230
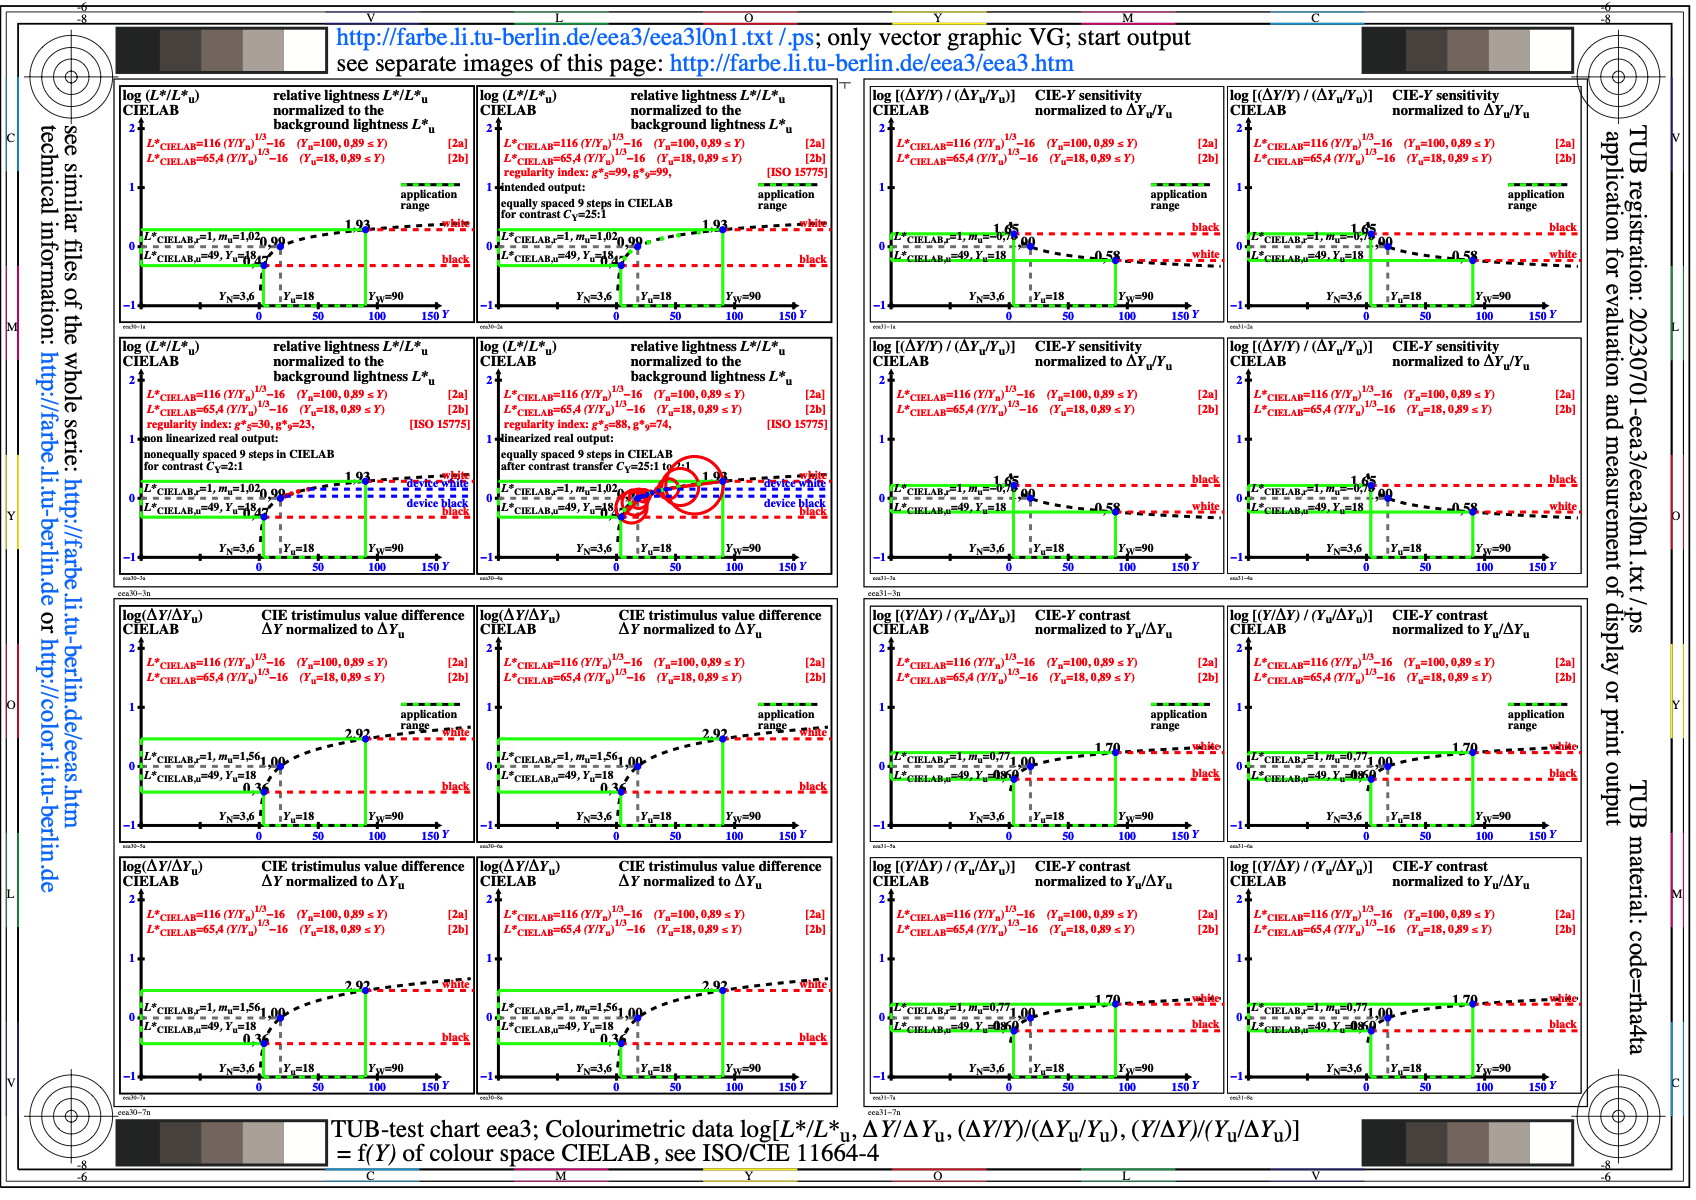
Image eea3l0n1.jpg: Output in format A6 of the file
eea3l0np.pdf, see
eea3l0n1.
PS /
TXT /
PDF /
jpg
eea3: TUB-test chart eea3; Colourimetric data
log[L*/L*u, dY/dYu, (dY/Y)/(dYu/Yu), (Y/dY)/(Yu/dYu)]
= f(Y) of the colour spaces CIELAB & TUBJND, see CIE 230
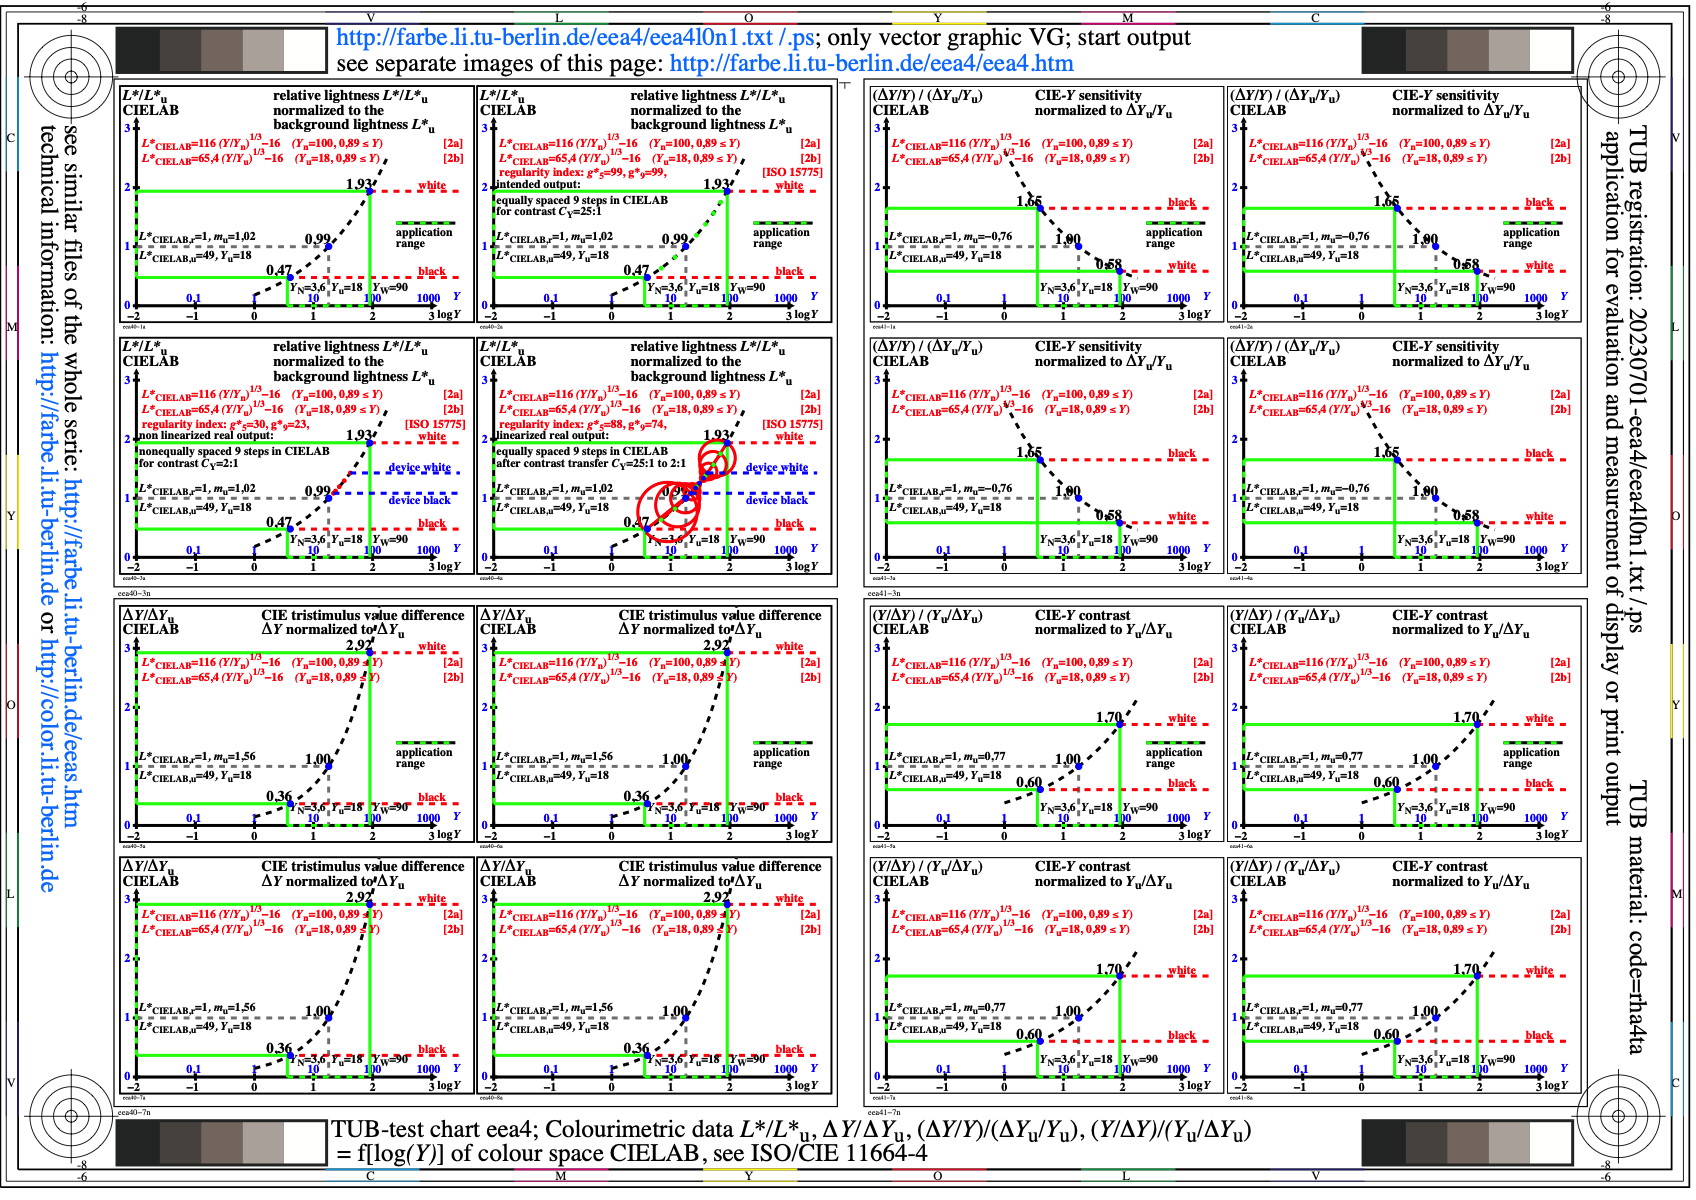
Image eea4l0n1.jpg: Output in format A6 of the file
eea4l0np.pdf, see
eea4l0n1.
PS /
TXT /
PDF /
jpg
eea4: TUB-test chart eea4; Colourimetric data
L*/L*u, dY/dYu, (dY/Y)/(dYu/Yu), (Y/dY)/(Yu/dYu)
= f[log(Y)] of the colour spaces CIELAB & TUBJND, see CIE 230
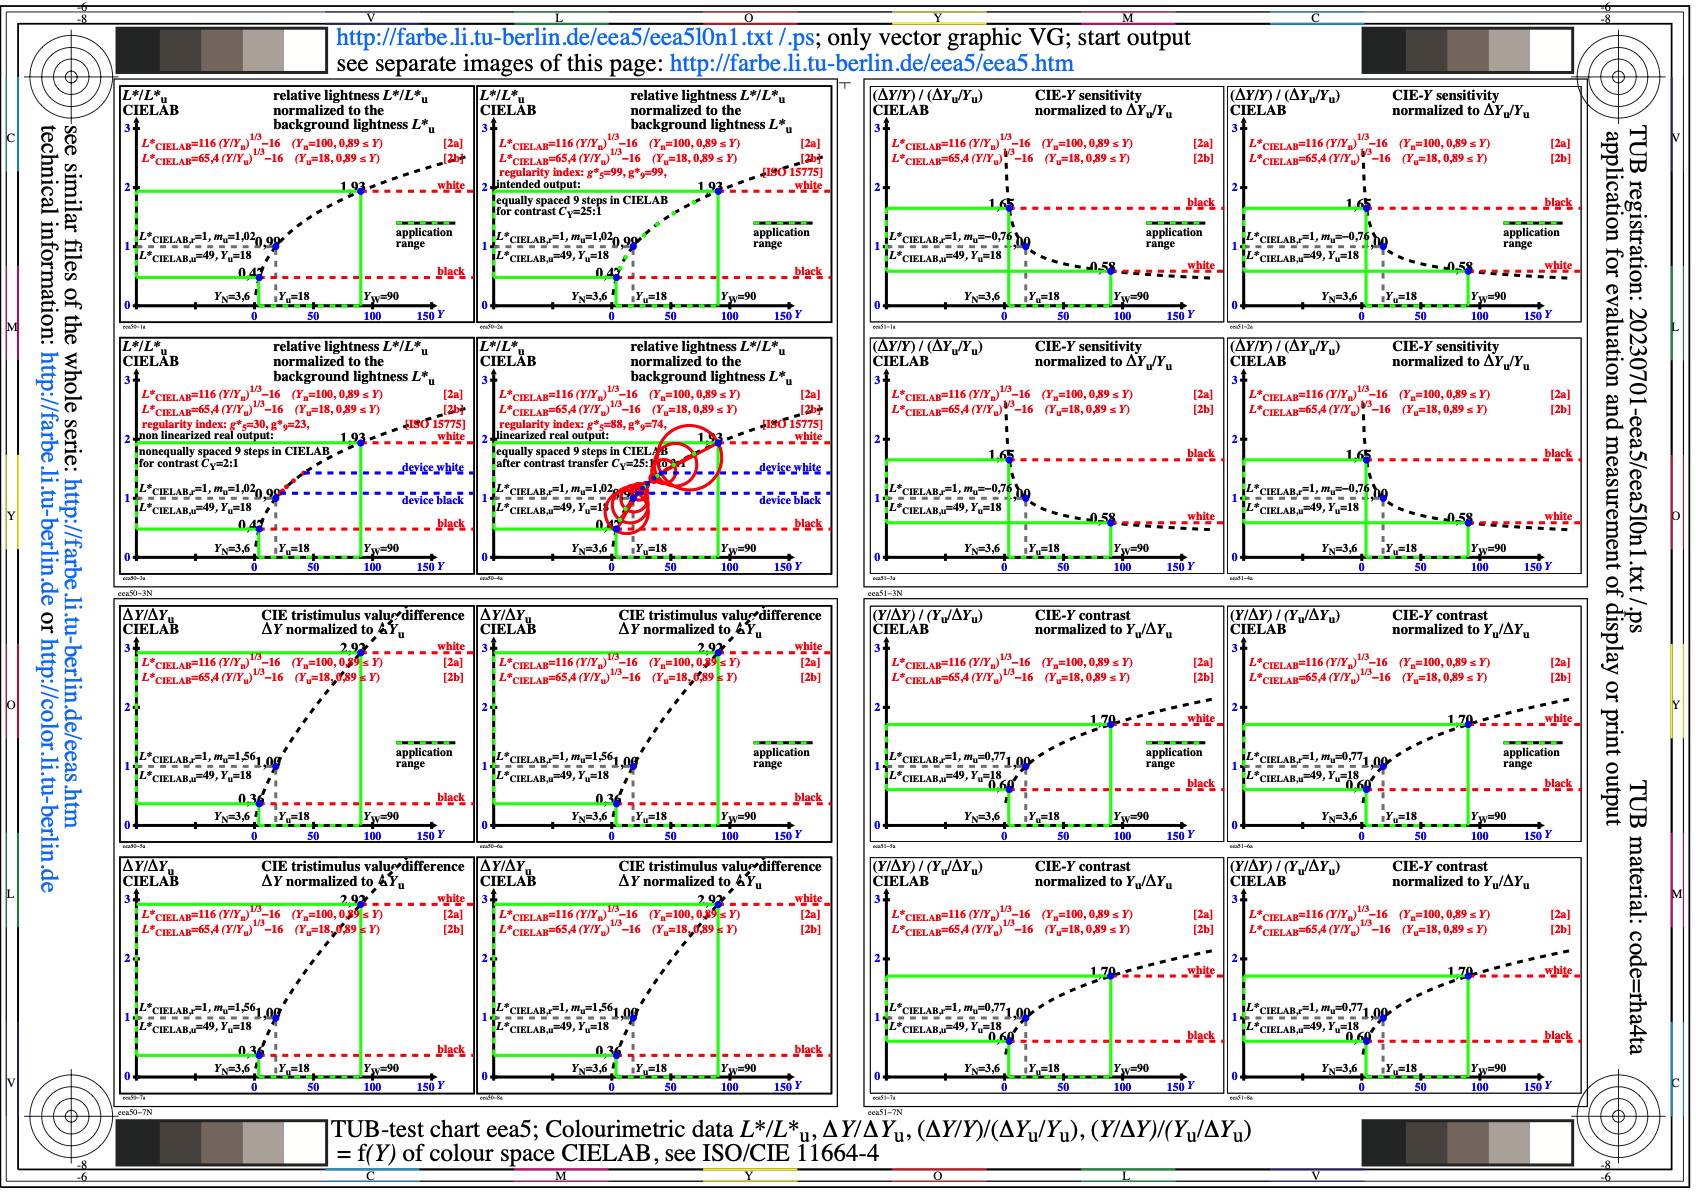
Image eea5l0n1.jpg: Output in format A6 of the file
eea5l0np.pdf, see
eea5l0n1.
PS /
TXT /
PDF /
jpg
eea5: TUB-test chart eea5; Colourimetric data
L*/L*u, dY/dYu, (dY/Y)/(dYu/Yu), (Y/dY)/(Yu/dYu)
= f(Y) of the colour spaces CIELAB & TUBJND, see CIE 230
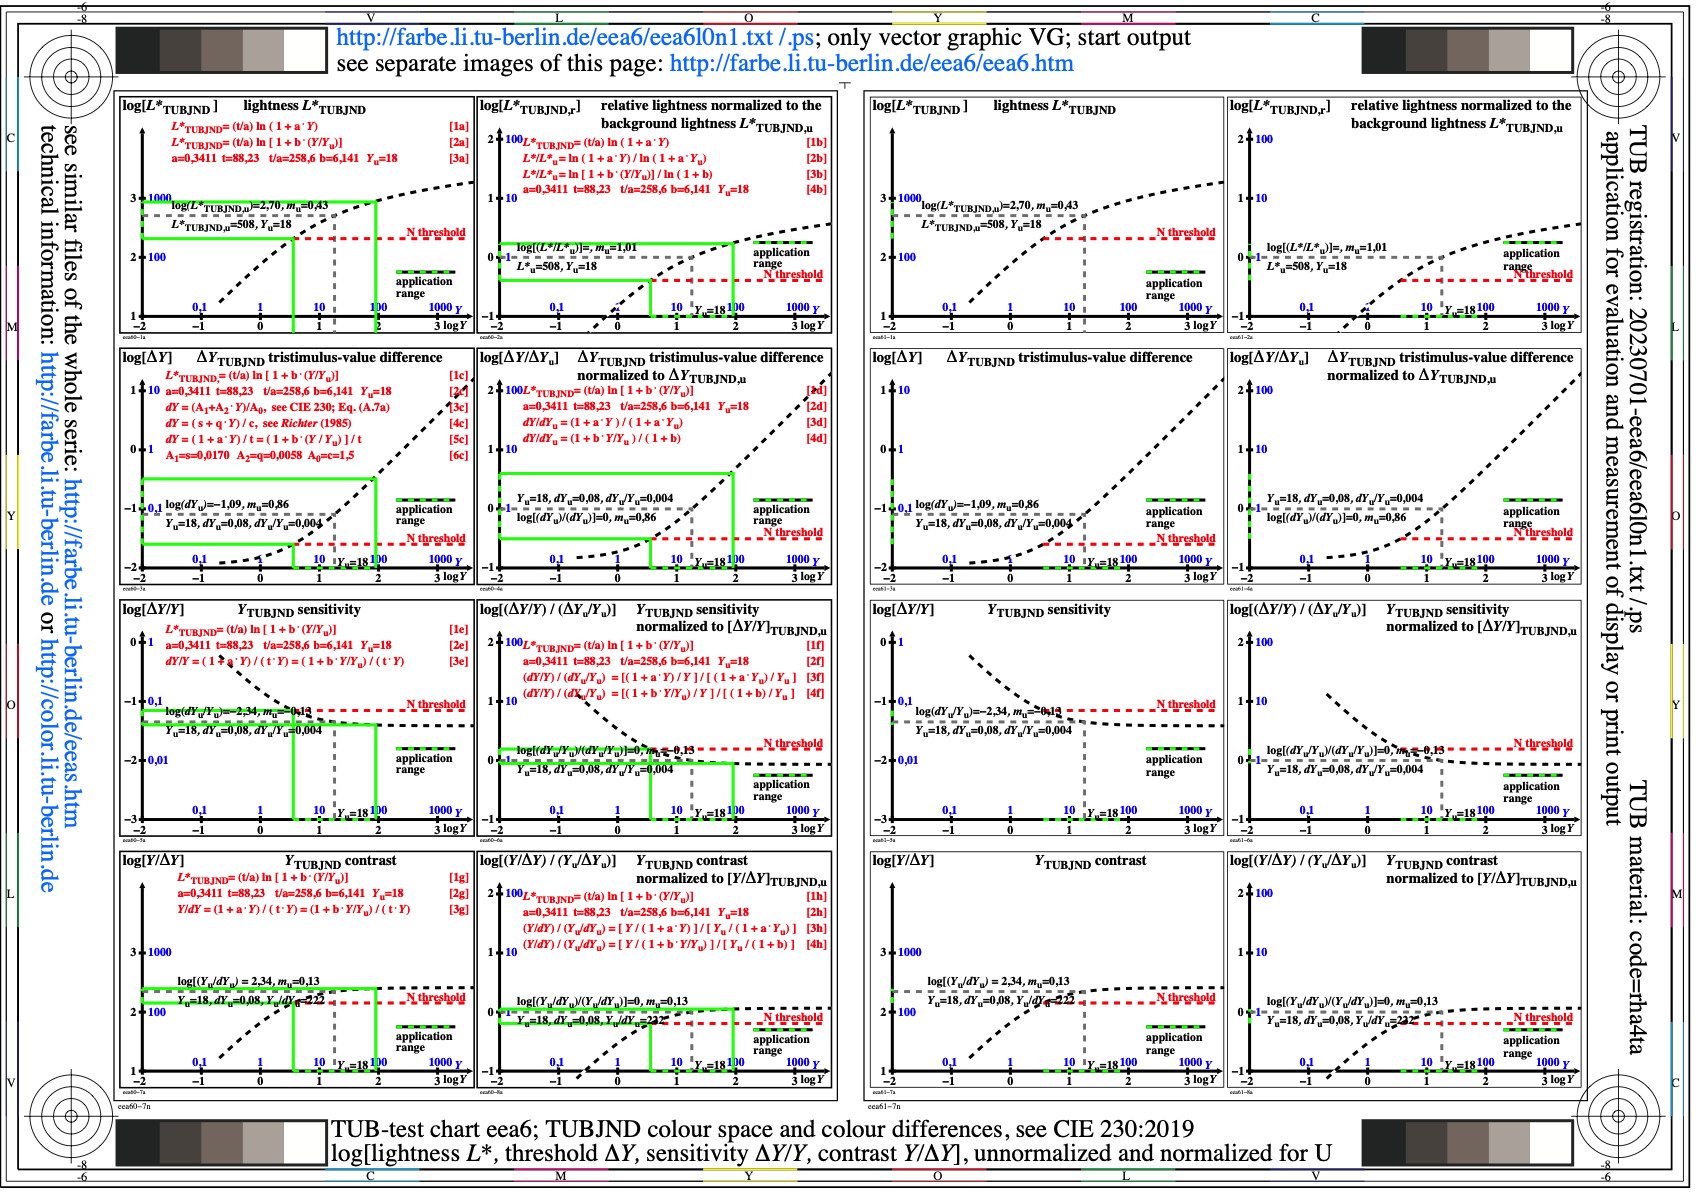
Image eea6l0n1.jpg: Output in format A6 of the file
eea6l0np.pdf, see
eea6l0n1.
PS /
TXT /
PDF /
jpg
eea6: TUB-test chart eea6; TUBJND-colour space & differences
log[lightness L*, threshold delta Y, sensitivity
(delta Y)/Y & contrast Y/(delta Y)]=f[log(Y)]

Image eea7l0n1.jpg: Output in format A6 of the file
eea7l0np.pdf, see
eea7l0n1.
PS /
TXT /
PDF /
jpg
eea7: TUB-test chart eea7; CIELAB-colour space & differences
log[lightness L*, threshold delta Y, sensitivity
(delta Y)/Y & contrast Y/(delta Y)]=f[log(Y)]
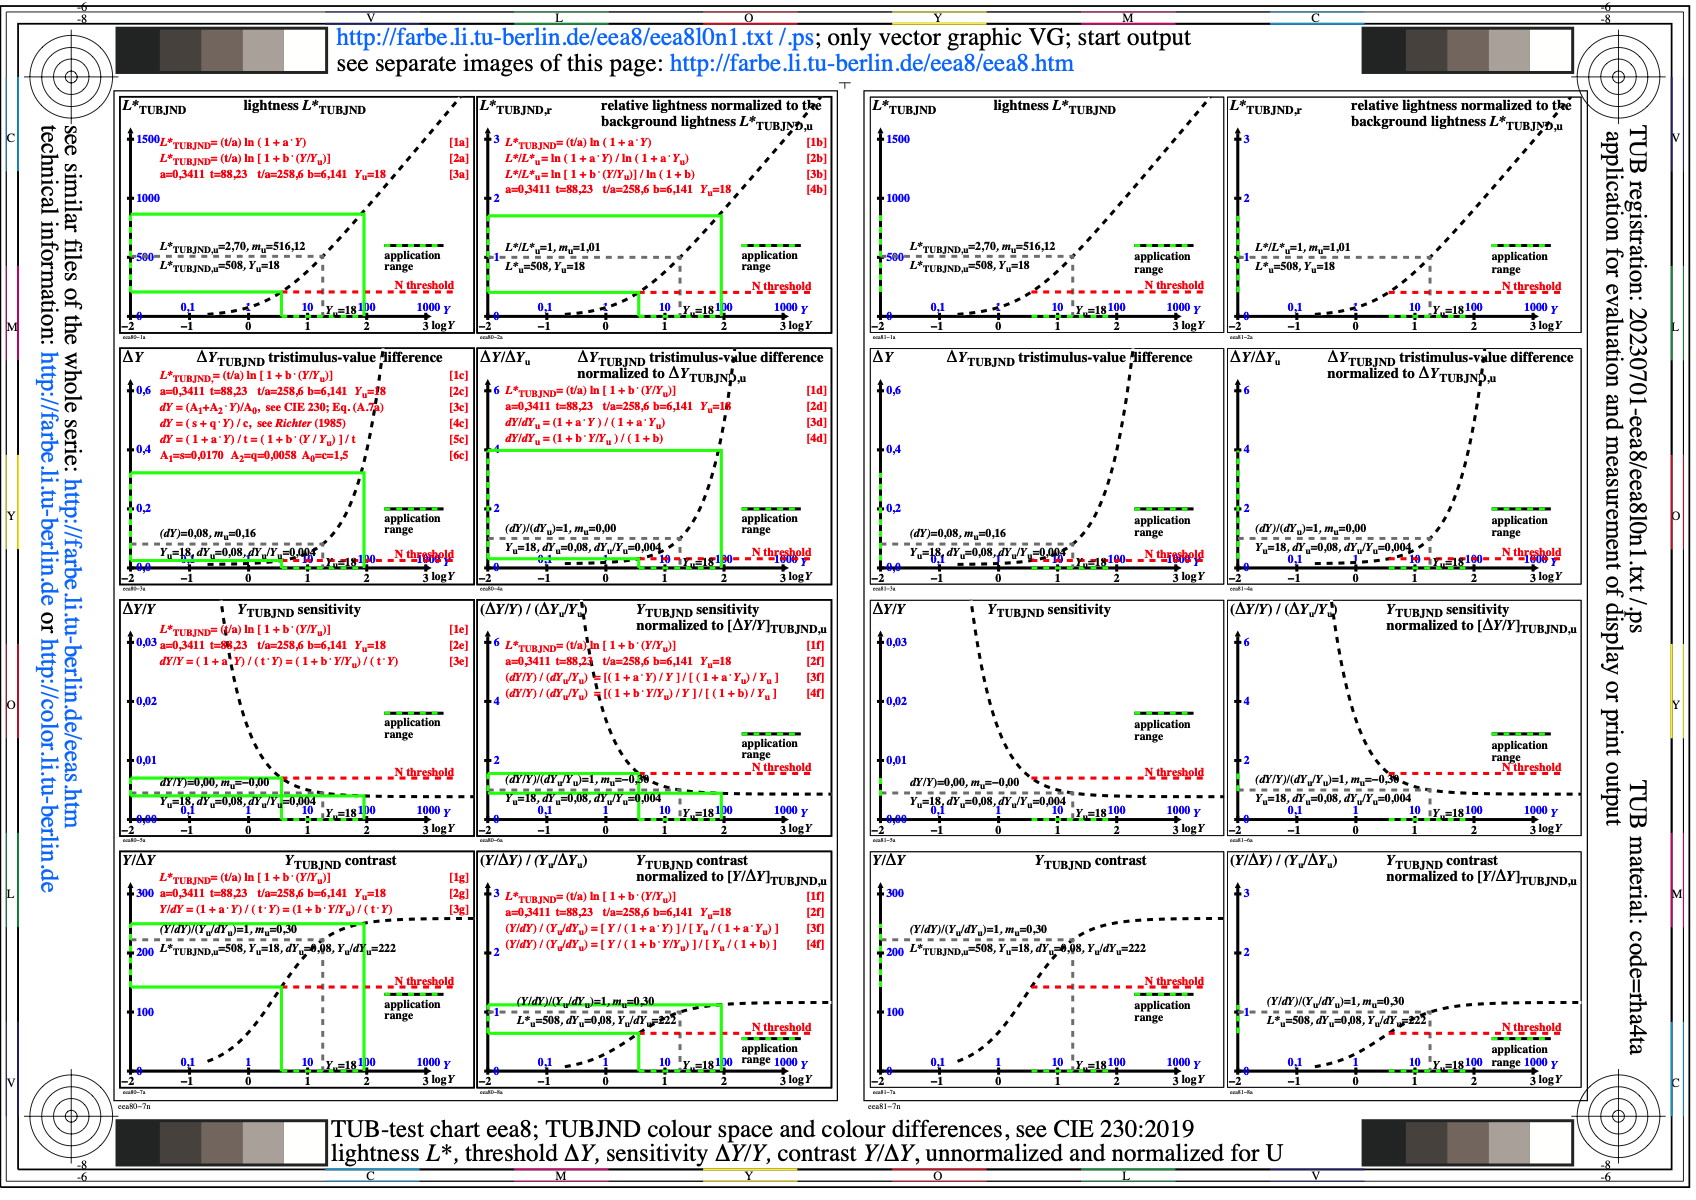
Image eea8l0n1.jpg: Output in format A6 of the file
eea8l0np.pdf, see
eea8l0n1.
PS /
TXT /
PDF /
jpg
eea8: TUB-test chart eea8; TUBJND-colour space & differences
lightness L*, threshold delta Y, sensitivity
(delta Y)/Y & contrast Y/(delta Y)=f[log(Y)]
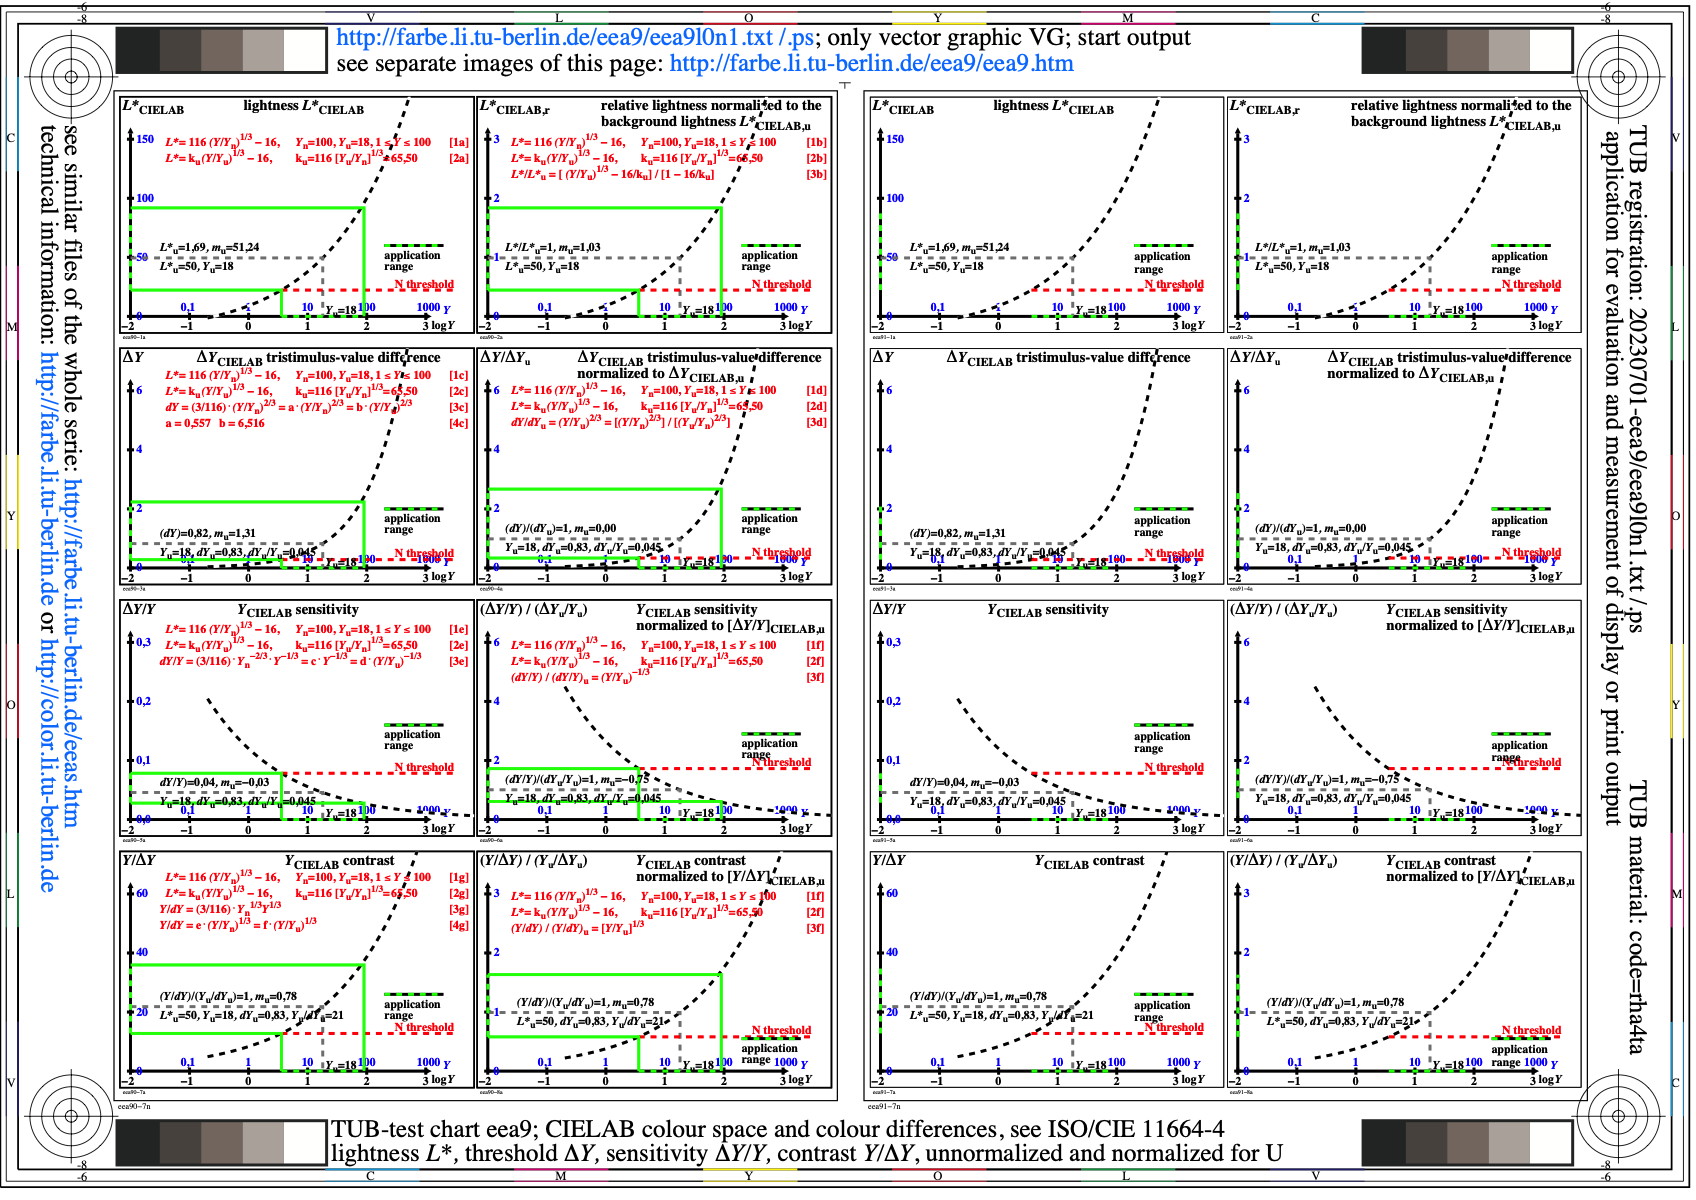
Image eea9l0n1.jpg: Output in format A6 of the file
eea9l0np.pdf, see
eea9l0n1.
PS /
TXT /
PDF /
jpg
eea9: TUB-test chart eea9; CIELAB-colour space & differences
lightness L*, threshold delta Y, sensitivity
(delta Y)/Y & contrast Y/(delta Y)=f[log(Y)]
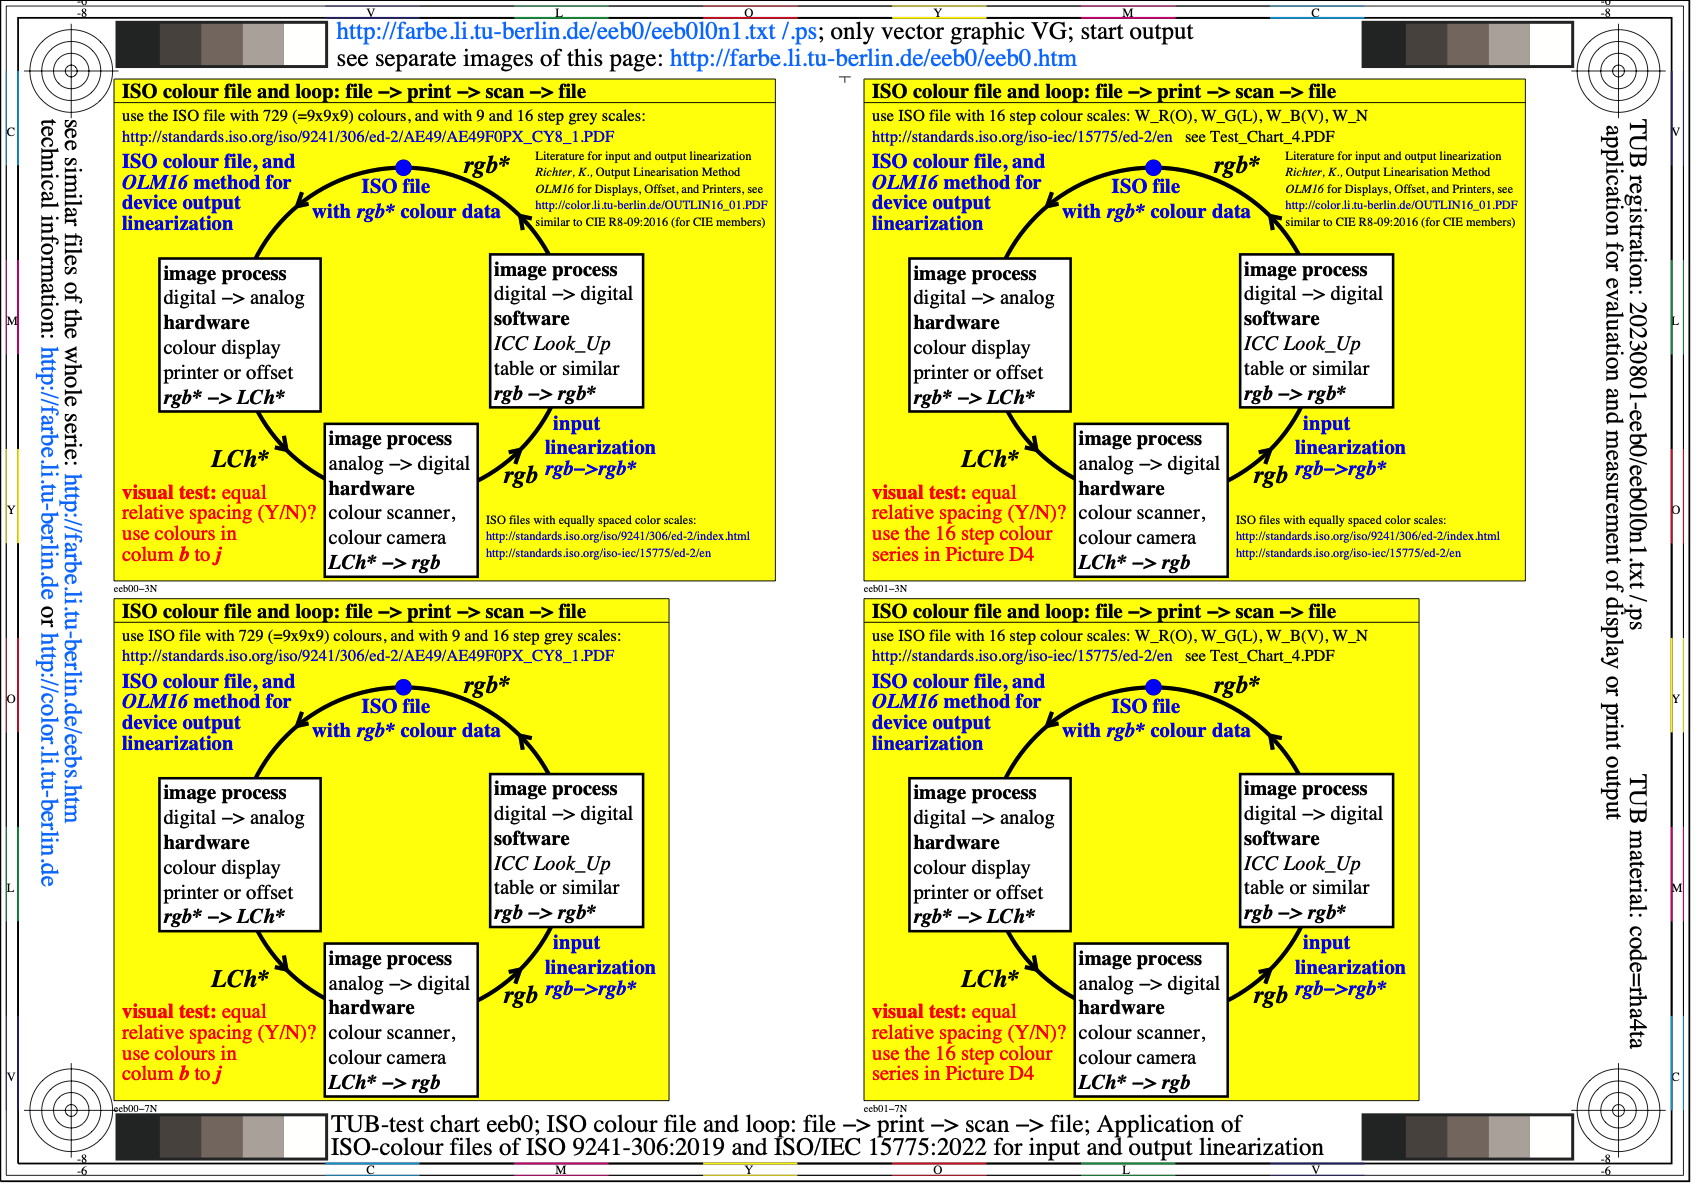
Image eeb0l0n1.jpg: Output in format A6 of the file
eeb0l0np.pdf, see
eeb0l0n1.
PS /
TXT /
PDF /
jpg
eeb0: TUB-test chart eeb0; ISO-colour file and colour loop:
ISO file -> print -> scan -> ISO file; application of
ISO 9241-306 & ISO/IEC 15775: input and output linearization
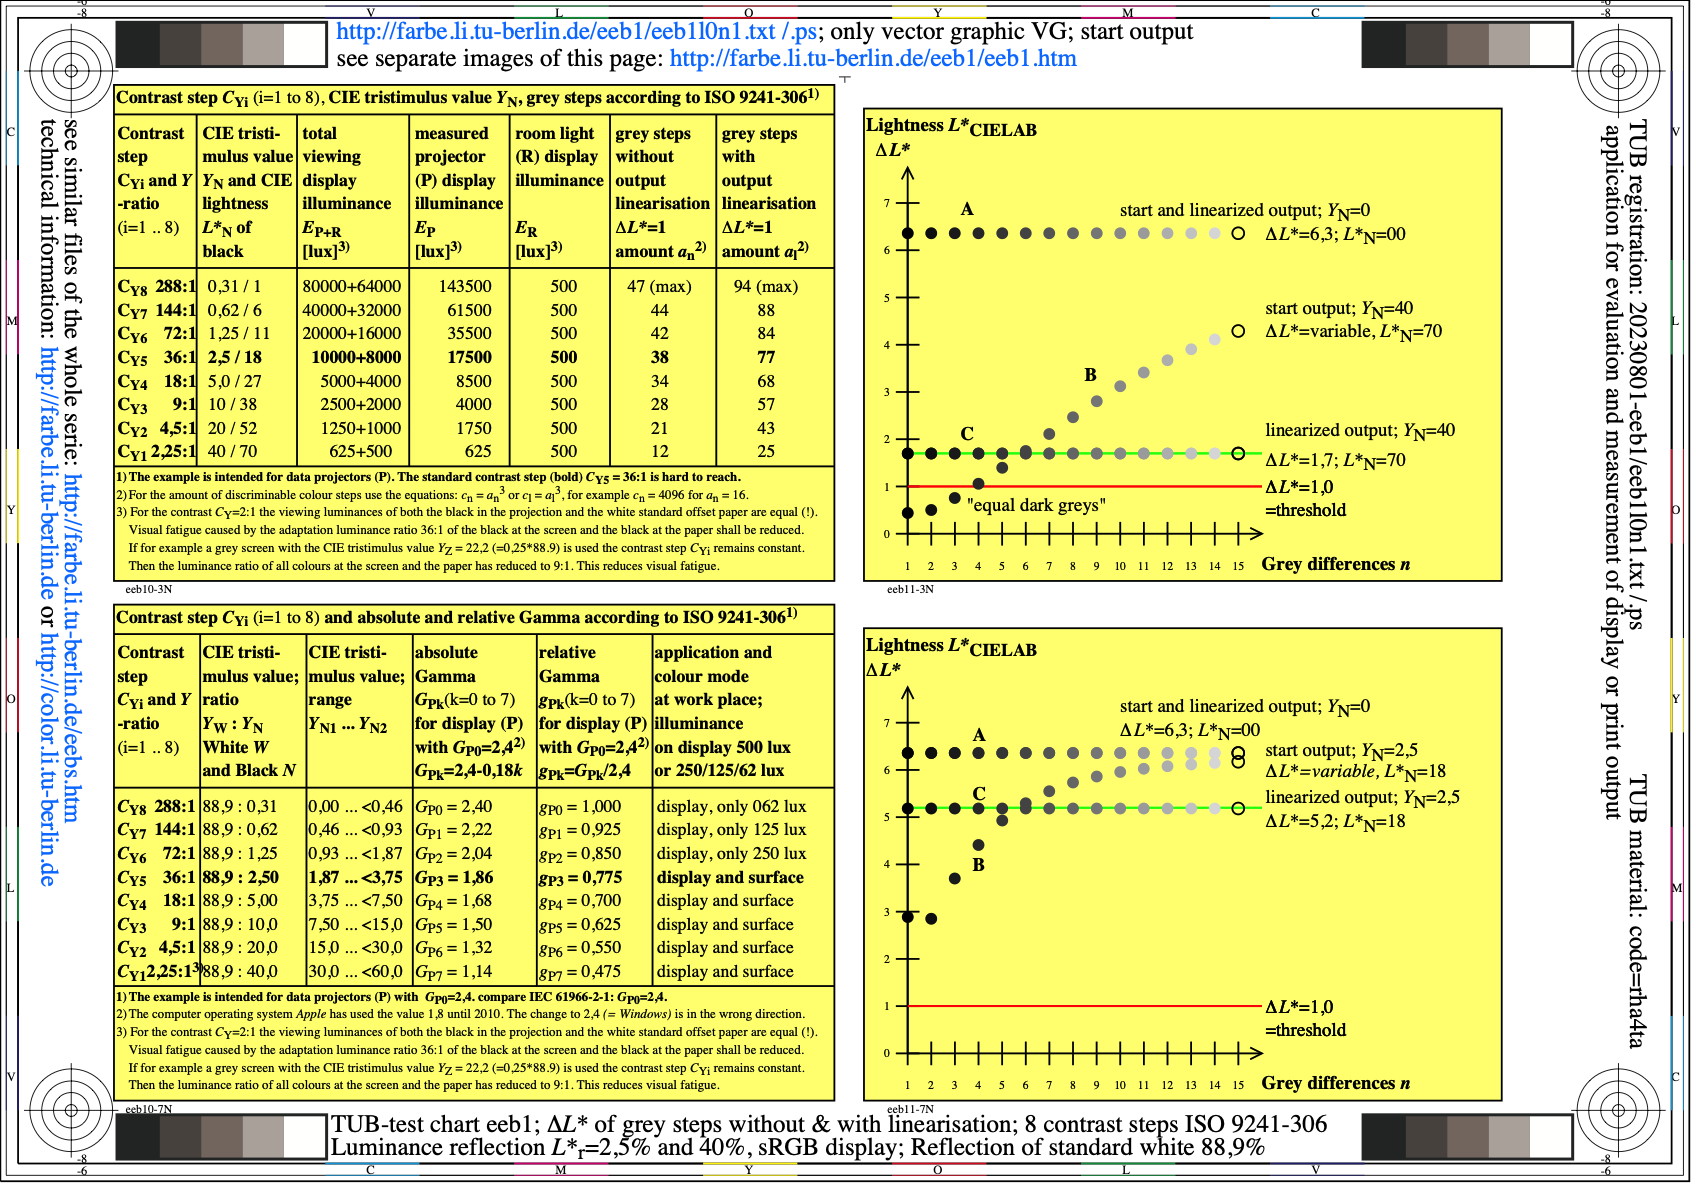
Image eeb1l0n1.jpg: Output in format A6 of the file
eeb1l0np.pdf, see
eeb1l0n1.
PS /
TXT /
PDF /
jpg
eeb1: TUB-test chart eeb1; L* difference of 16 grey steps
and change of spacing for 2 ambient reflections:
YN=2,5 and 40; sRGB display; contrast steps of ISO 9241-306
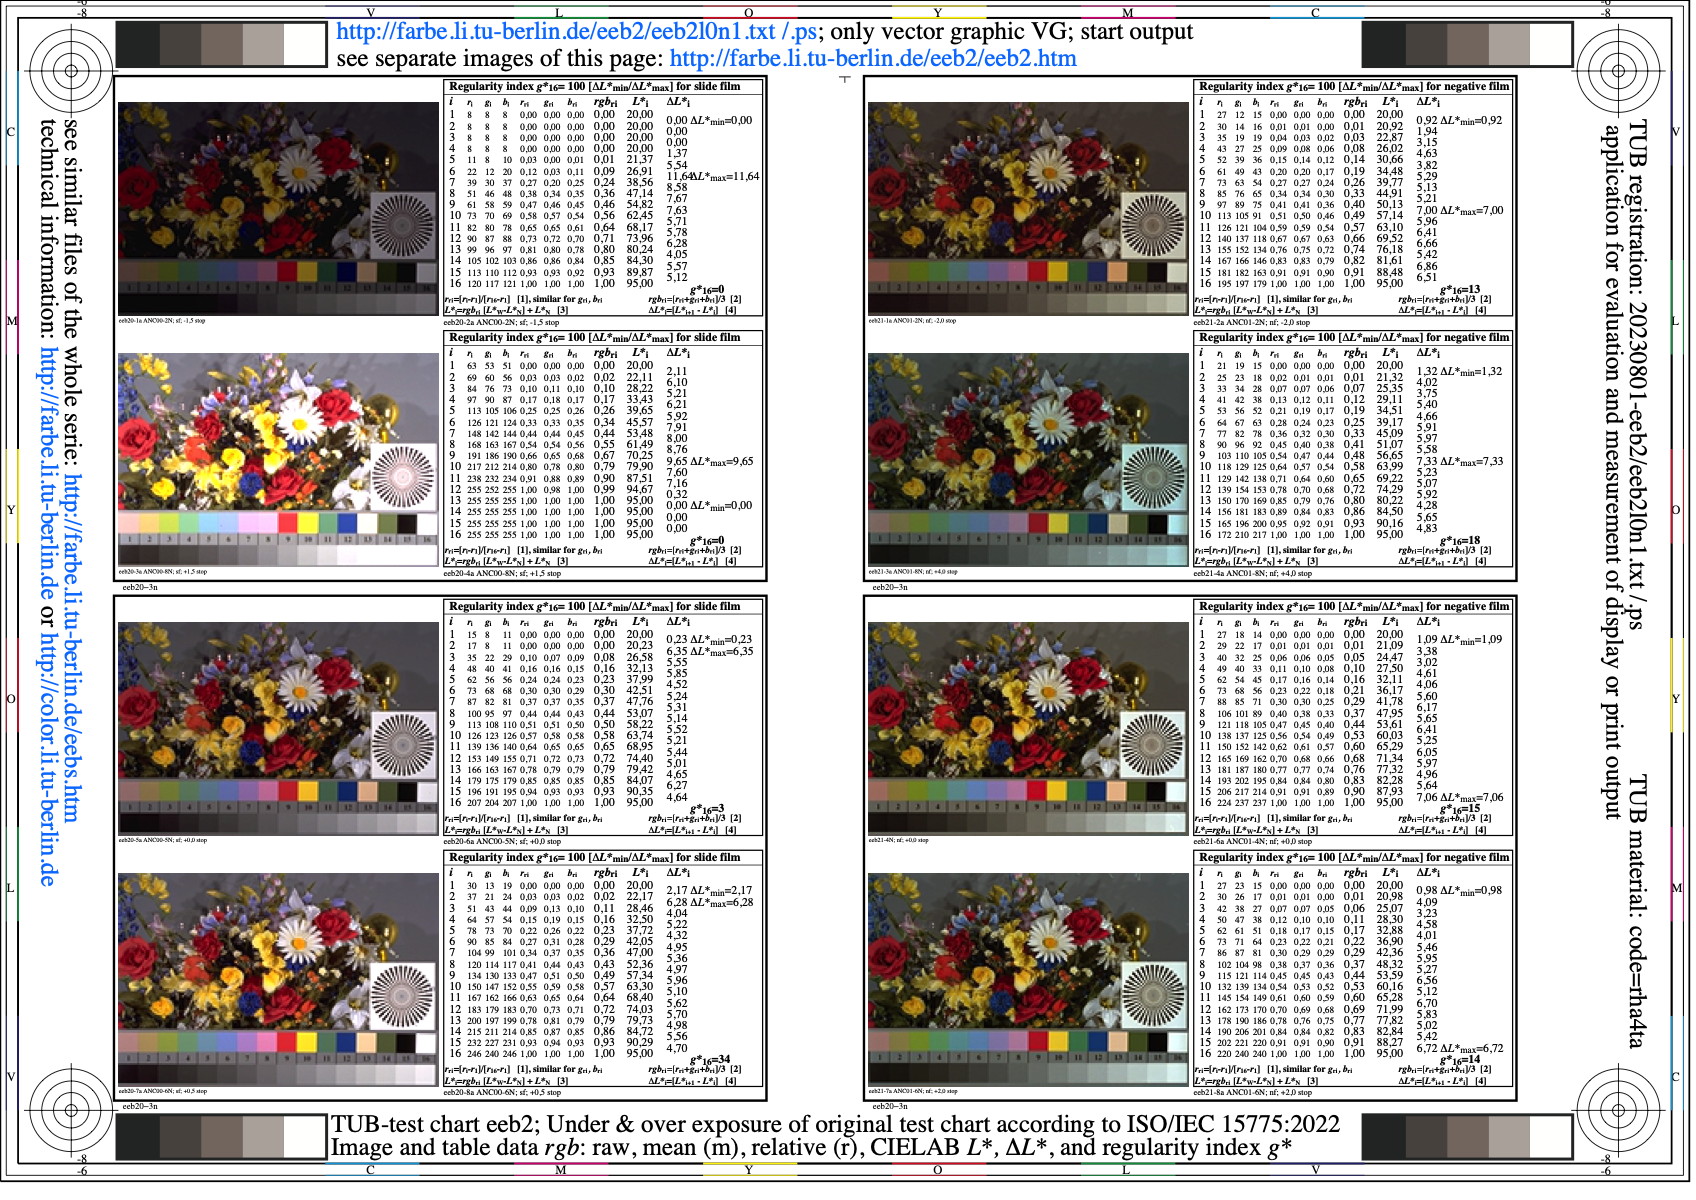
Image eeb2l0n1.jpg: Output in format A6 of the file
eeb2l0np.pdf, see
eeb2l0n1.
PS /
TXT /
PDF /
jpg
eeb2: TUB-test chart eeb2; under and over exposure of the original
chart according to ISO/IEC 15775:2022; image and data
rgb, CIELAB L*, dL*, regularity index g*
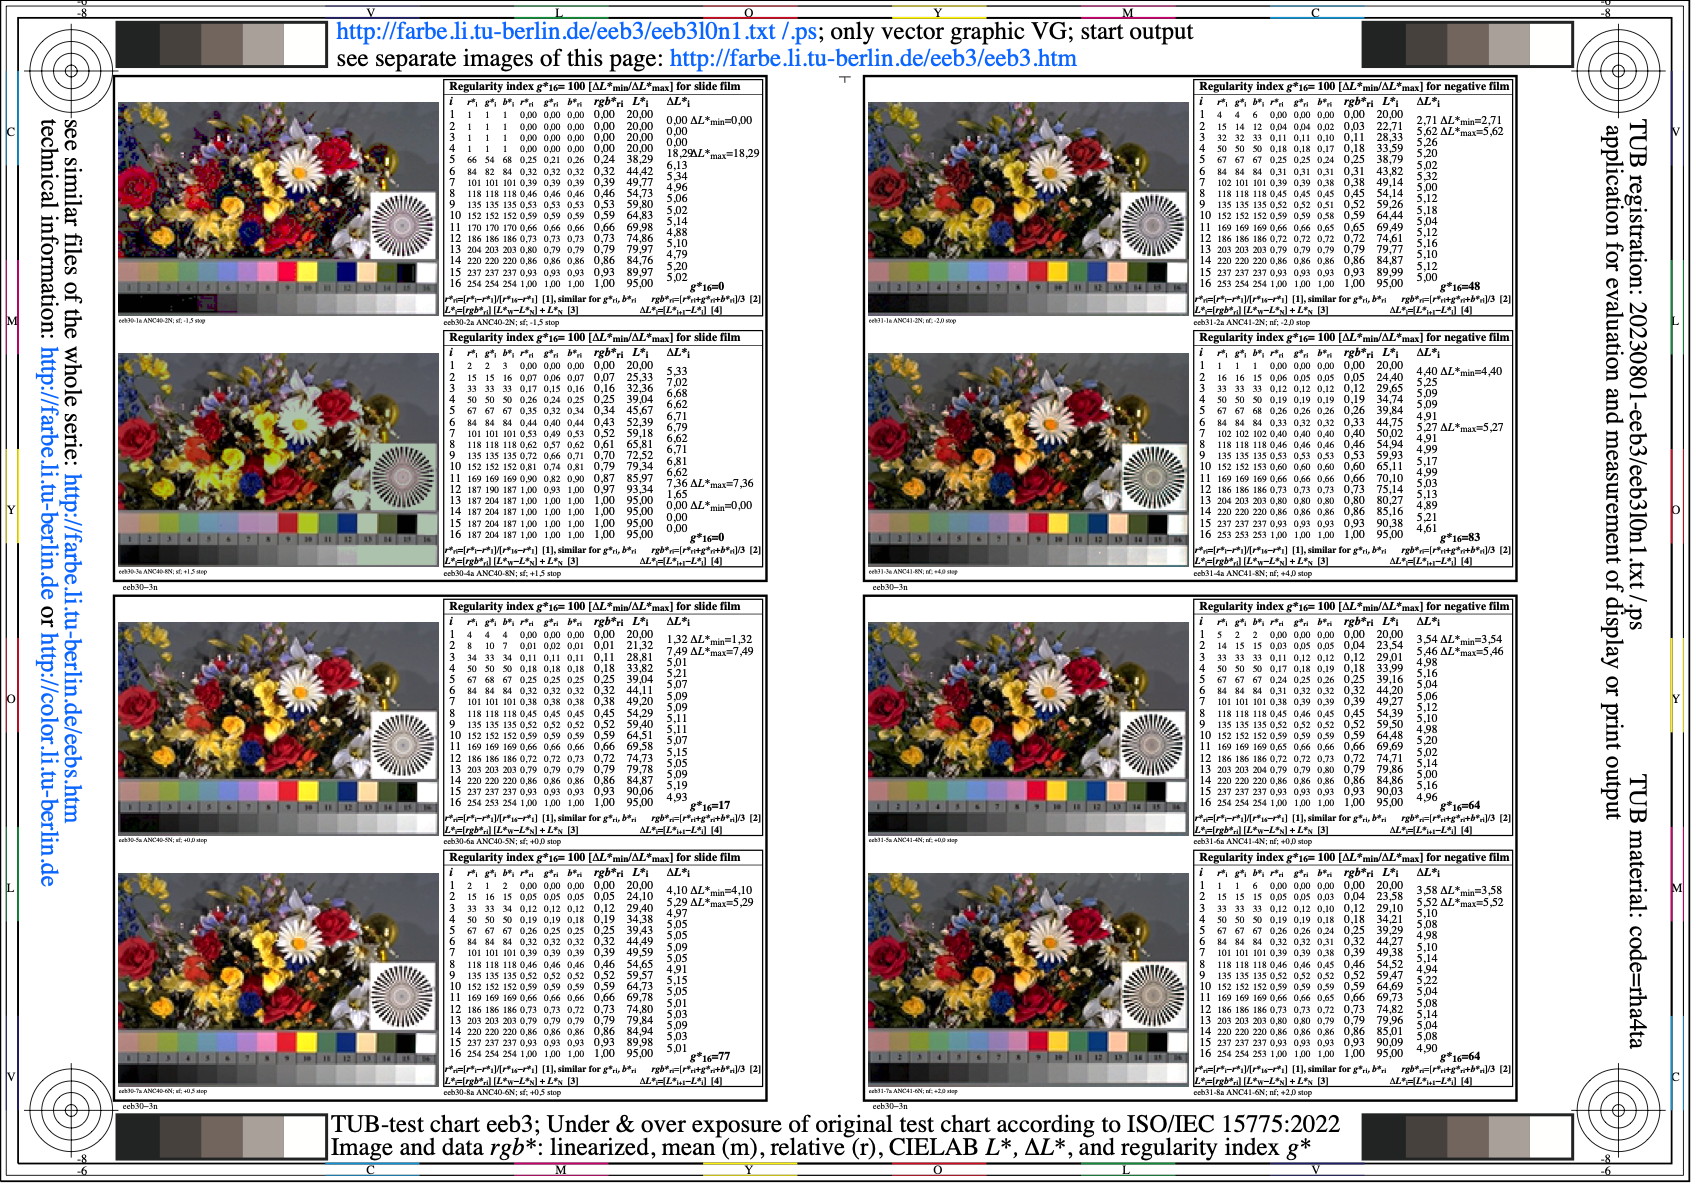
Image eeb3l0n1.jpg: Output in format A6 of the file
eeb3l0np.pdf, see
eeb3l0n1.
PS /
TXT /
PDF /
jpg
eeb3: TUB-test chart eeb3; under and over exposure of the original
chart according to ISO/IEC 15775:2022; image and data
rgb*, CIELAB L*, dL*, regularity index g*
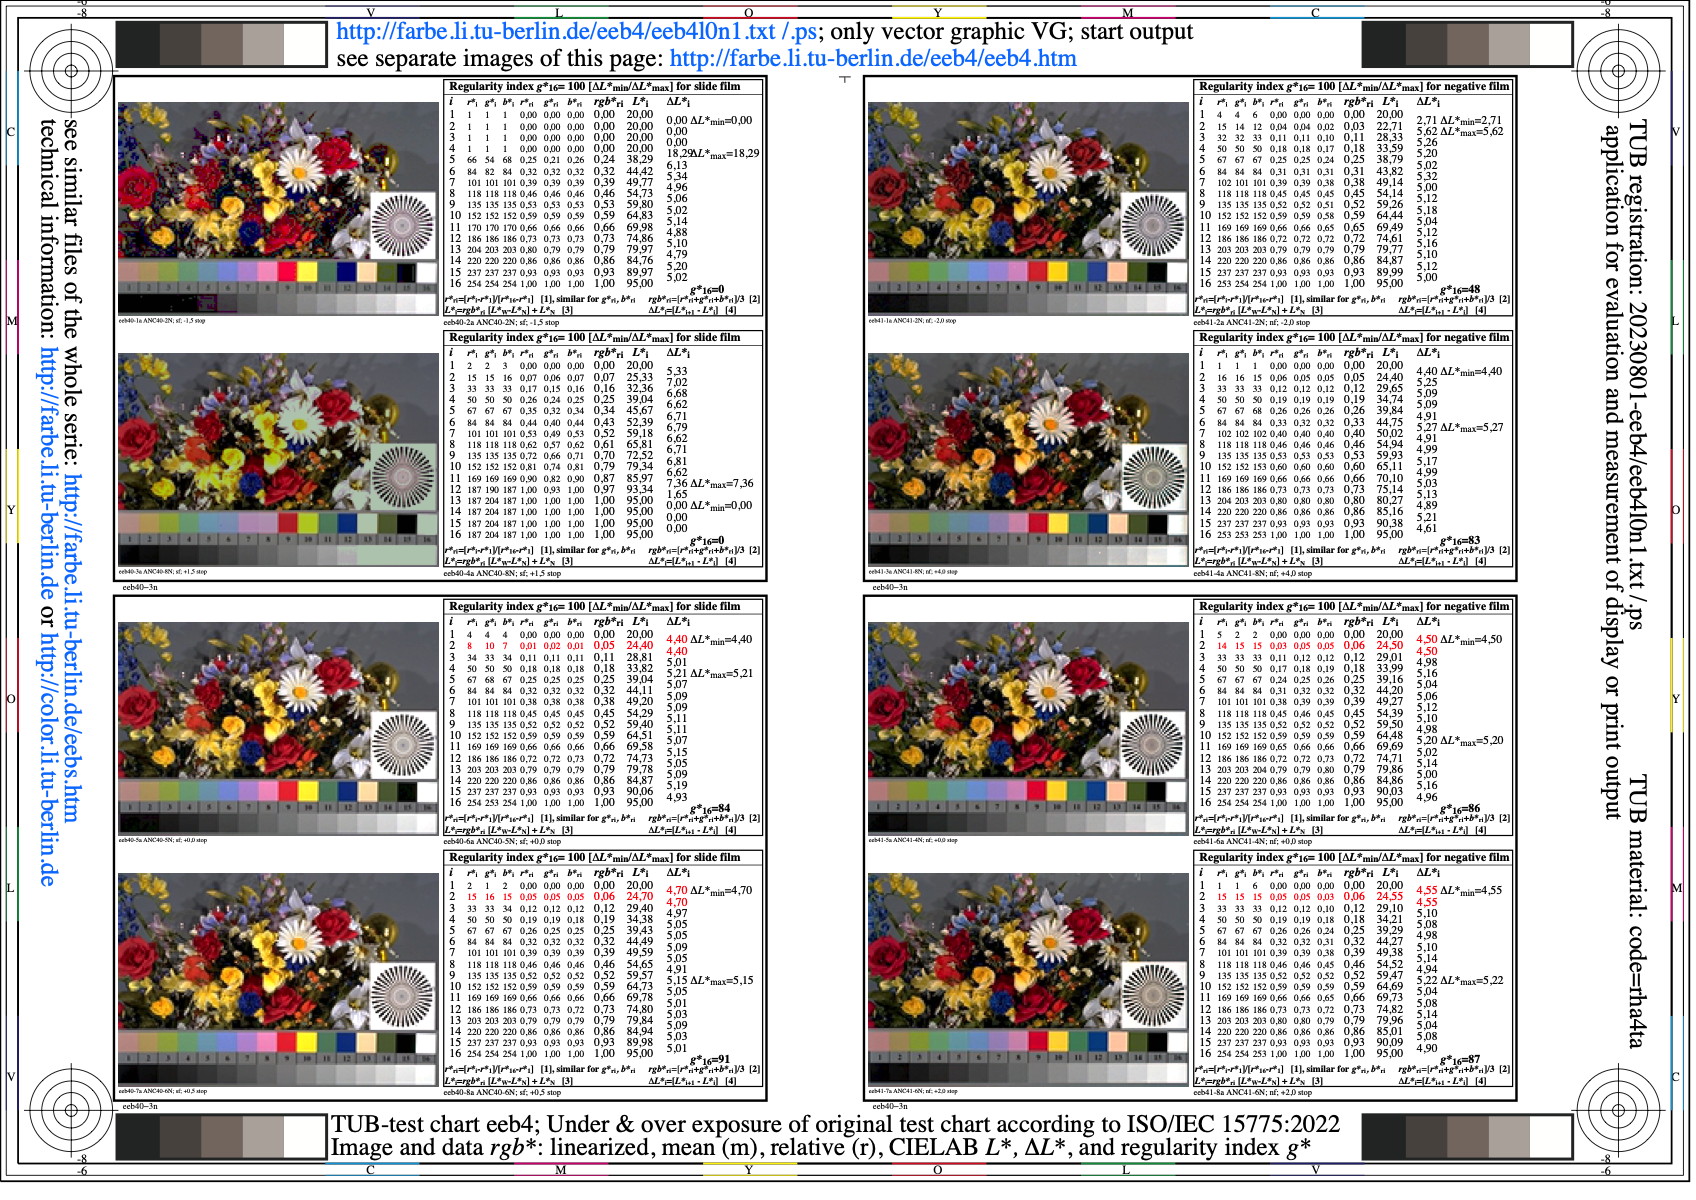
Image eeb4l0n1.jpg: Output in format A6 of the file
eeb4l0np.pdf, see
eeb4l0n1.
PS /
TXT /
PDF /
jpg
eeb4: TUB-test chart eeb4; under and over exposure of the original
chart according to ISO/IEC 15775:2022; image and data
rgb*, CIELAB L*, dL*, regularity index g*

Image eeb5l0n1.jpg: Output in format A6 of the file
eeb5l0np.pdf, see
eeb5l0n1.
PS /
TXT /
PDF /
jpg
eeb5: TUB-test chart eeb5; under and over exposure of the original
chart according to ISO/IEC 15775:2022; image and data
rgb*1, CIELAB L*, dL*, regularity index g*
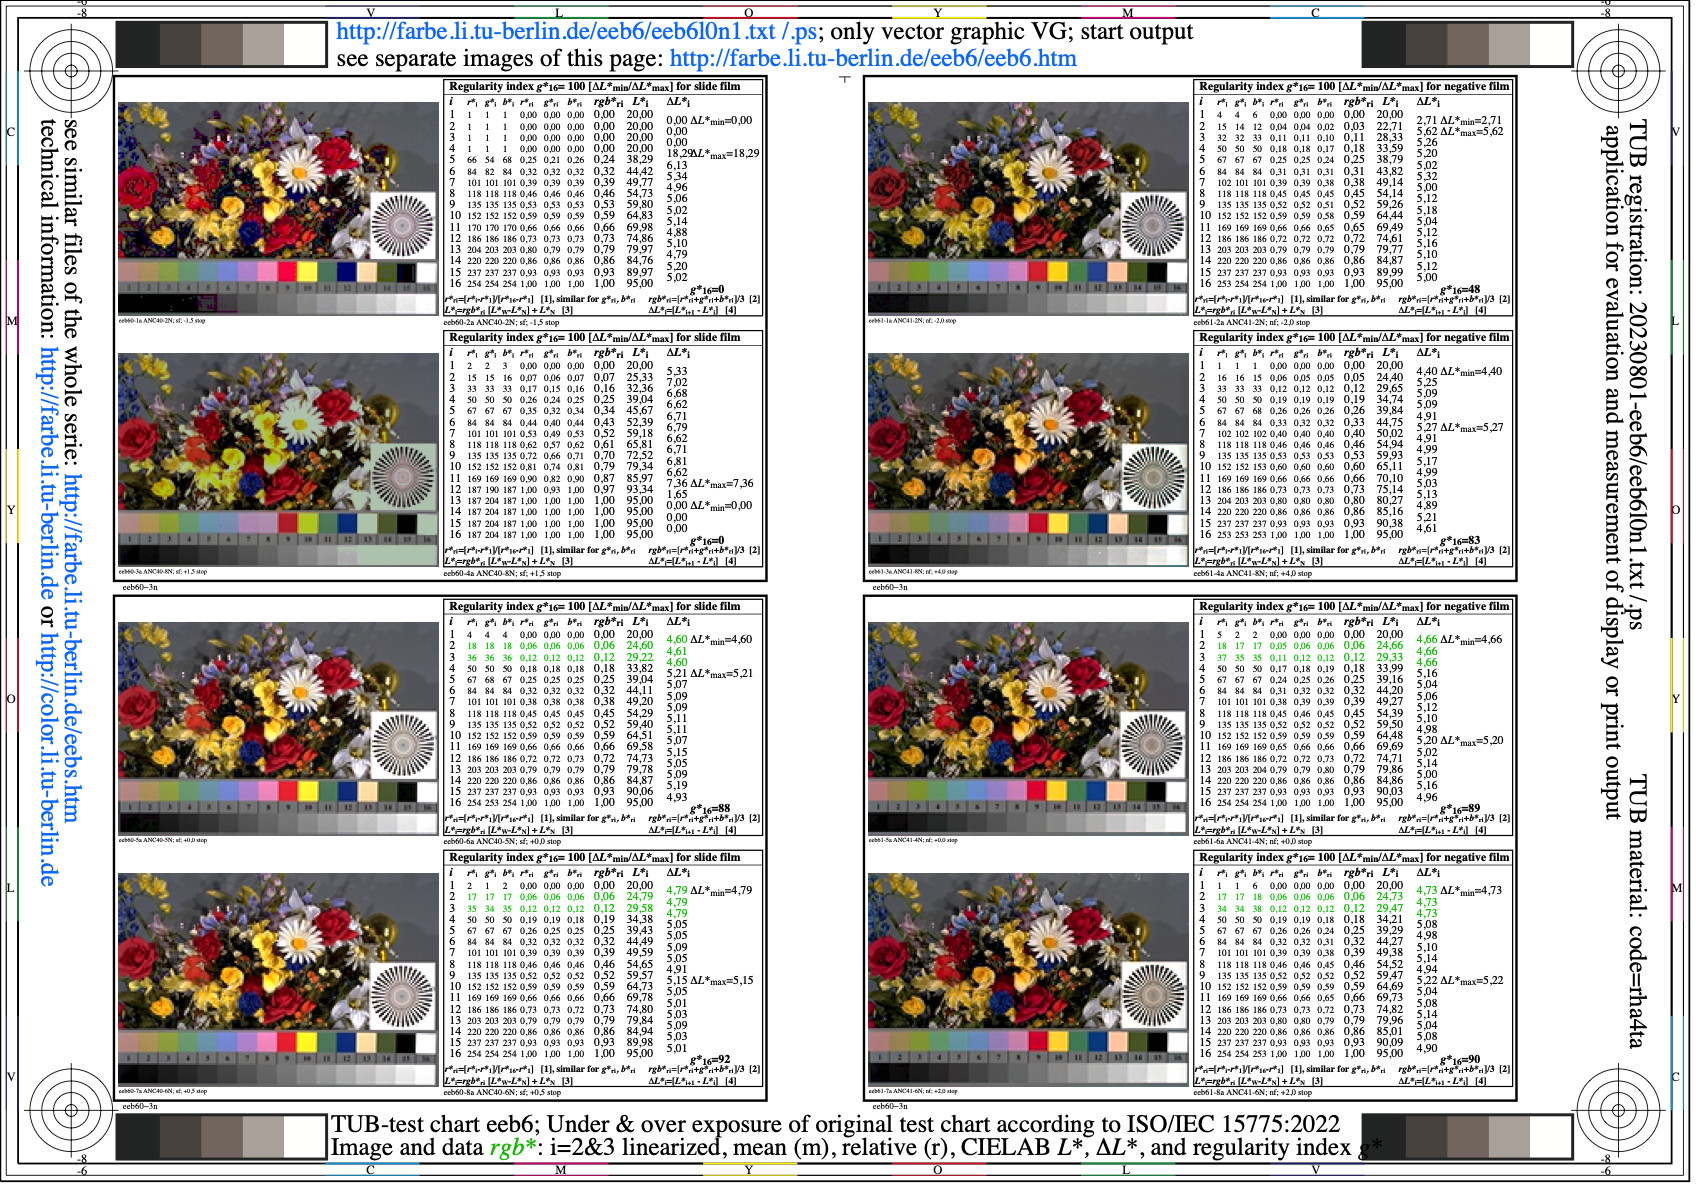
Image eeb6l0n1.jpg: Output in format A6 of the file
eeb6l0np.pdf, see
eeb6l0n1.
PS /
TXT /
PDF /
jpg
eeb6: TUB-test chart eeb6; under and over exposure of the original
chart according to ISO/IEC 15775:2022; image and data
rgb*12, CIELAB L*, dL*, regularity index g*
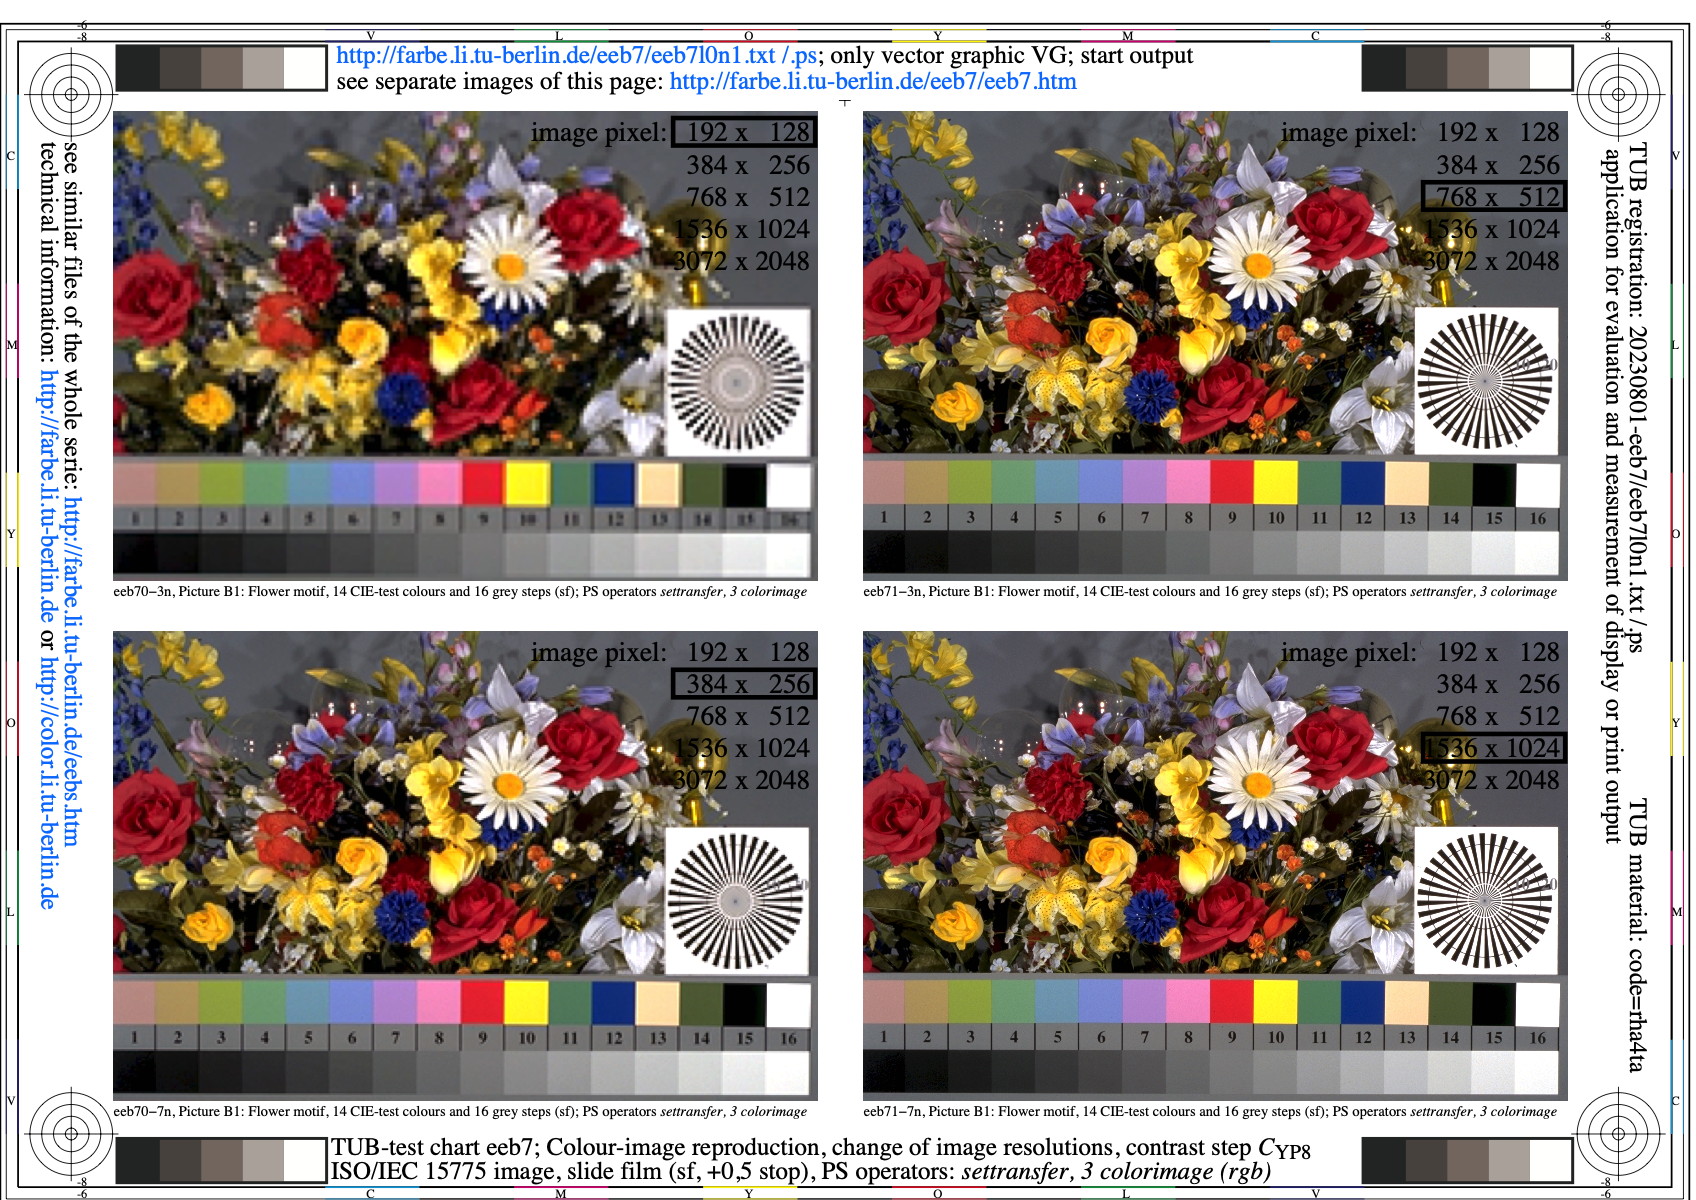
Image eeb7l0n1.jpg: Output in format A6 of the file
eeb7l0np.pdf, see
eeb7l0n1.
PS /
TXT /
PDF /
jpg
eeb7: TUB-test chart eeb7; colour image reproduction, 4 resolutions
image according to ISO/IEC 15775, slide film, sf, +0,5 stops
PS operators: settransfer, 3 colorimage (rgb)
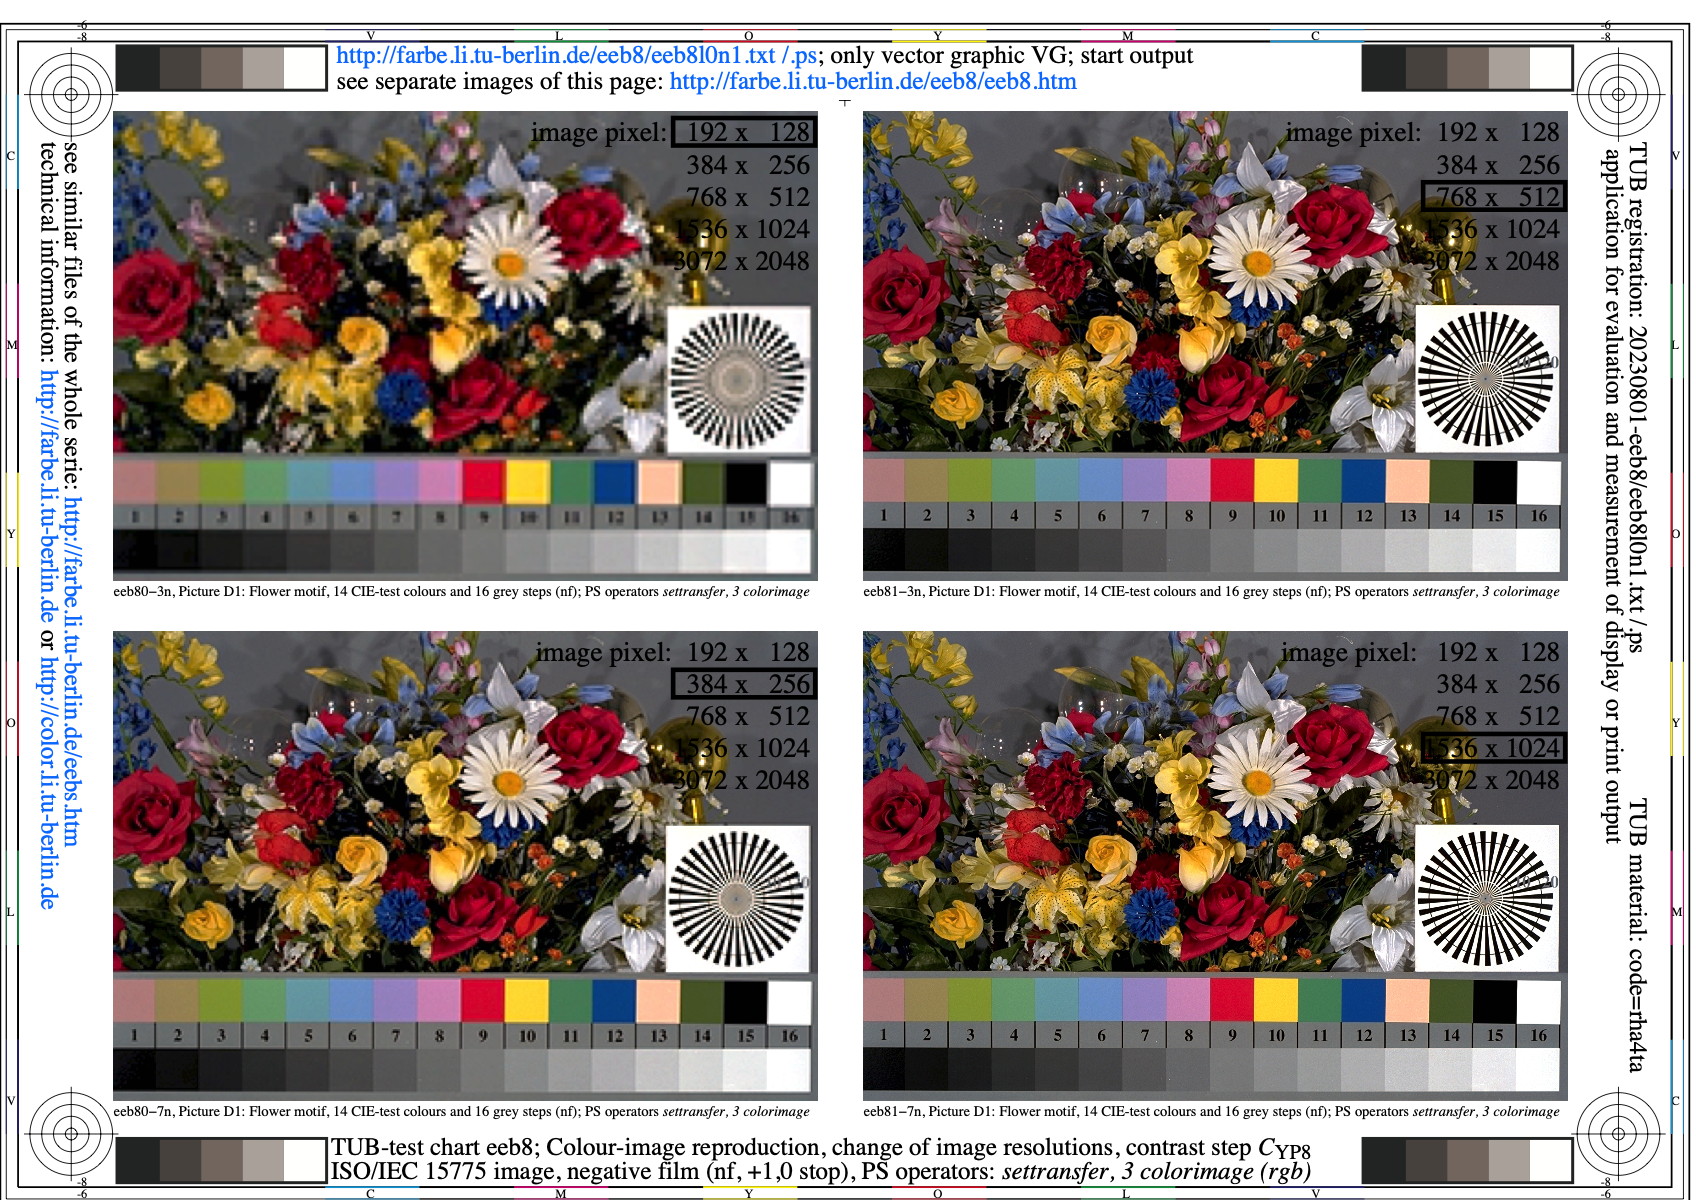
Image eeb8l0n1.jpg: Output in format A6 of the file
eeb8l0np.pdf, see
eeb8l0n1.
PS /
TXT /
PDF /
jpg
eeb8: TUB-test chart eeb8; colour image reproduction, 4 resolutions
image according to ISO/IEC 15775, negative film, nf, +1,0 stops
PS operators: settransfer, 3 colorimage (rgb)
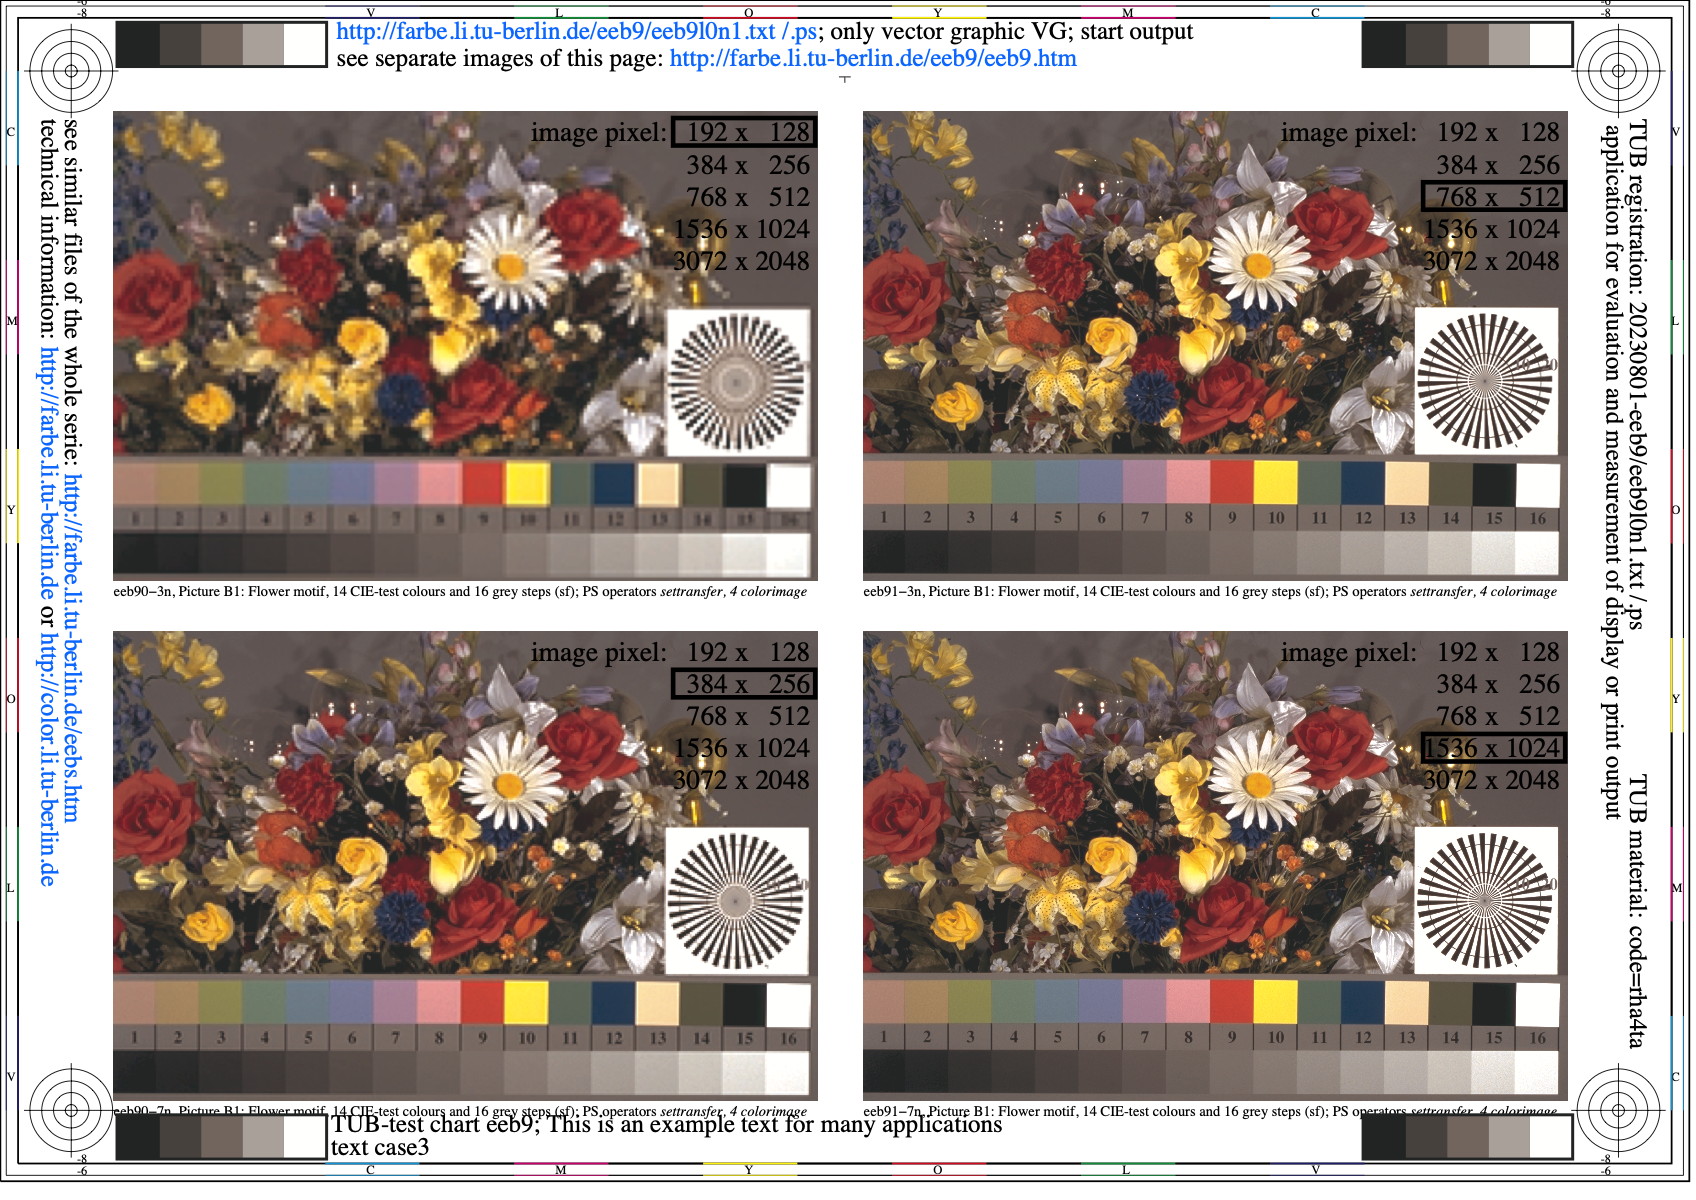
Image eeb9l0n1.jpg: Output in format A6 of the file
eeb9l0np.pdf, see
eeb9l0n1.
PS /
TXT /
PDF /
jpg
eeb9: TUB-test chart eeb9; colour image reproduction, 4 resolutions
image according to ISO/IEC 15775, slide film, sf, +0,5 stops
PS operators: settransfer, 4 colorimage (cmyk)
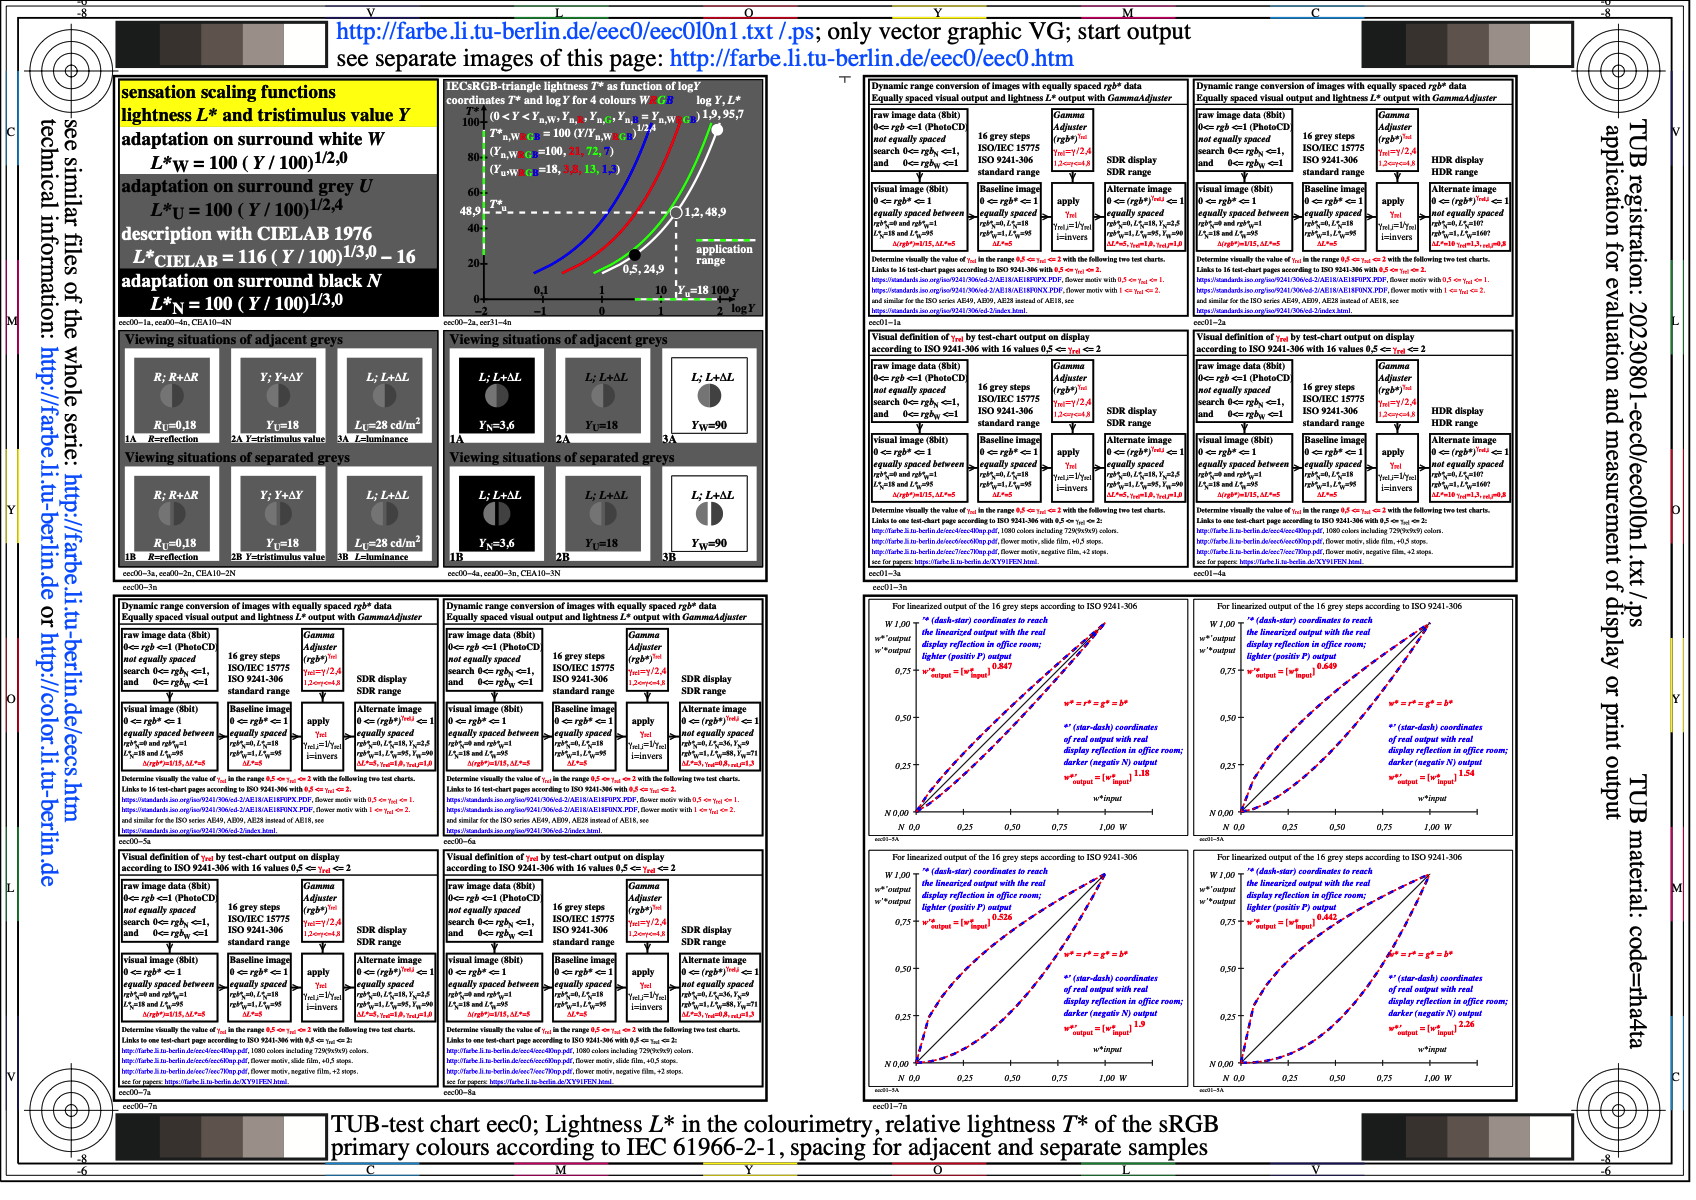
Image eec0l0n1.jpg: Output in format A6 of the file
eec0l0np.pdf, see
eec0l0n1.
PS /
TXT /
PDF /
jpg
eec0: TUB-test chart eec0; Lightness L* in colourimetry
Relative lightness T* of the sRGB primary colours
Spacing for adjacent and separate colours
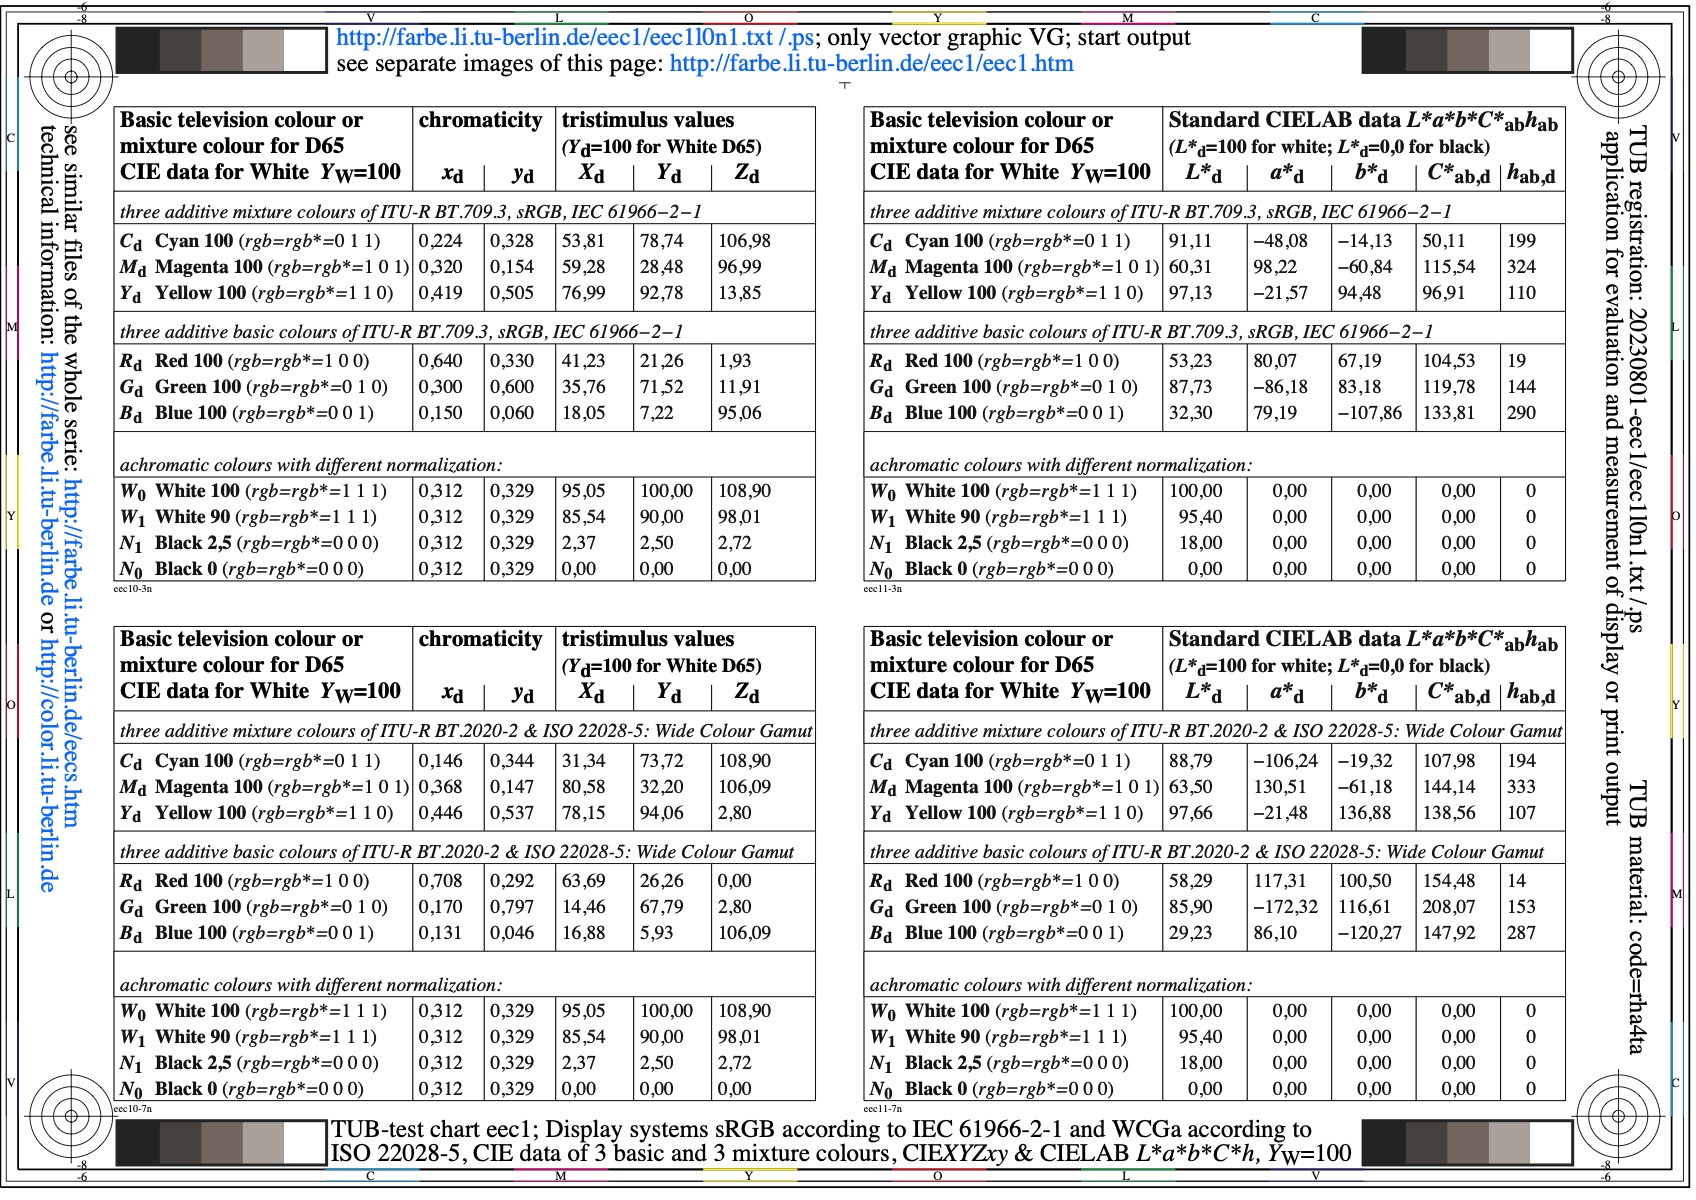
Image eec1l0n1.jpg: Output in format A6 of the file
eec1l0np.pdf, see
eec1l0n1.
PS /
TXT /
PDF /
jpg
eec1: TUB-test chart eec1; Display data CIEXYZxy and CIELAB
Table of primary colours RGB & mixture colours CMY, W & N
Normalization white YW=100 according to CIE 15
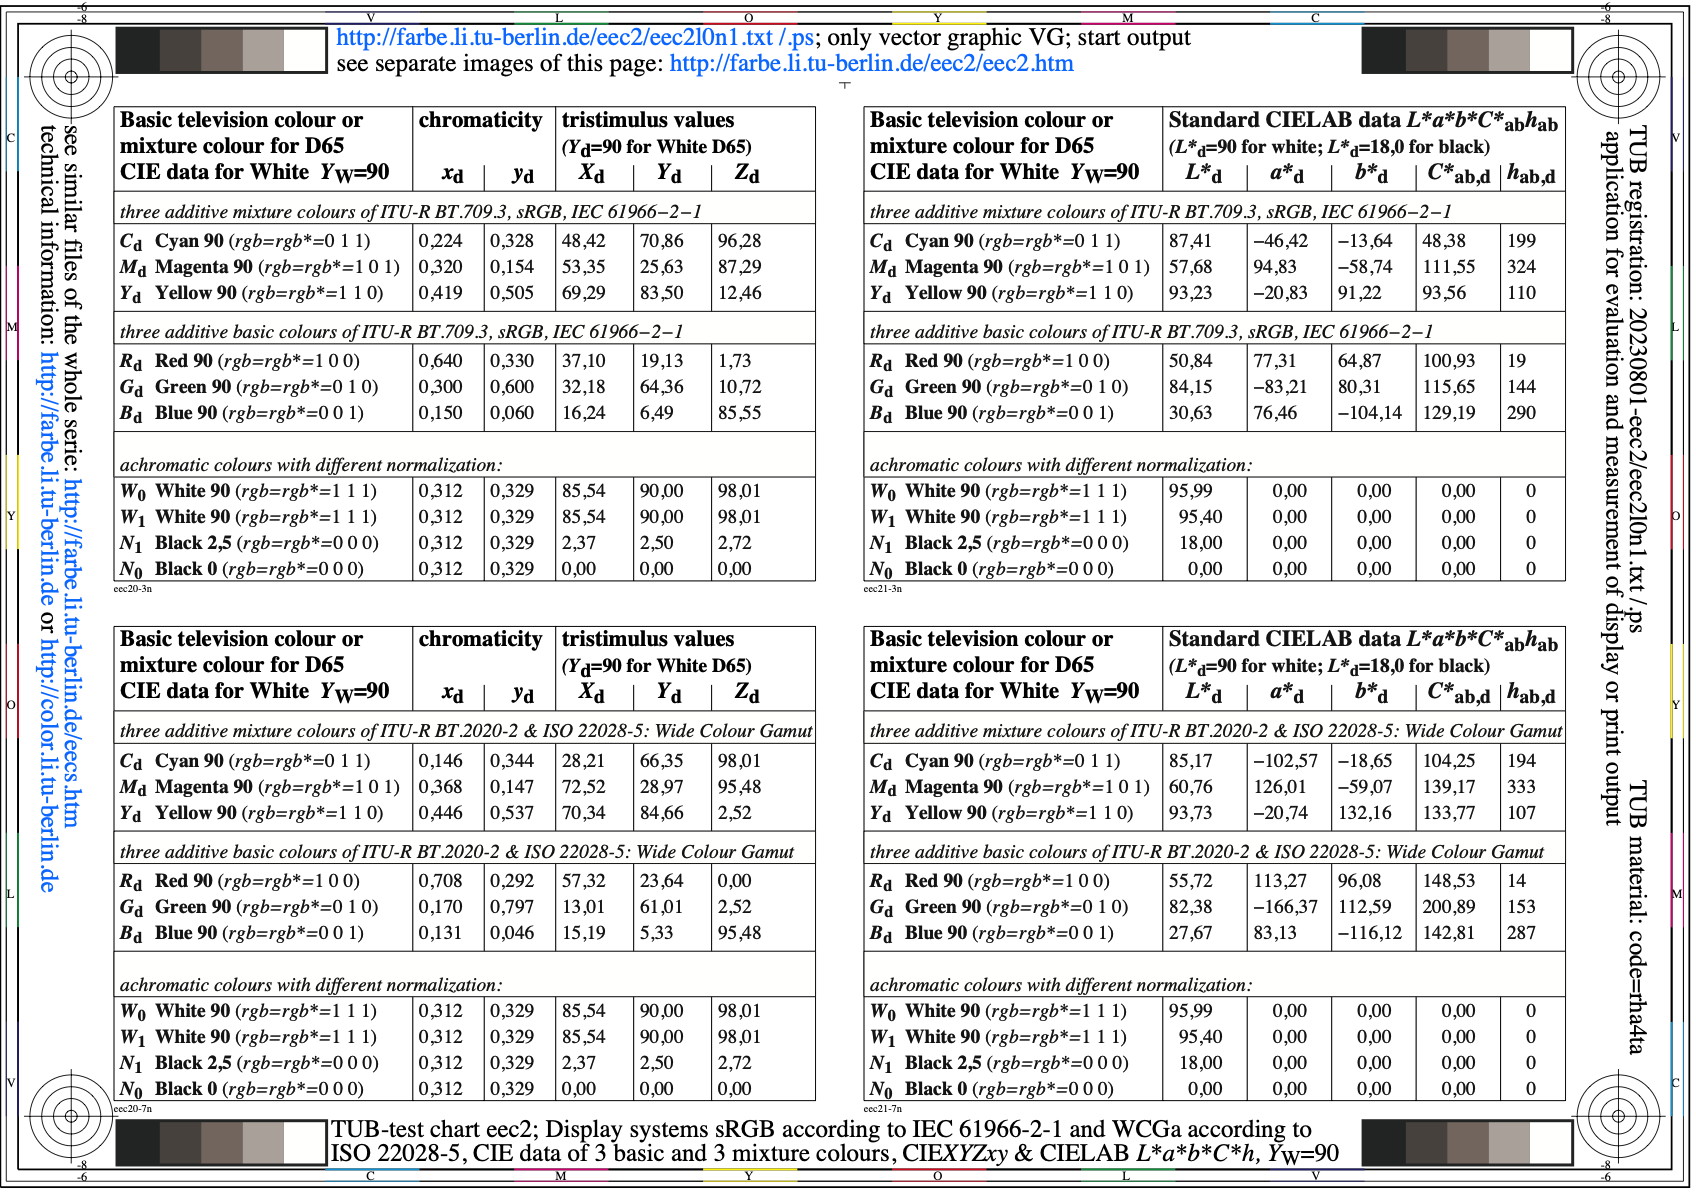
Image eec2l0n1.jpg: Output in format A6 of the file
eec2l0np.pdf, see
eec2l0n1.
PS /
TXT /
PDF /
jpg
eec2: TUB-test chart eec2; Display data CIEXYZxy and CIELAB
Table of primary colours RGB & mixture colours CMY, W & N
Normalization white YW=90 according to ISO/IEC 15775
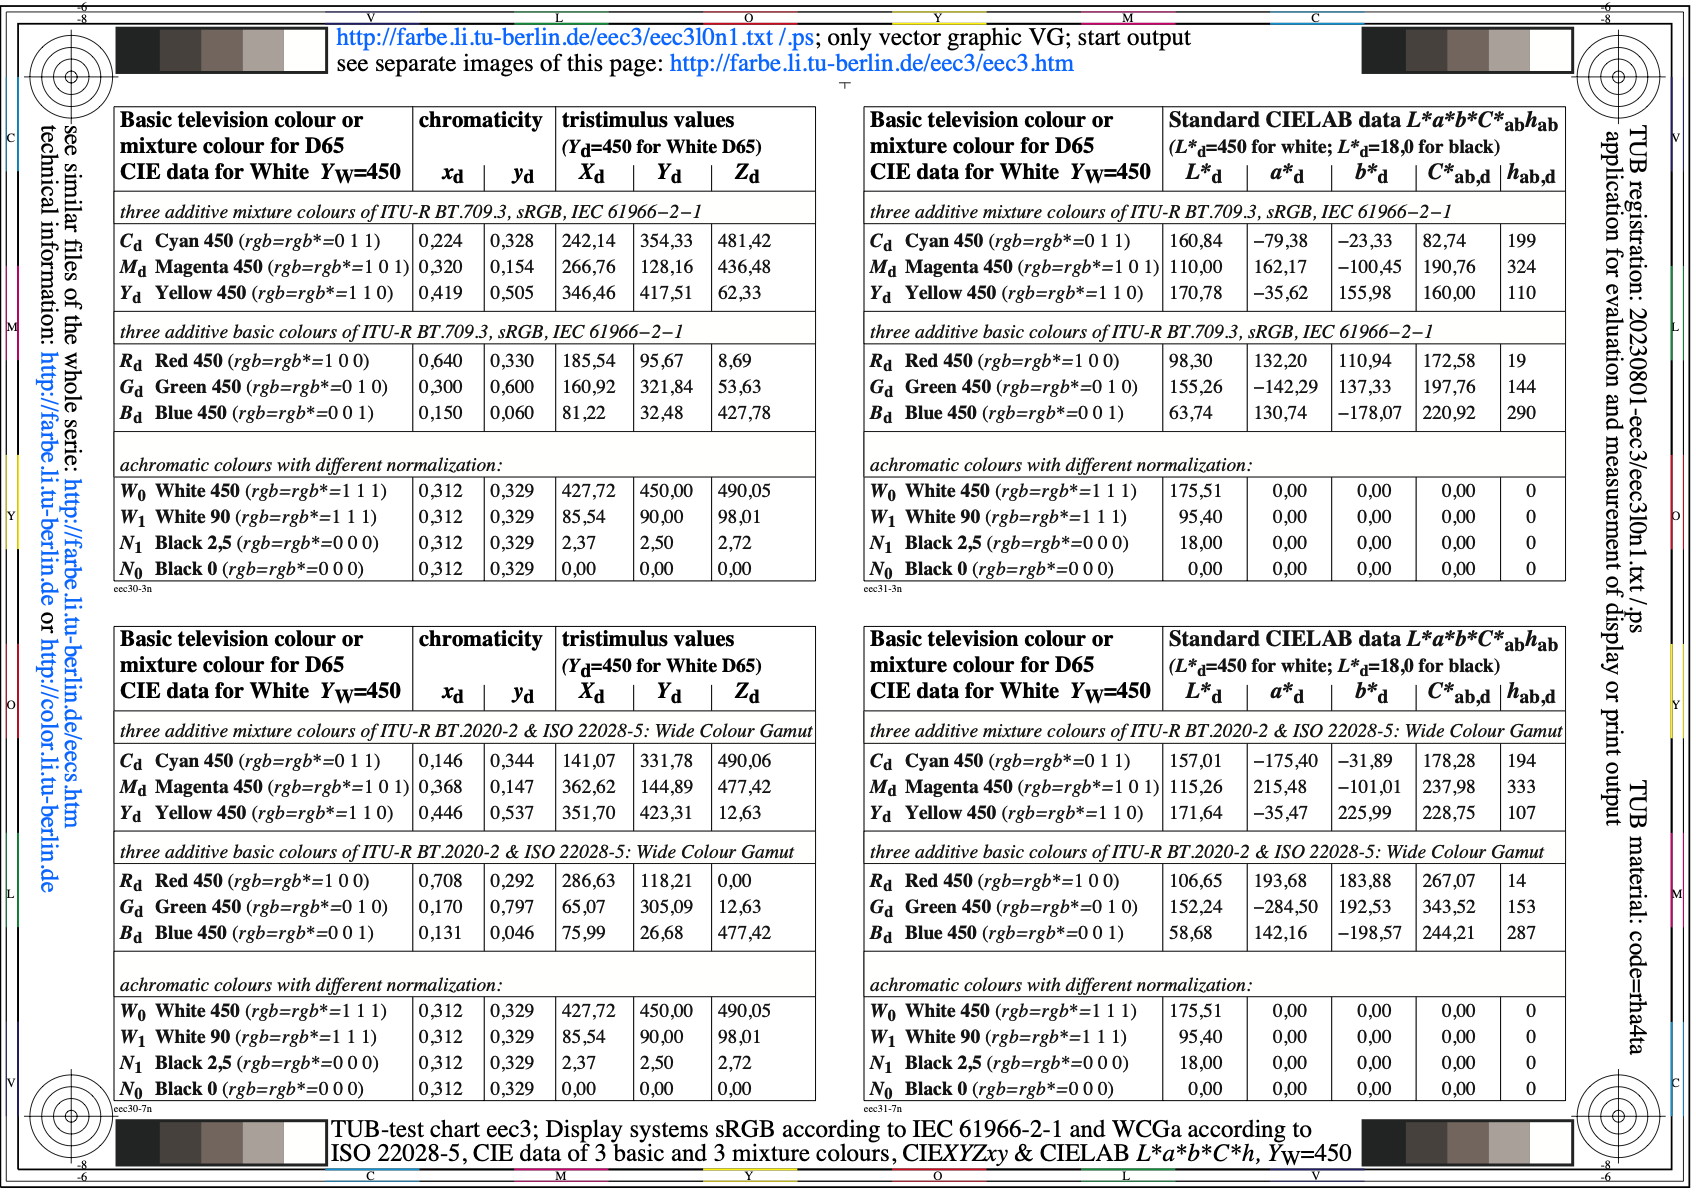
Image eec3l0n1.jpg: Output in format A6 of the file
eec3l0np.pdf, see
eec3l0n1.
PS /
TXT /
PDF /
jpg
eec3: TUB-test chart eec3; Display data CIEXYZxy and CIELAB
Table of primary colours RGB & mixture colours CMY, W & N
Normalization white YW=500 according to ISO/TS 28028-5
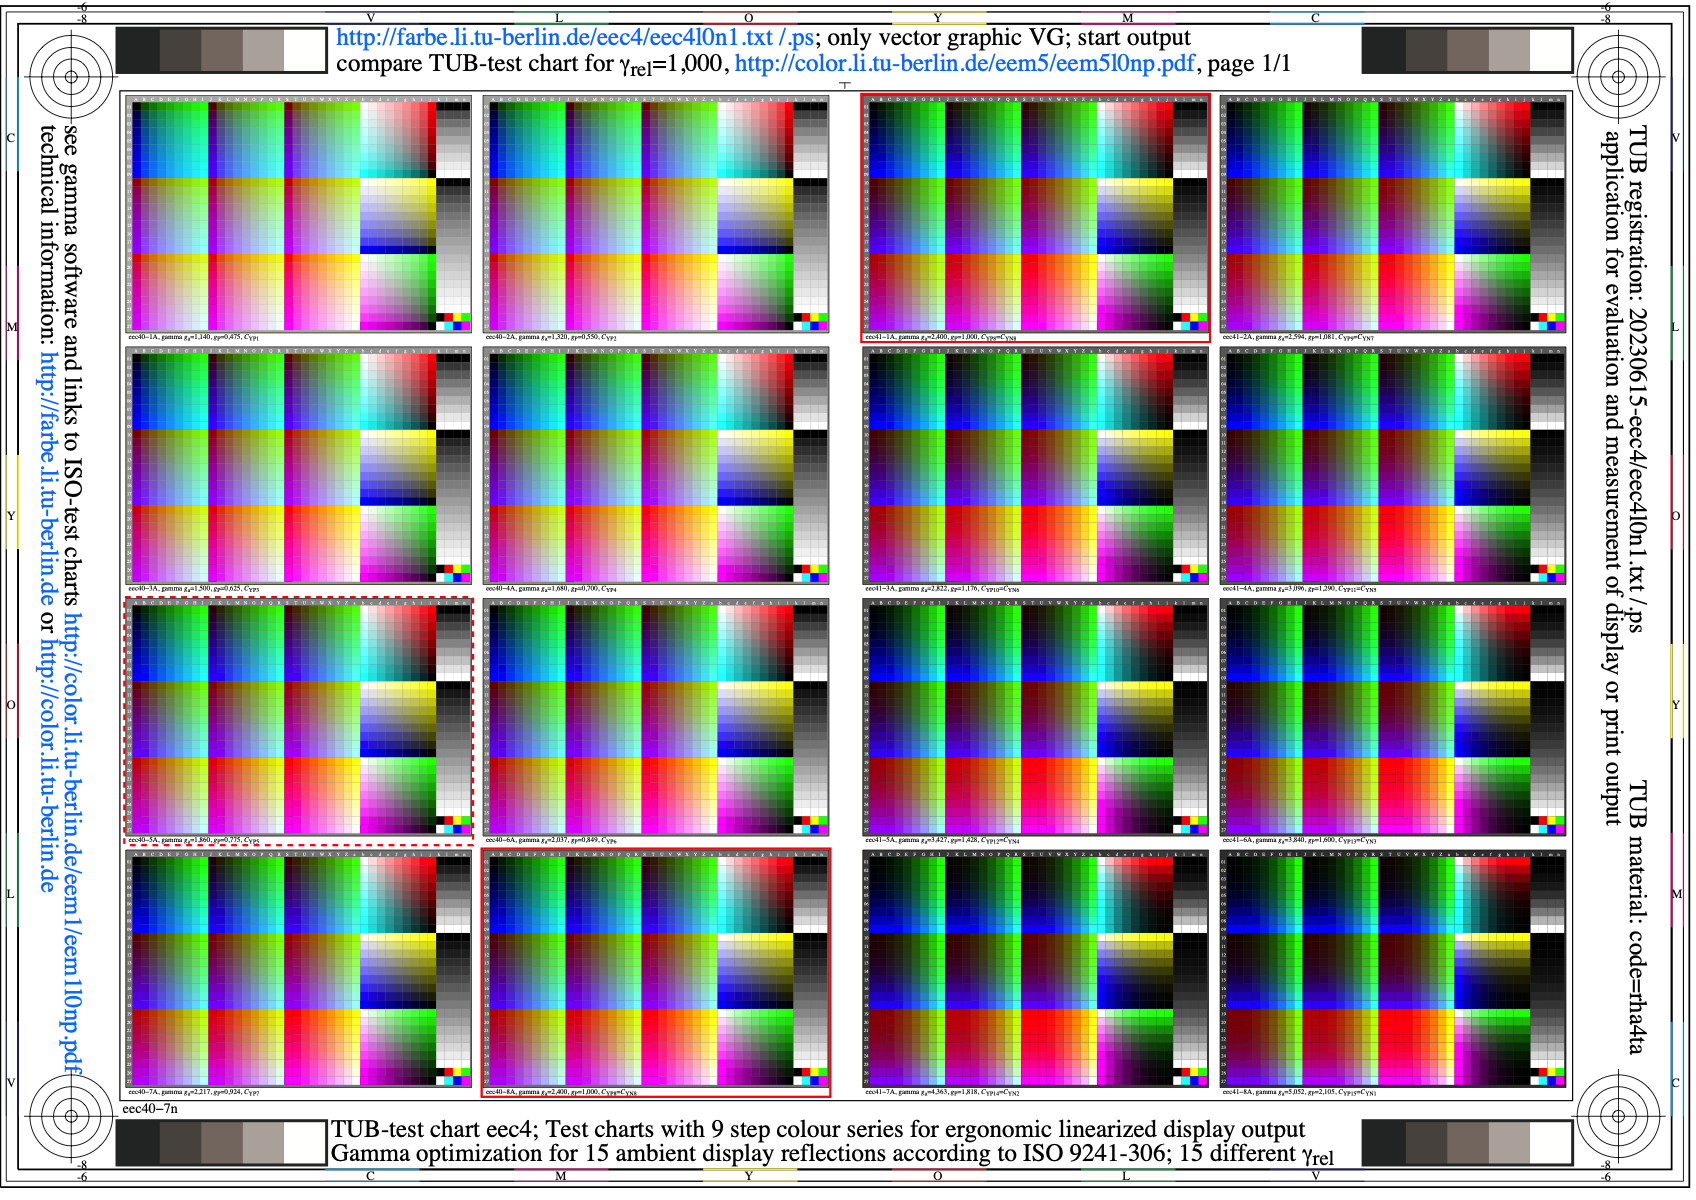
Image eec4l0n1.jpg: Output in format A6 of the file
eec4l0np.pdf, see
eec4l0n1.
PS /
TXT /
PDF /
jpg
eec4: TUB-test chart eec4; Test chart with 1080 colours
729(=9x9x9) colours for input and output linearization
16 Gamma walues 0,5<=rel. gamma<=2, red frame for g=1 & 0,77
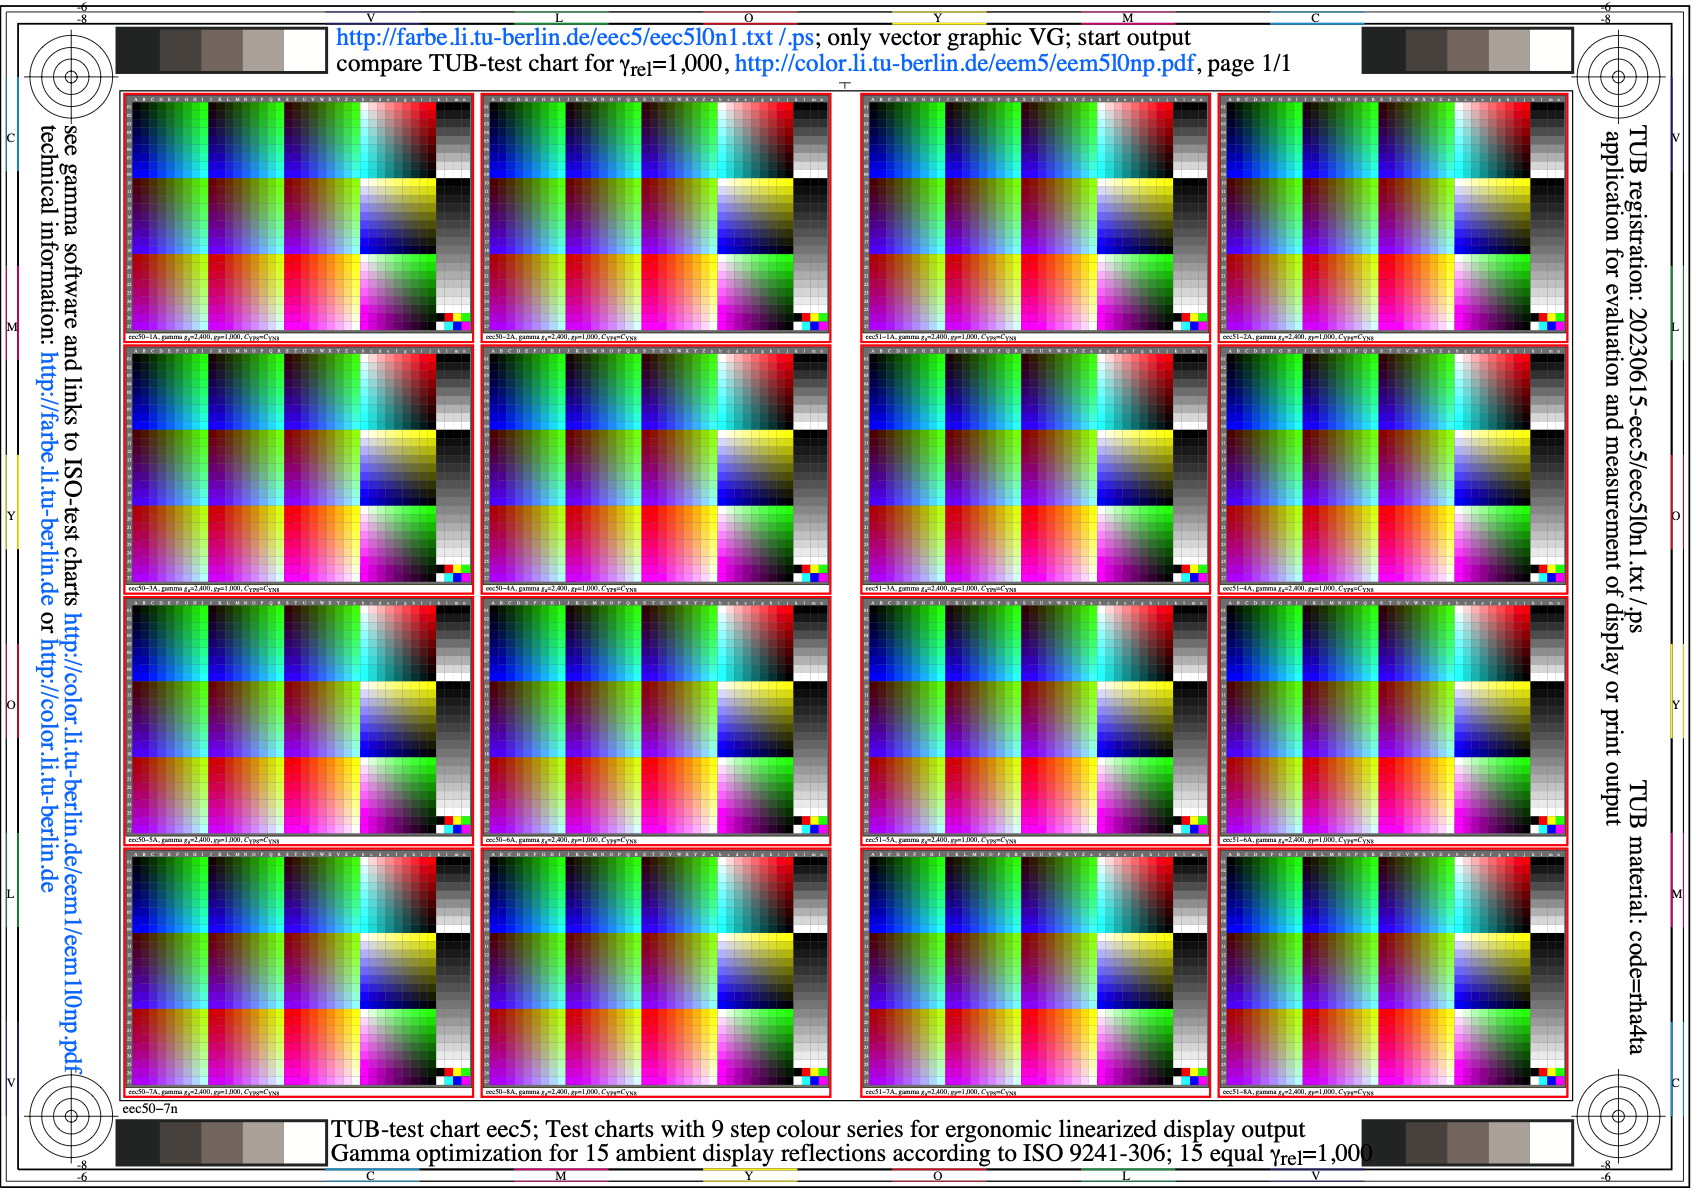
Image eec5l0n1.jpg: Output in format A6 of the file
eec5l0np.pdf, see
eec5l0n1.
PS /
TXT /
PDF /
jpg
eec5: TUB-test chart eec5; Test chart with 1080 colours
729(=9x9x9) colours for input and output linearization
Image visual equal Yes/No?, red frame for g=1
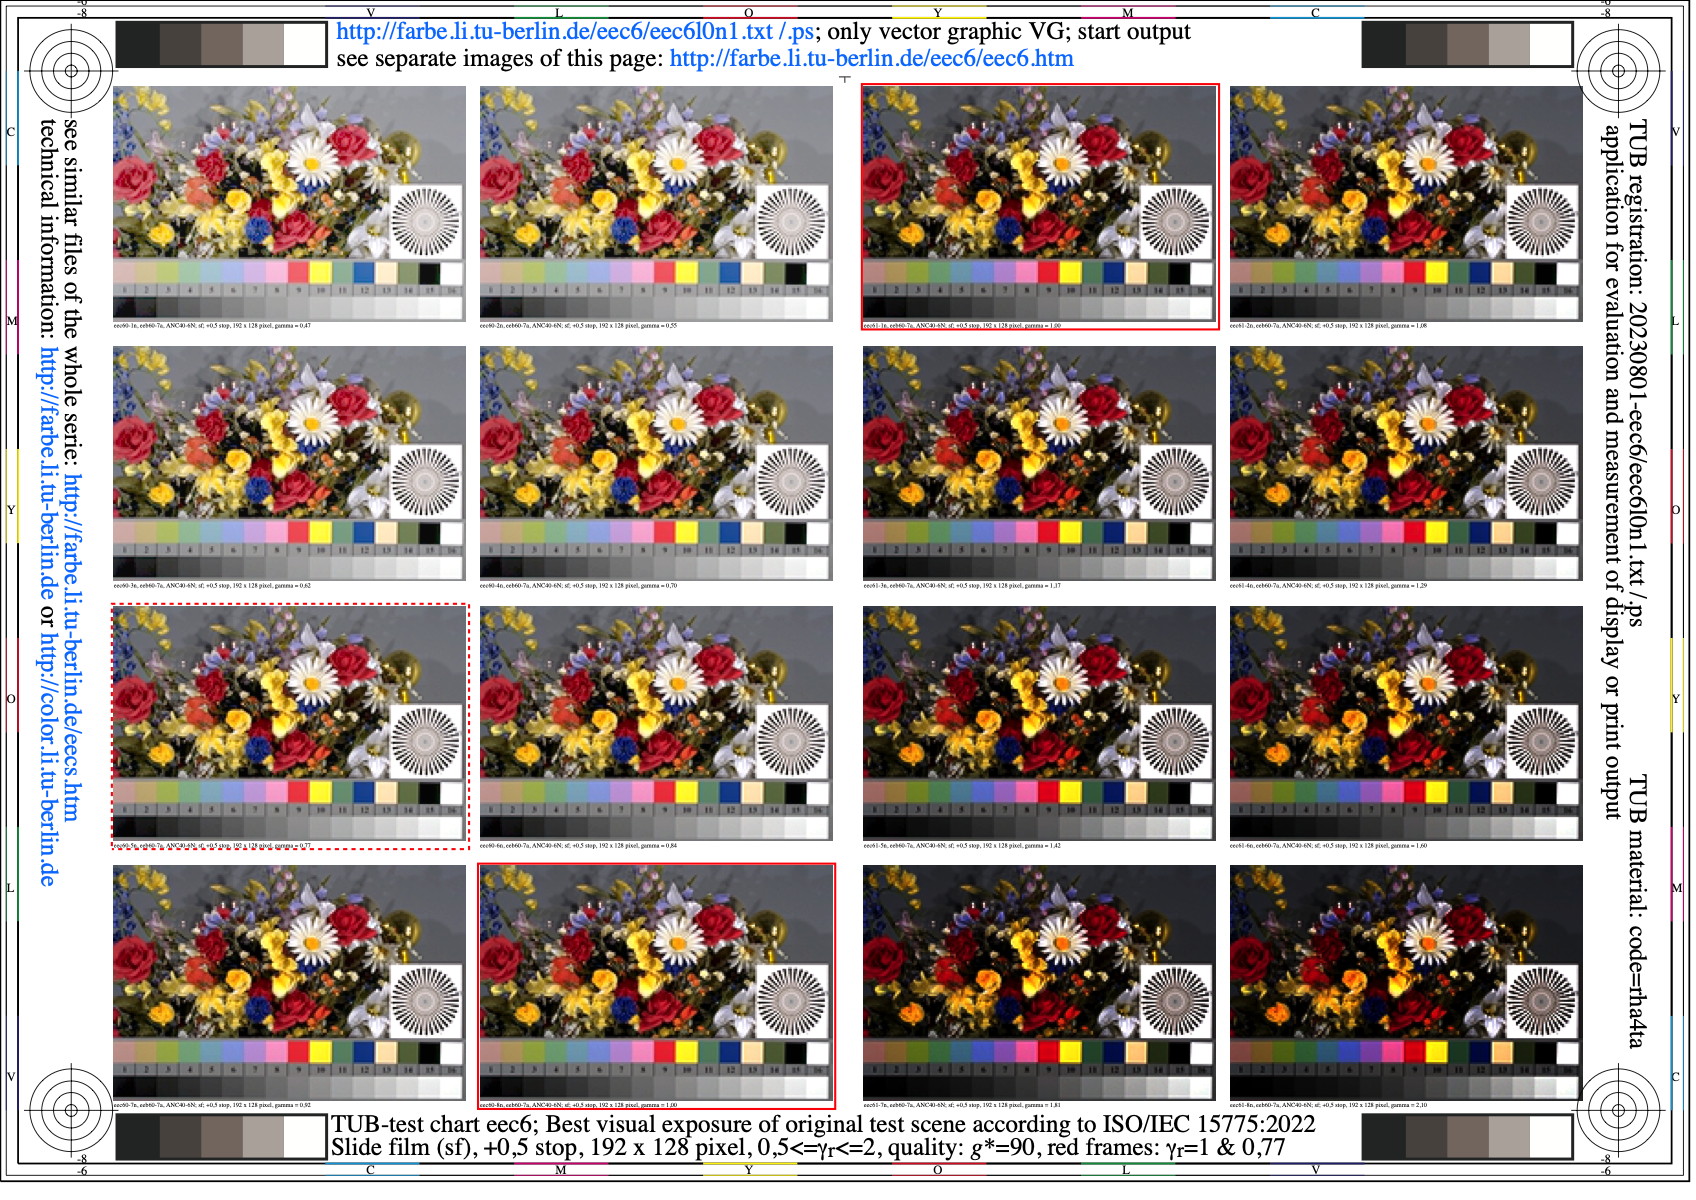
Image eec6l0n1.jpg: Output in format A6 of the file
eec6l0np.pdf, see
eec6l0n1.
PS /
TXT /
PDF /
jpg
eec6: TUB-test chart eec6; Best visual exposure, flower
motiv according to ISO/IEC 15775, slide film (sf), +0,5
stops, quality g*=90, 16 gamma values with 0,5<=rel. gamma<=2
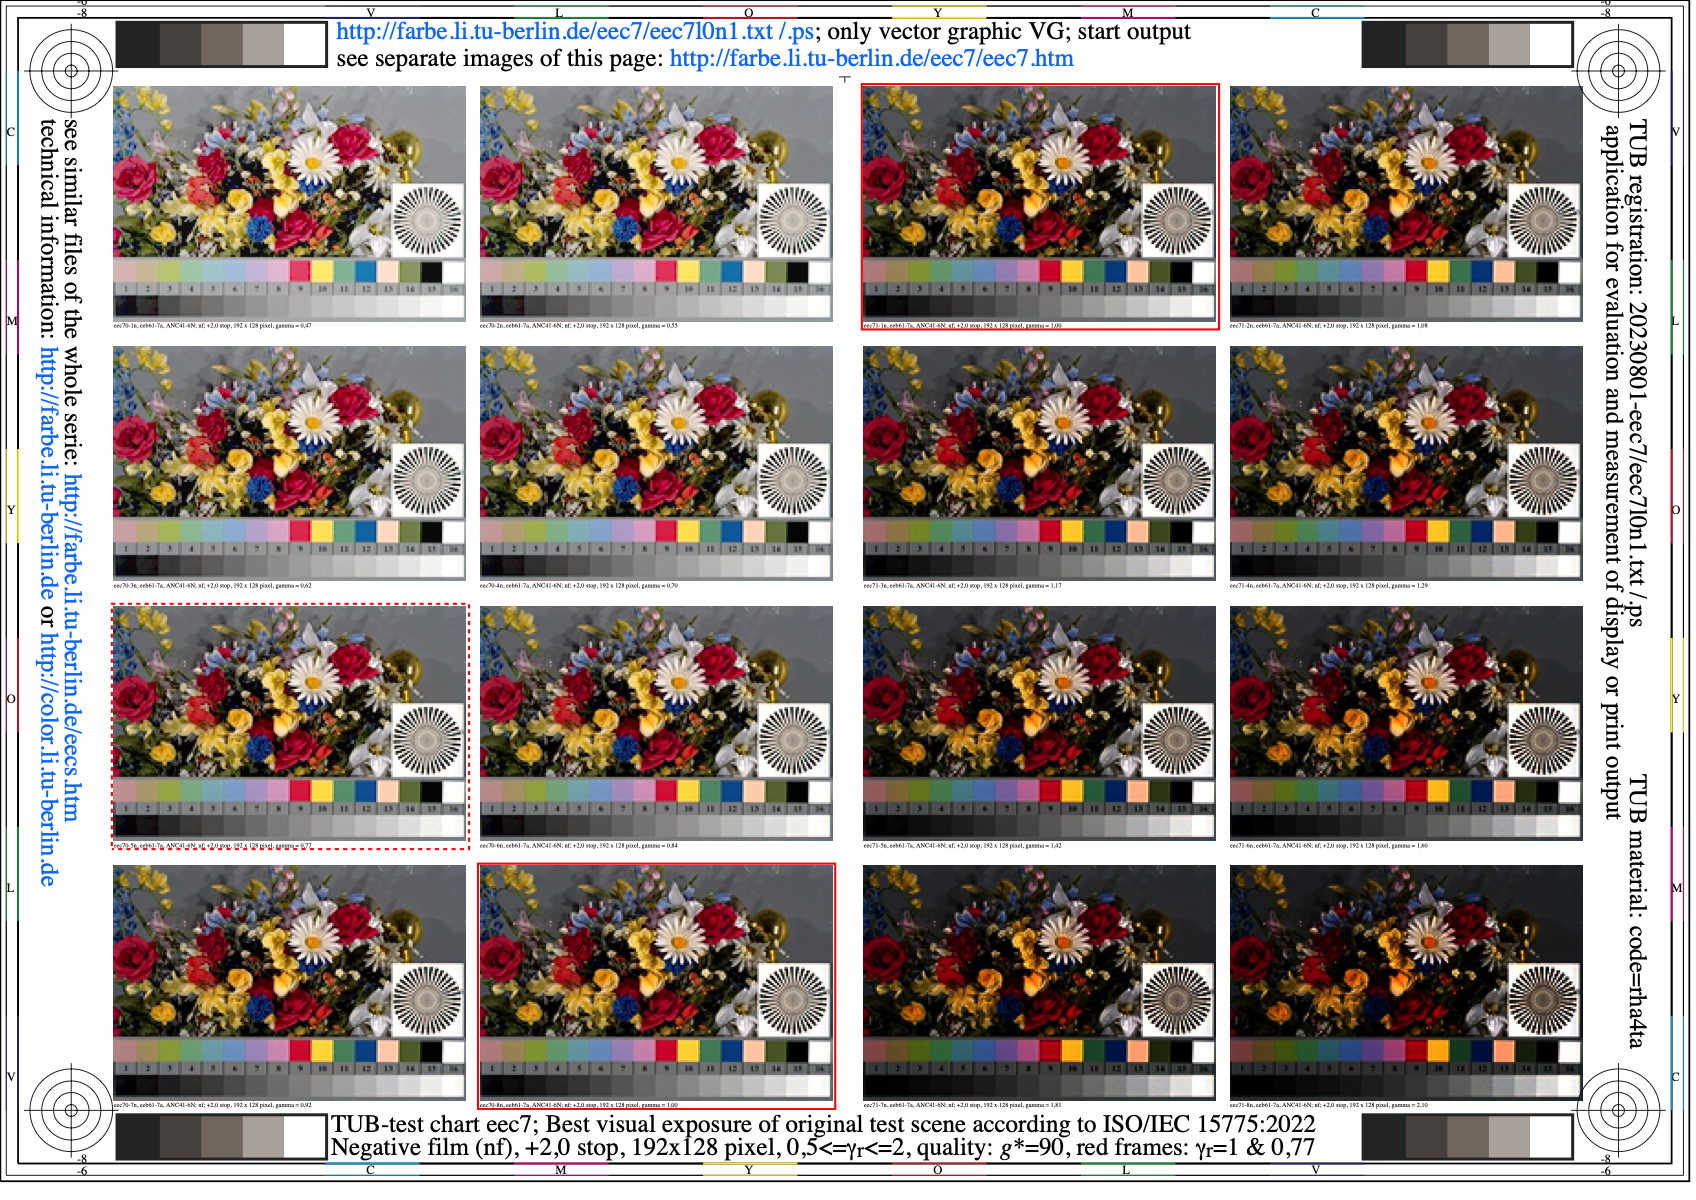
Image eec7l0n1.jpg: Output in format A6 of the file
eec7l0np.pdf, see
eec7l0n1.
PS /
TXT /
PDF /
jpg
eec7: TUB-test chart eec7; Best visual exposure, flower
motif according to ISO/IEC 15775, negative film (nf), +2,0
stops, quality g*=90, 16 gamma values with 0,5<=rel. gamma<=2
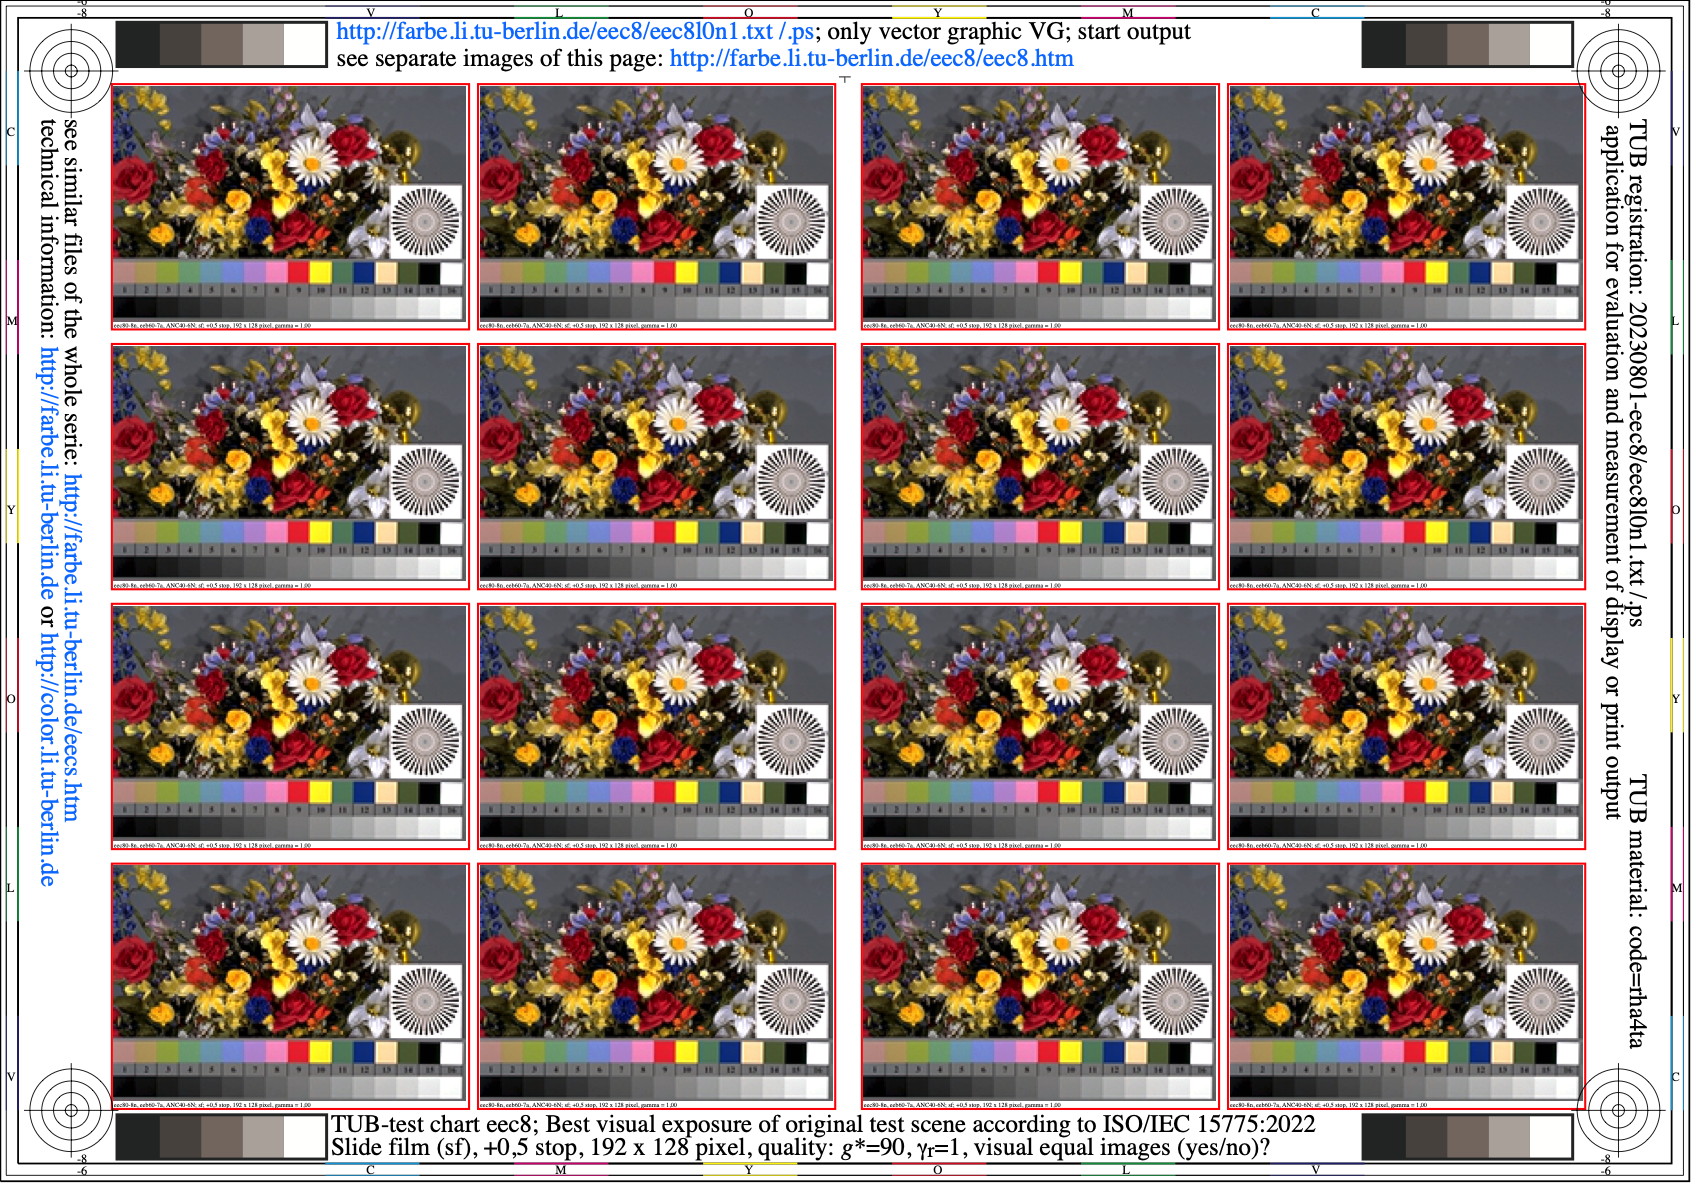
Image eec8l0n1.jpg: Output in format A6 of the file
eec8l0np.pdf, see
eec8l0n1.
PS /
TXT /
PDF /
jpg
eec8: TUB-test chart eec8; Best visual exposure, flower
motiv according to ISO/IEC 15775, slide film (sf), +0,5
stops, quality g*=90, equal images: gamma=1, all images equal?
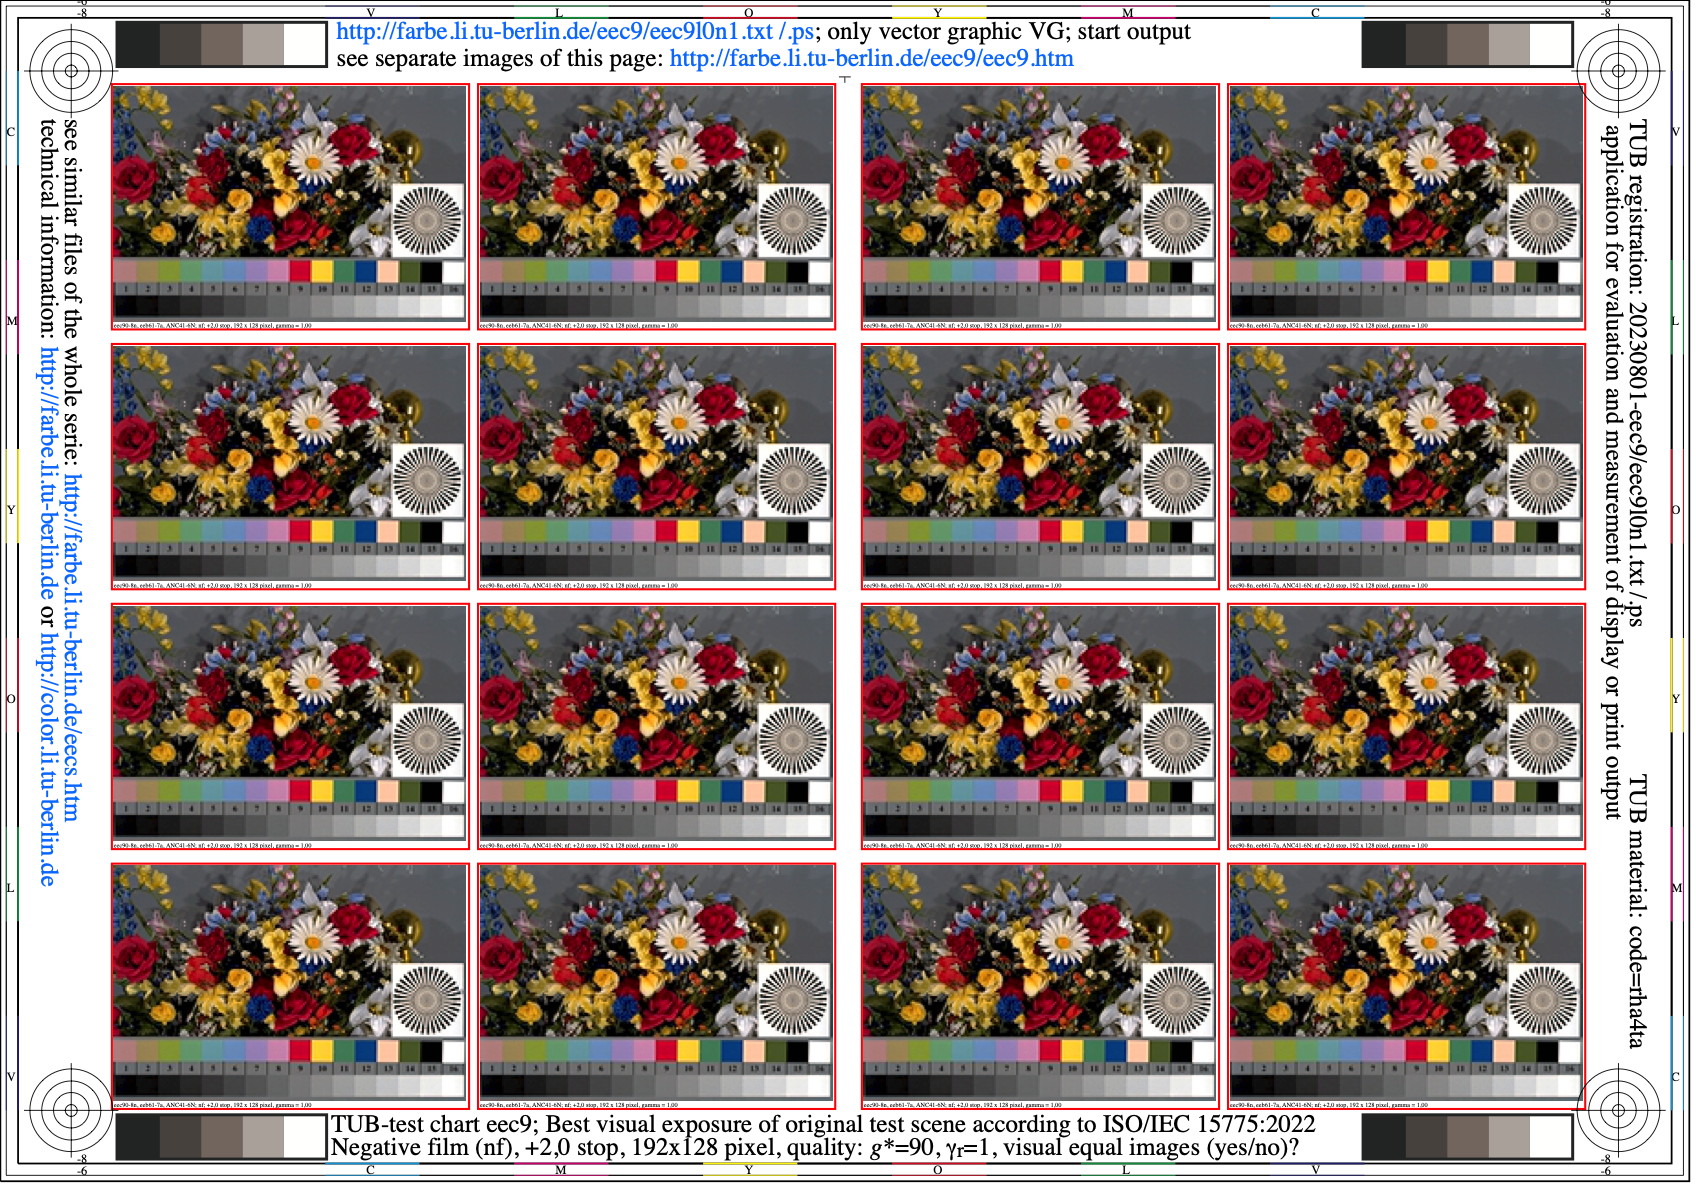
Image eec9l0n1.jpg: Output in format A6 of the file
eec9l0np.pdf, see
eec9l0n1.
PS /
TXT /
PDF /
jpg
eec9: TUB-test chart eec9; Best visual exposure, flower
motiv according to ISO/IEC 15775, negative film (nf), +2,0
stops, quality g*=90, equal images: gamma=1. all images equal?
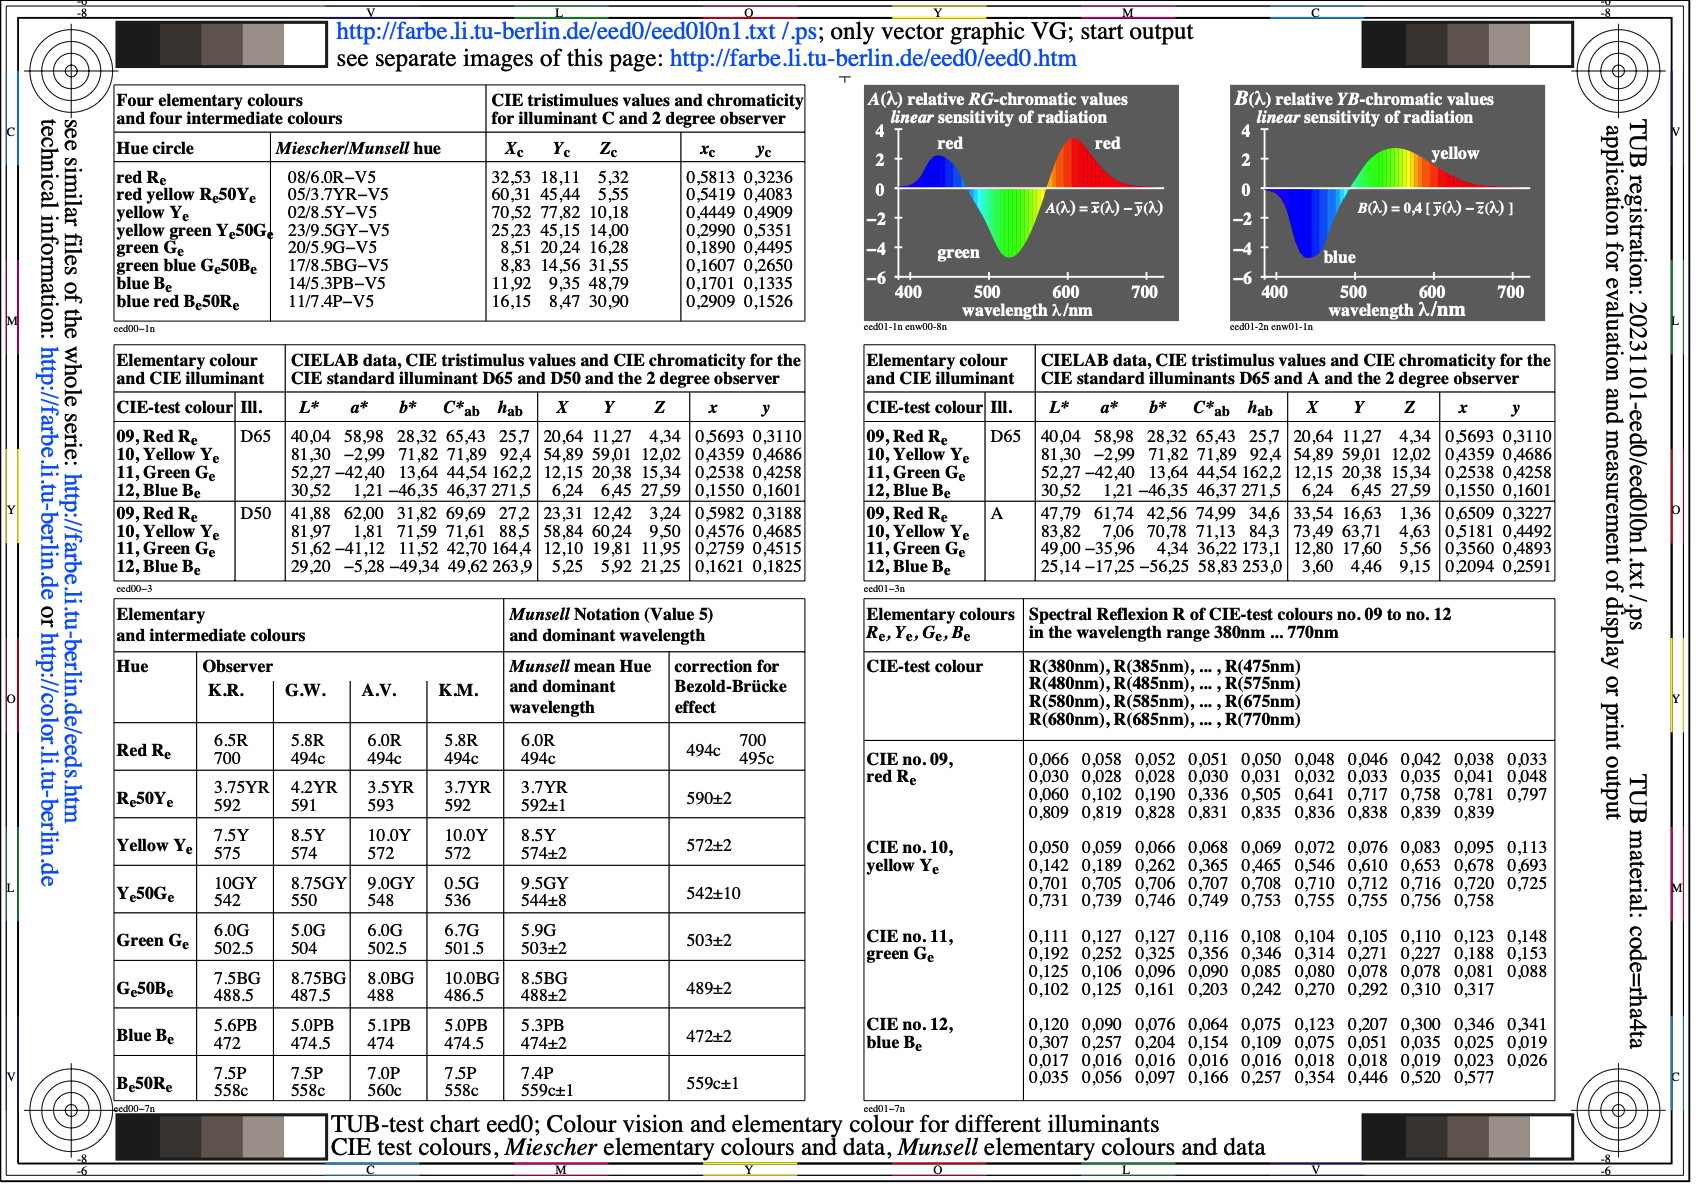
Image eed0l0n1.jpg: Output in format A6 of the file
eed0l0np.pdf, see
eed0l0n1.
PS /
TXT /
PDF /
jpg
eed0: TUB-test chart eed0; Colour vision and elementary colours
CIE-test colours, Miescher elementary colours
Munsell elementary colours and data

Image eed1l0n1.jpg: Output in format A6 of the file
eed1l0np.pdf, see
eed1l0n1.
PS /
TXT /
PDF /
jpg
eed1: TUB-test chart eed1; Examples of afine chroma metric
chroma enhancement with rgb* -> rgb*Xn
device colours Xd = RYGCBMd; transfers n=00 to 04

Image eed2l0n1.jpg: Output in format A6 of the file
eed2l0np.pdf, see
eed2l0n1.
PS /
TXT /
PDF /
jpg
eed2: TUB-test chart eed2; Examples of afine chroma metric
chroma reduction with rgb* -> rgb*Xn
device colours Xd = RYGCBMd; transfers n=05 to 08

Image eed3l0n1.jpg: Output in format A6 of the file
eed3l0np.pdf, see
eed3l0n1.
PS /
TXT /
PDF /
jpg
eed3: TUB-test chart eed3; Under work

Image eed4l0n1.jpg: Output in format A6 of the file
eed4l0np.pdf, see
eed4l0n1.
PS /
TXT /
PDF /
jpg
eed4: TUB-test chart eed2; Under work
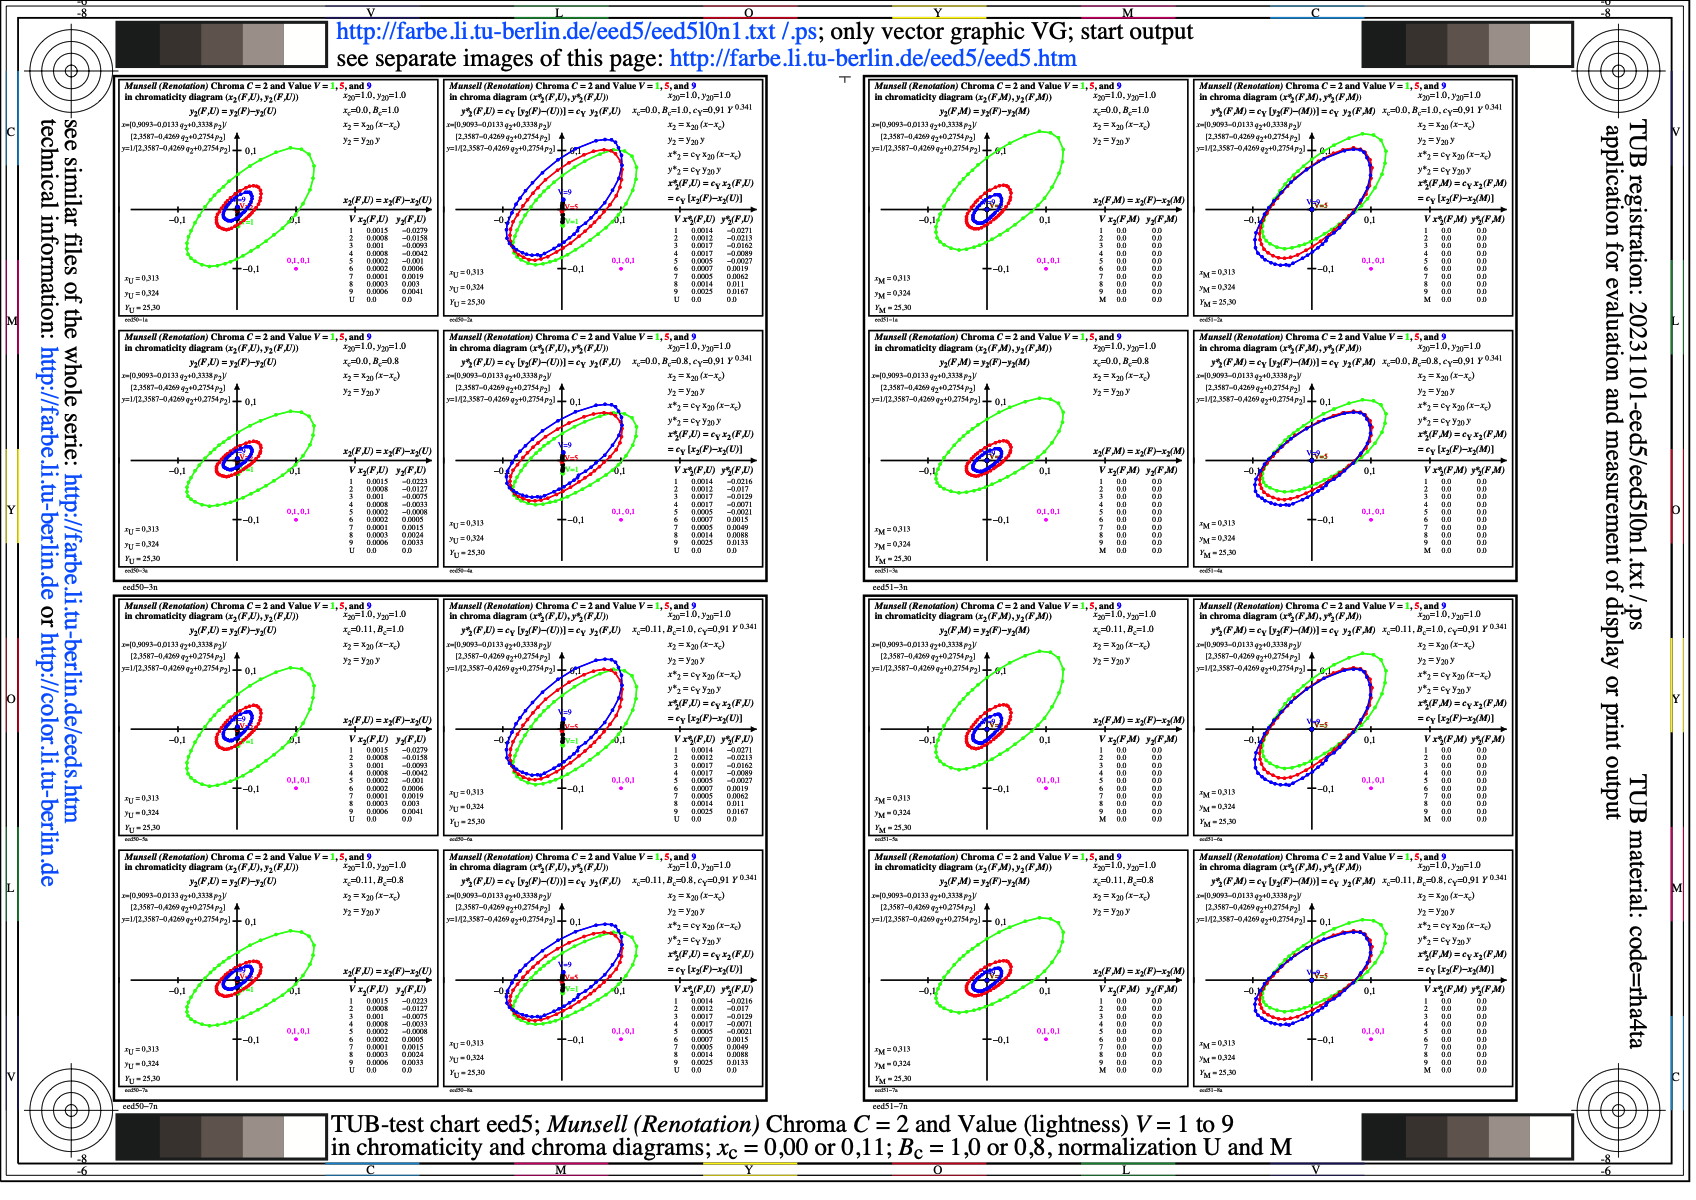
Image eed5l0n1.jpg: Output in format A6 of the file
eed5l0np.pdf, see
eed5l0n1.
PS /
TXT /
PDF /
jpg
eed5: TUB-test chart eed5; Munsell Chroma 2 and Value 1, 5, 9
in chromaticity and chroma diagram (x2, y2), (x2*, y2*)
xc=0,00 or 0,11, Bc=1,0 or 0,8, normalization U or M
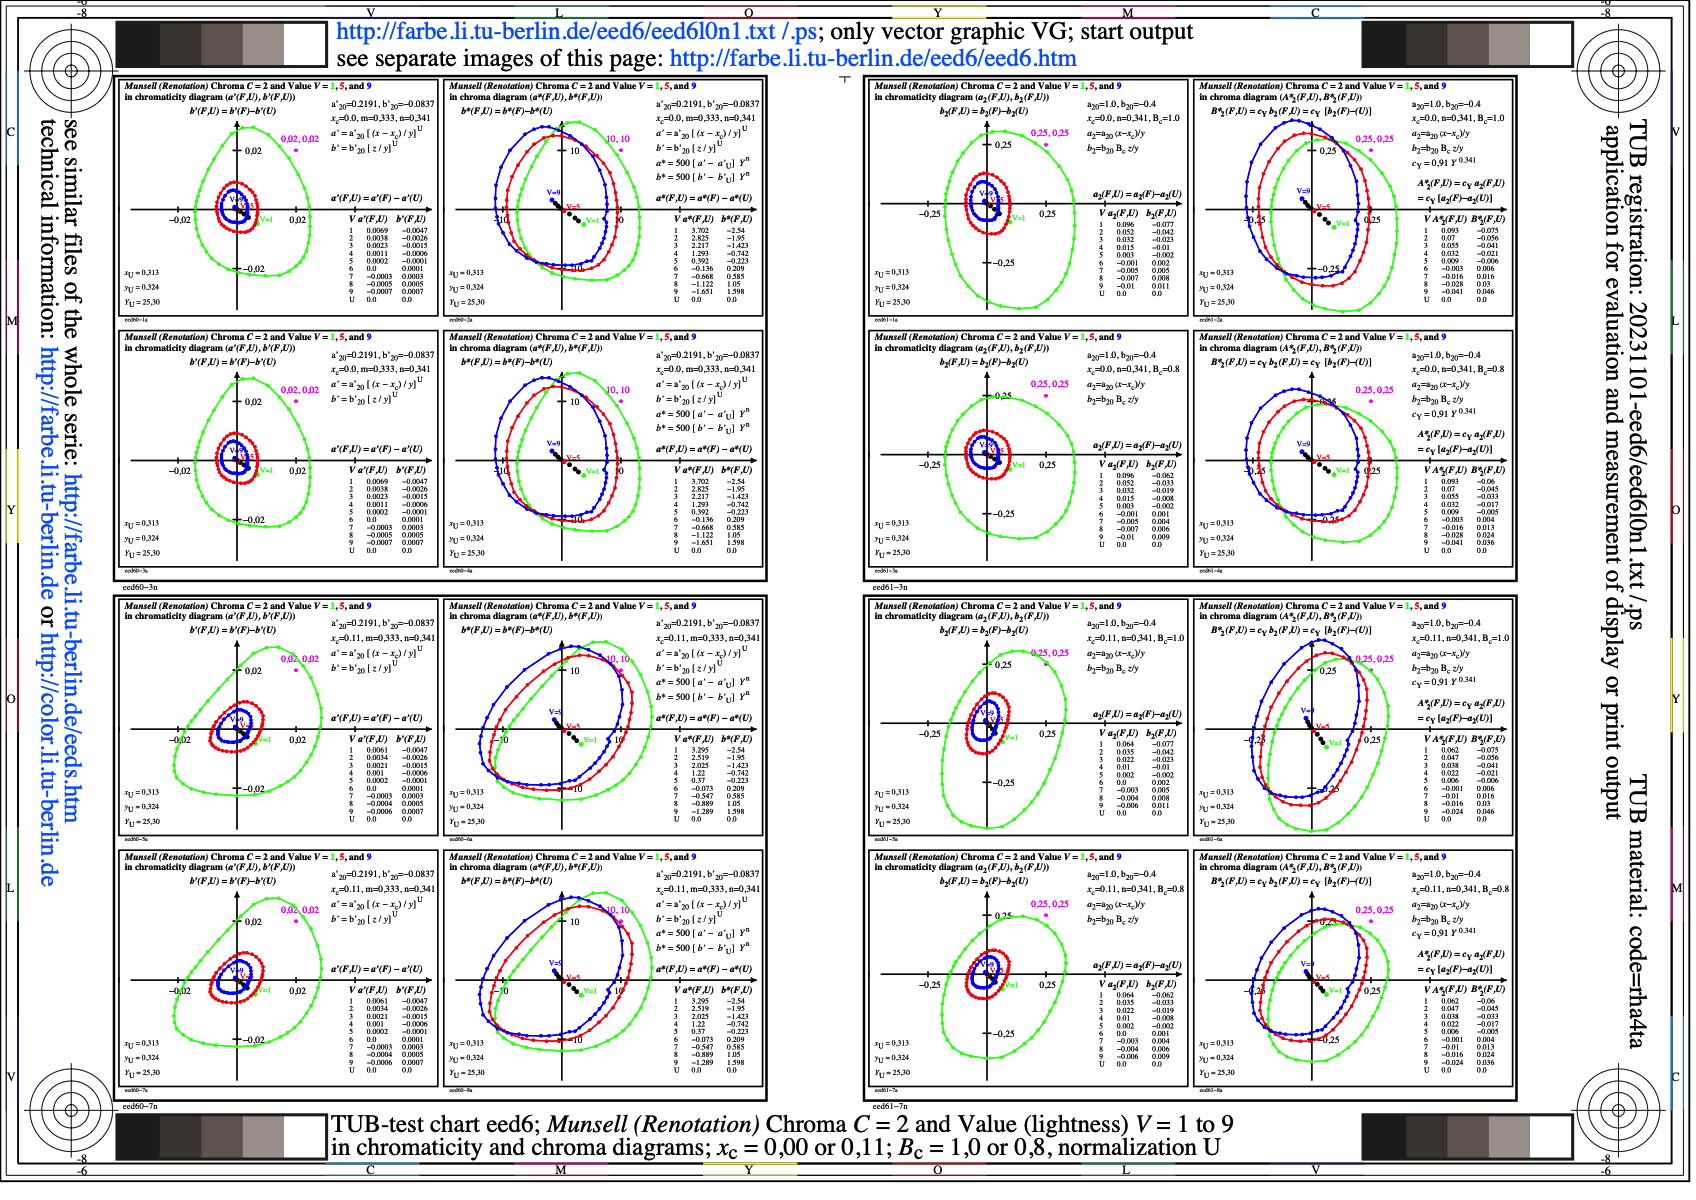
Image eed6l0n1.jpg: Output in format A6 of the file
eed6l0np.pdf, see
eed6l0n1.
PS /
TXT /
PDF /
jpg
eed6: TUB-test chart eed6; Munsell Chroma 2 and Value 1, 5, 9
in CIELAB chromaticity and chroma diagram (a', b'), (a*, b*)
xc=0,00 or 0,11, Bc=1,0 or 0,8, normalization U
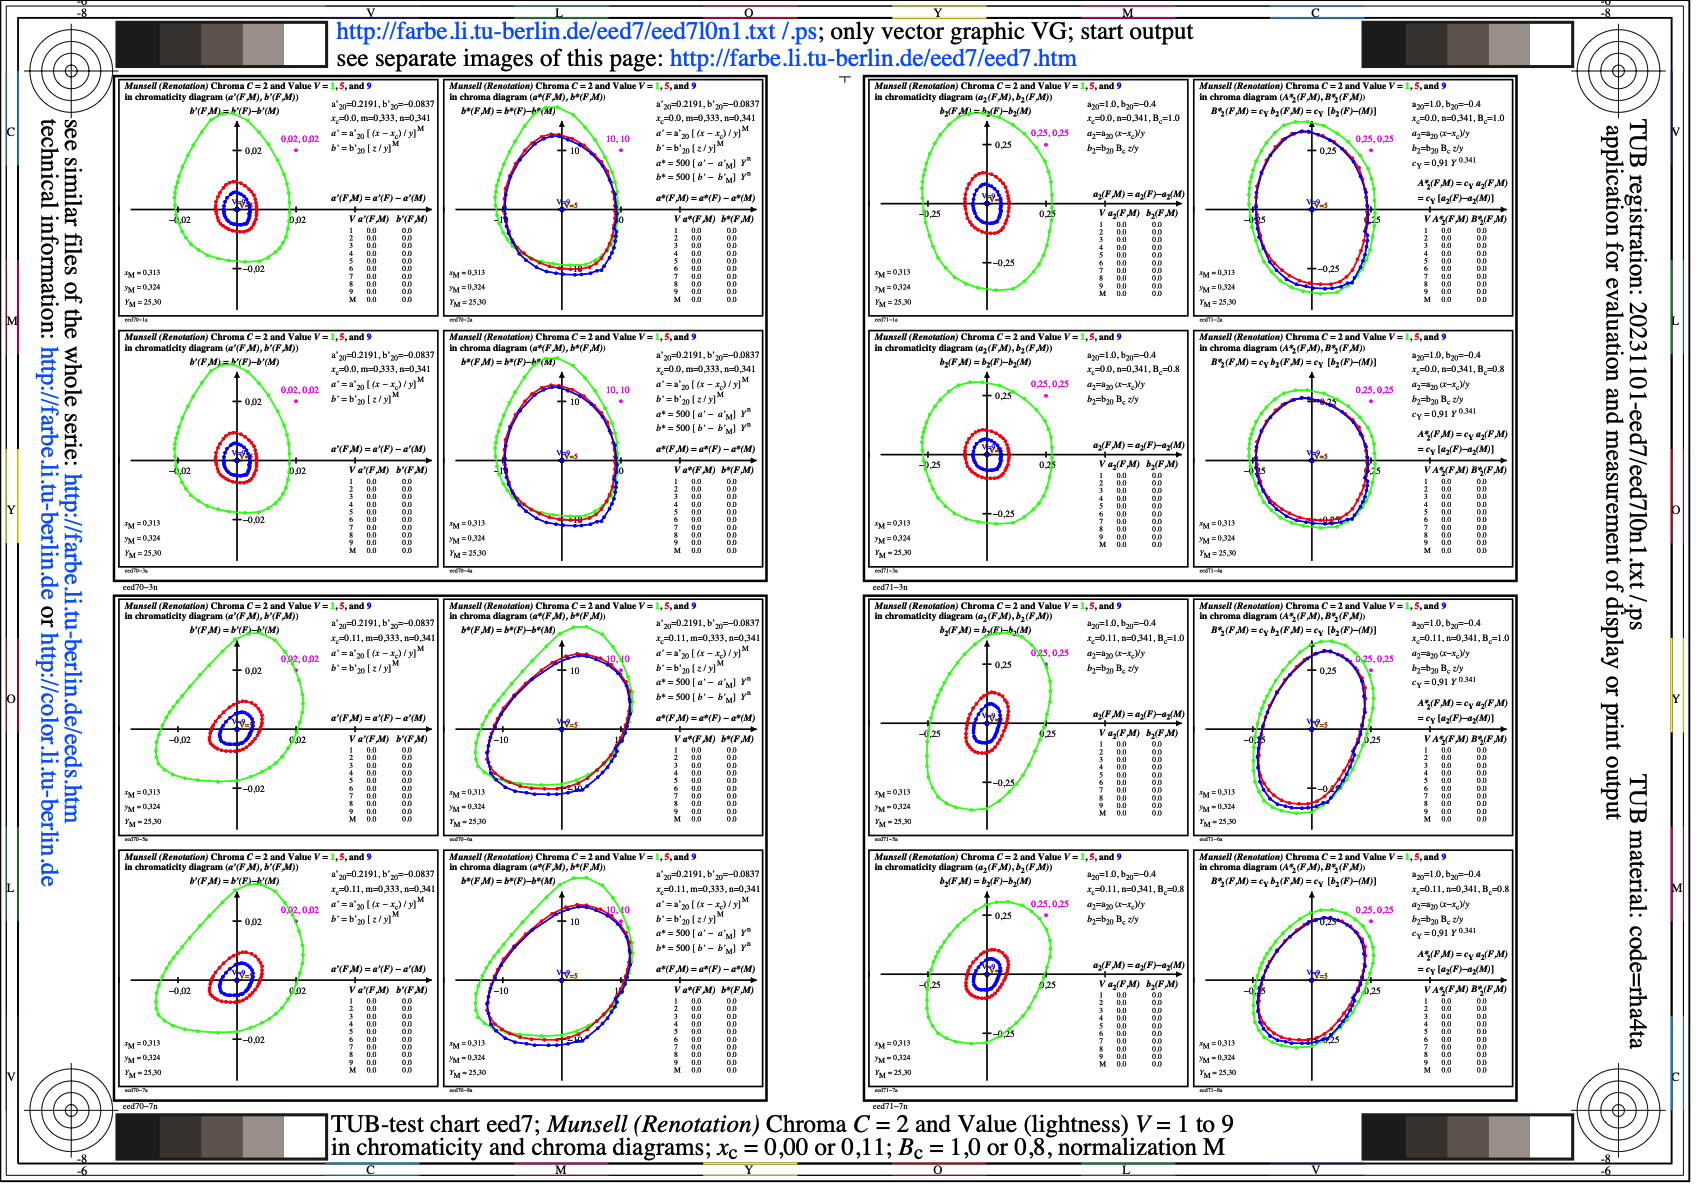
Image eed7l0n1.jpg: Output in format A6 of the file
eed7l0np.pdf, see
eed7l0n1.
PS /
TXT /
PDF /
jpg
eed7: TUB-test chart eed7; Munsell Chroma 2 and Value 1, 5, 9
in CIELAB chromaticity and chroma diagram (a', b'), (a*, b*)
xc=0,00 or 0,11, Bc=1,0 or 0,8, normalization M

Image eed8l0n1.jpg: Output in format A6 of the file
eed8l0np.pdf, see
eed8l0n1.
PS /
TXT /
PDF /
jpg
eed8: TUB-test chart eed8; Munsell Chroma 2 and Value 1, 5, 9
in CIELAB chromaticity and chroma diagram (p2, q2), (p2*, q2*)
xc=0,00 or 0,11, Bc=1,0 or 0,8, normalization U

Image eed9l0n1.jpg: Output in format A6 of the file
eed9l0np.pdf, see
eed9l0n1.
PS /
TXT /
PDF /
jpg
eed9: TUB-test chart eed9; Munsell Chroma 2 and Value 1, 5, 9
in CIELAB chromaticity and chroma diagram (p2, q2), (p2*, q2*)
xc=0,00 or 0,11, Bc=1,0 or 0,8, normalization M
Image eee0l0n1.jpg: Output in format A6 of the file
eee0l0np.pdf, see
eee0l0n1.
PS /
TXT /
PDF /
jpg
eee0: TUB-test chart eee0; Equally spaced 9 step grey scales
for four display reflections Yref=0,4, 90,0, 1,8, 3,6
L*N=22,3 or YN=1,8 and L*W=96 or YW=90, normalisation: white W
Image eee1l0n1.jpg: Output in format A6 of the file
eee1l0np.pdf, see
eee1l0n1.
PS /
TXT /
PDF /
jpg
eee1: TUB-test chart eee1; Equally spaced 9 step grey scales
for four display reflections Yref=0,4, 90, 1,8, 3,6
L*N=22,3 or YN=1,8 and L*W=96 or YW=90, normalisation: grey U

Image eee2l0n1.jpg: Output in format A6 of the file
eee2l0np.pdf, see
eee2l0n1.
PS /
TXT /
PDF /
jpg
eee2: TUB-test chart eee2; Relative lightness log[L*/L*u]
= f[log(Y)] of colour spaces CIELAB & TUBJND,
see ISO/CIE 11664-4 & CIE 230, many and less information
Image eee3l0n1.jpg: Output in format A6 of the file
eee3l0np.pdf, see
eee3l0n1.
PS /
TXT /
PDF /
jpg
eee3: TUB-test chart eee3; Relative lightness log[L*/L*u]
= f(Y) of colour spaces CIELAB & TUBJND,
see ISO/CIE 11664-4 & CIE 230, many and less information
Image eee4l0n1.jpg: Output in format A6 of the file
eee4l0np.pdf, see
eee4l0n1.
PS /
TXT /
PDF /
jpg
eee4: TUB-test chart eee4; CIE-Y difference log[delY/delYu]
= f[log(Y)] of colour spaces CIELAB & TUBJND,
see ISO/CIE 11664-4 & CIE 230, many and less information

Image eee5l0n1.jpg: Output in format A6 of the file
eee5l0np.pdf, see
eee5l0n1.
PS /
TXT /
PDF /
jpg
eee5: TUB-test chart eee5; CIE-Y difference log[delY/delYu]
= f(Y) of colour spaces CIELAB & TUBJND,
see ISO/CIE 11664-4 & CIE 230, many and less information
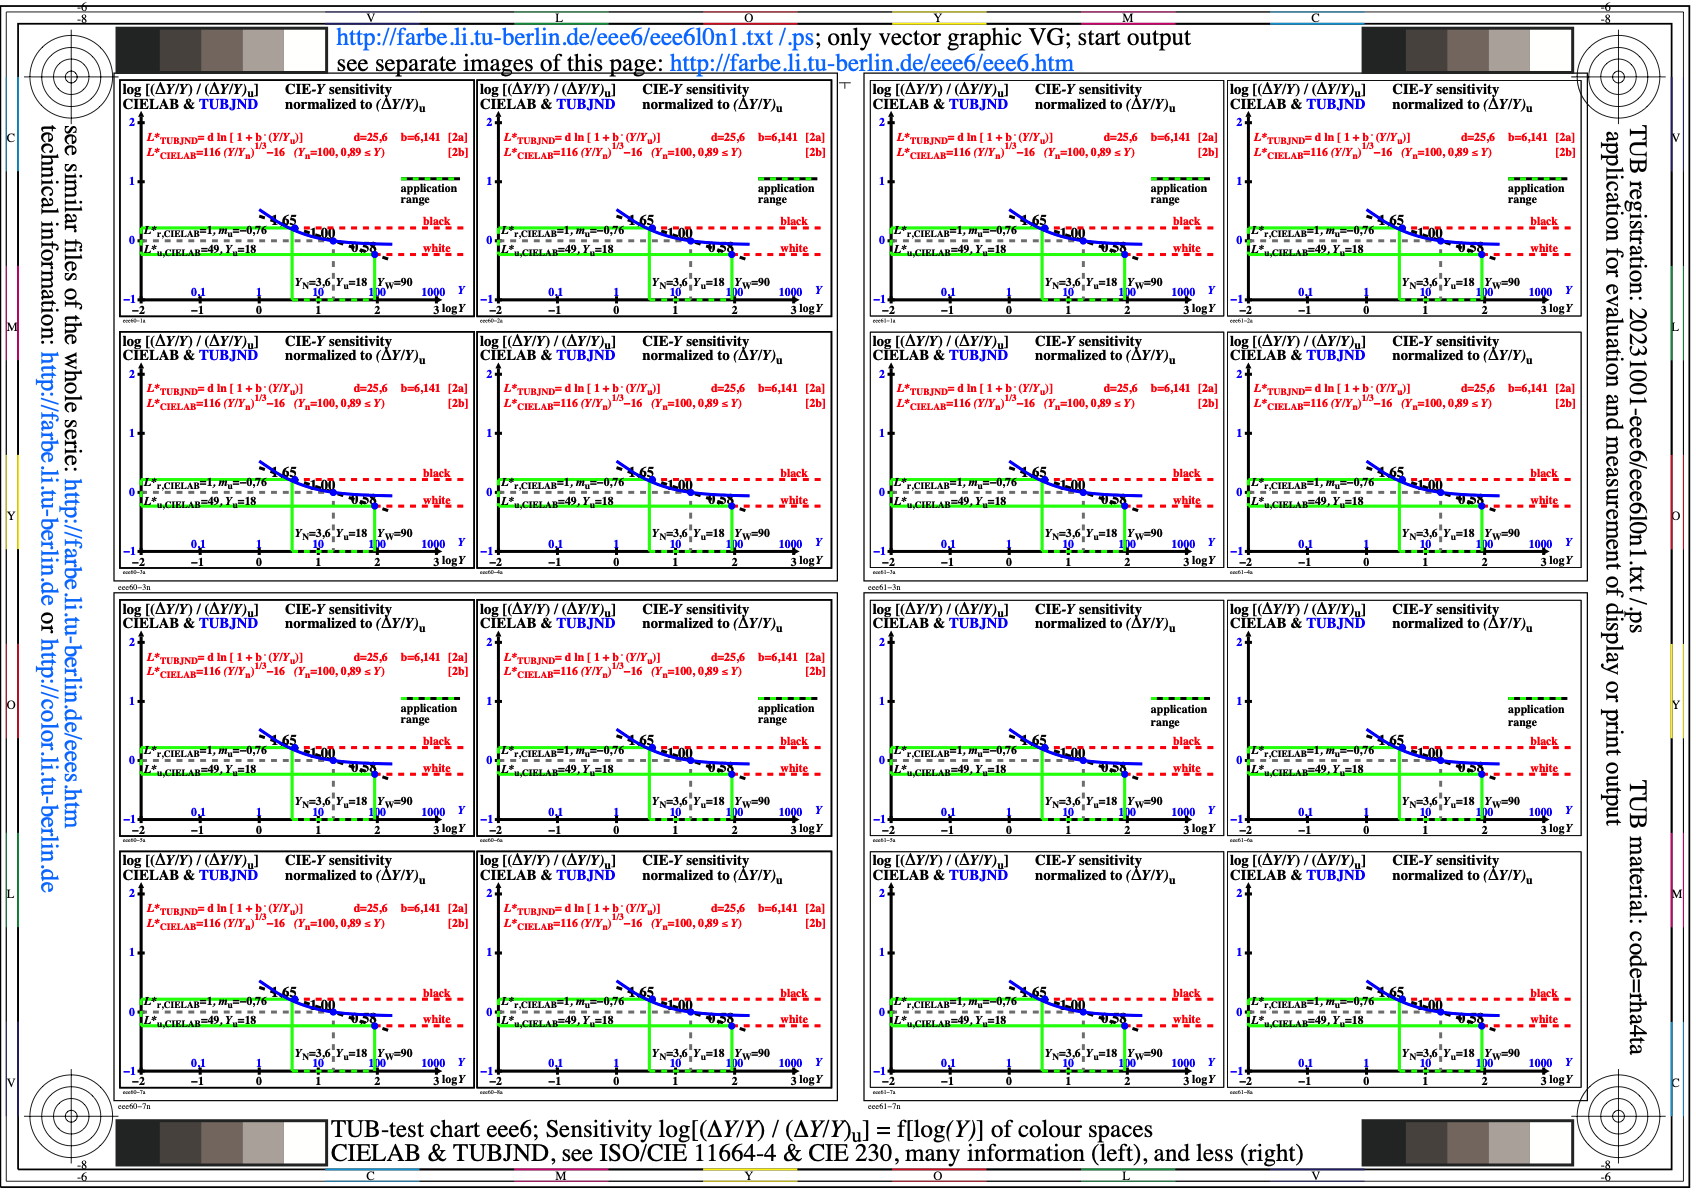
Image eee6l0n1.jpg: Output in format A6 of the file
eee6l0np.pdf, see
eee6l0n1.
PS /
TXT /
PDF /
jpg
eee6: TUB-test chart eee6; Sensitivity log[(delY/Y)/(delYu/Yu)]
= f[log(Y)] of colour spaces CIELAB & TUBJND,
see ISO/CIE 11664-4 & CIE 230, many and less information
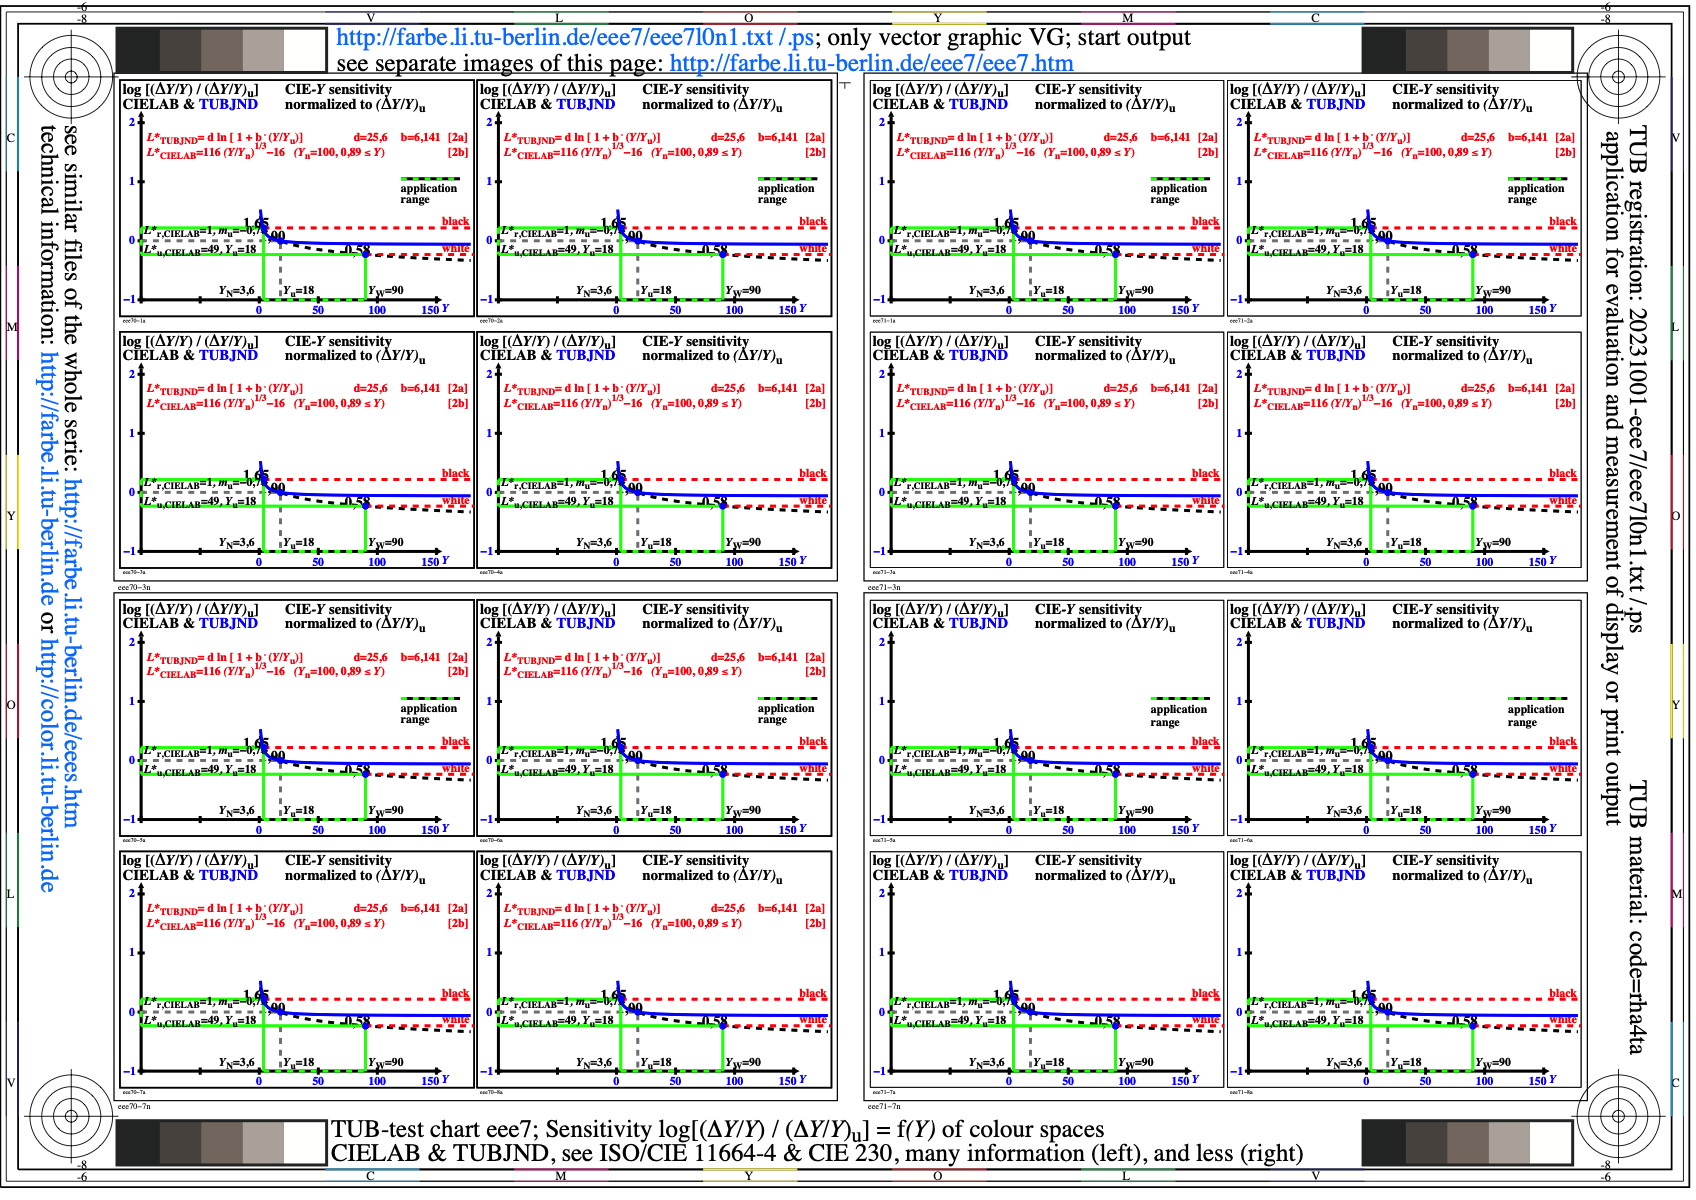
Image eee7l0n1.jpg: Output in format A6 of the file
eee7l0np.pdf, see
eee7l0n1.
PS /
TXT /
PDF /
jpg
eee7: TUB-test chart eee7; Sensitivity log[(delY/Y)/(delYu/Yu)]
= f(Y) of colour spaces CIELAB & TUBJND,
see ISO/CIE 11664-4 & CIE 230, many and less information
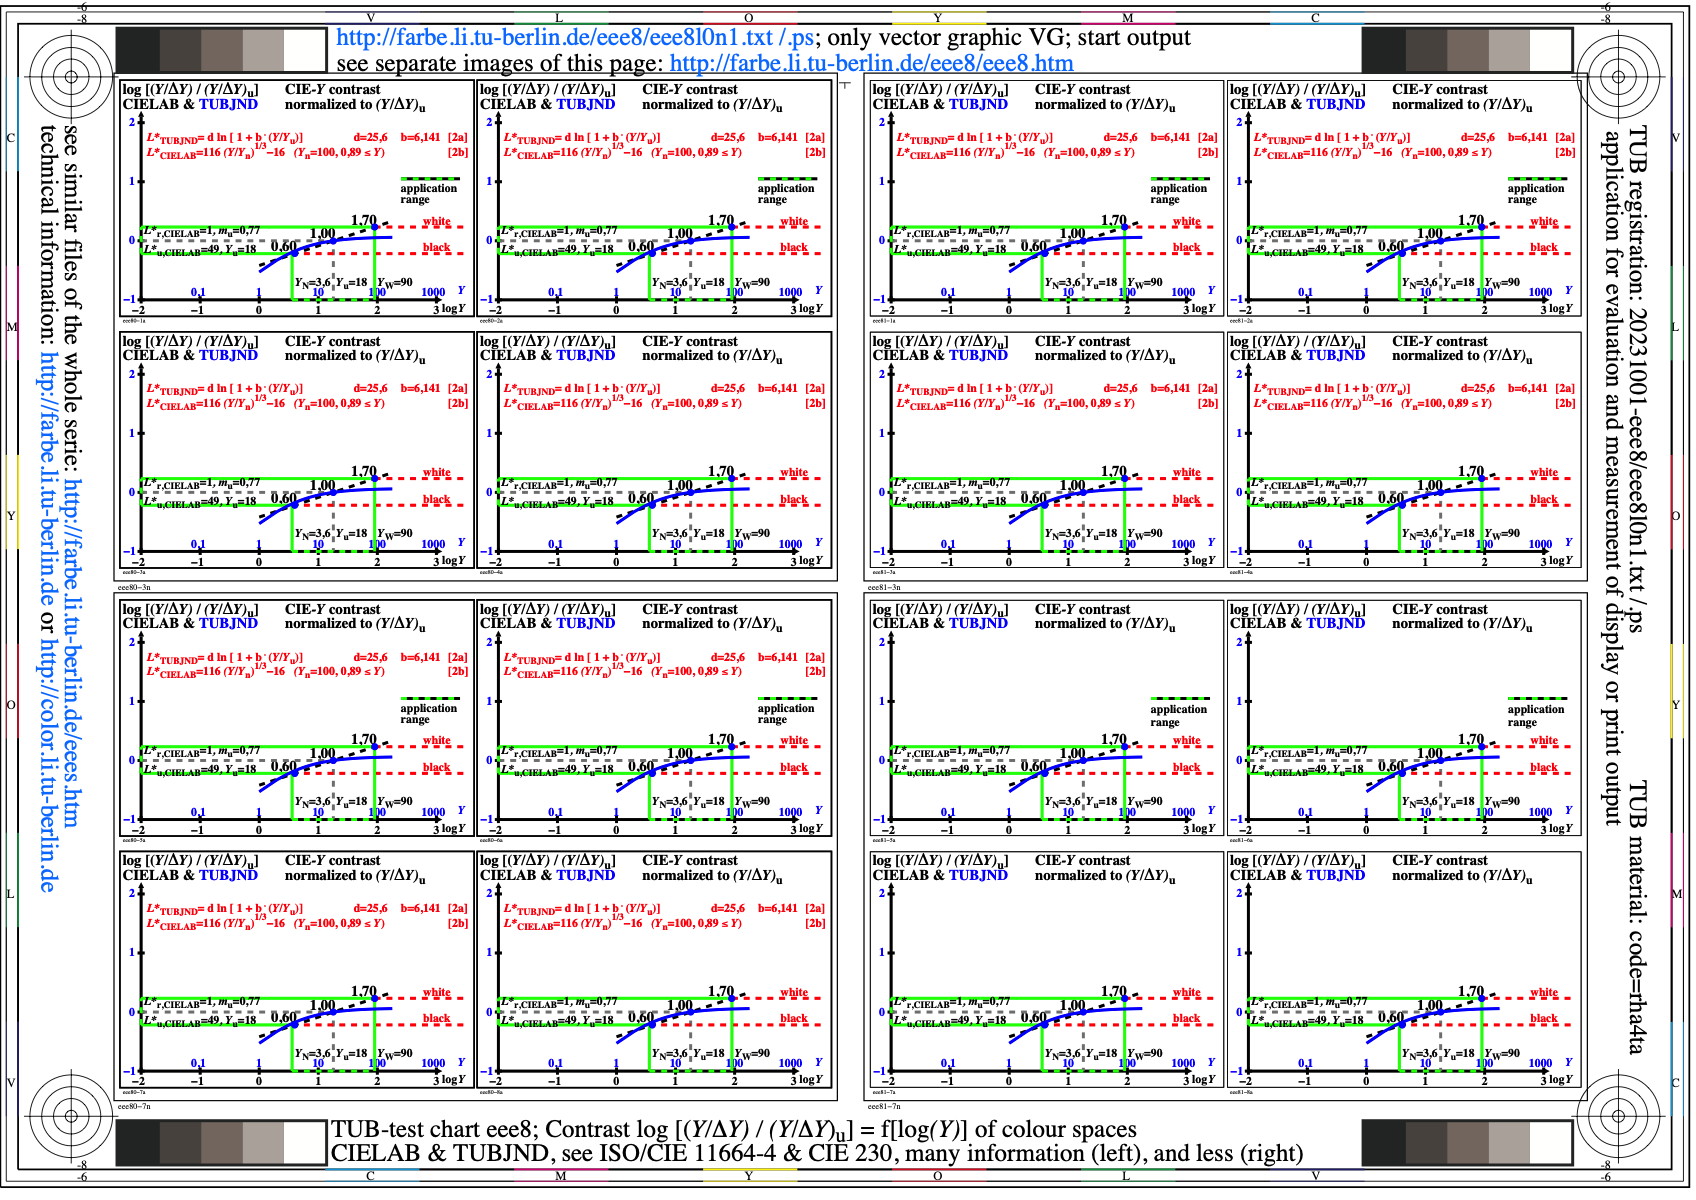
Image eee8l0n1.jpg: Output in format A6 of the file
eee8l0np.pdf, see
eee8l0n1.
PS /
TXT /
PDF /
jpg
eee8: TUB-test chart eee8; Contrast log[(Y/delY)/(Yu/delYu)]
= f[log(Y)] of colour spaces CIELAB & TUBJND,
see ISO/CIE 11664-4 & CIE 230, many and less information

Image eee9l0n1.jpg: Output in format A6 of the file
eee9l0np.pdf, see
eee9l0n1.
PS /
TXT /
PDF /
jpg
eee9: TUB-test chart eee9; Contrast log[(Y/delY)/(Yu/delYu)]
= f(Y) of colour spaces CIELAB & TUBJND,
see ISO/CIE 11664-4 & CIE 230, many and less information
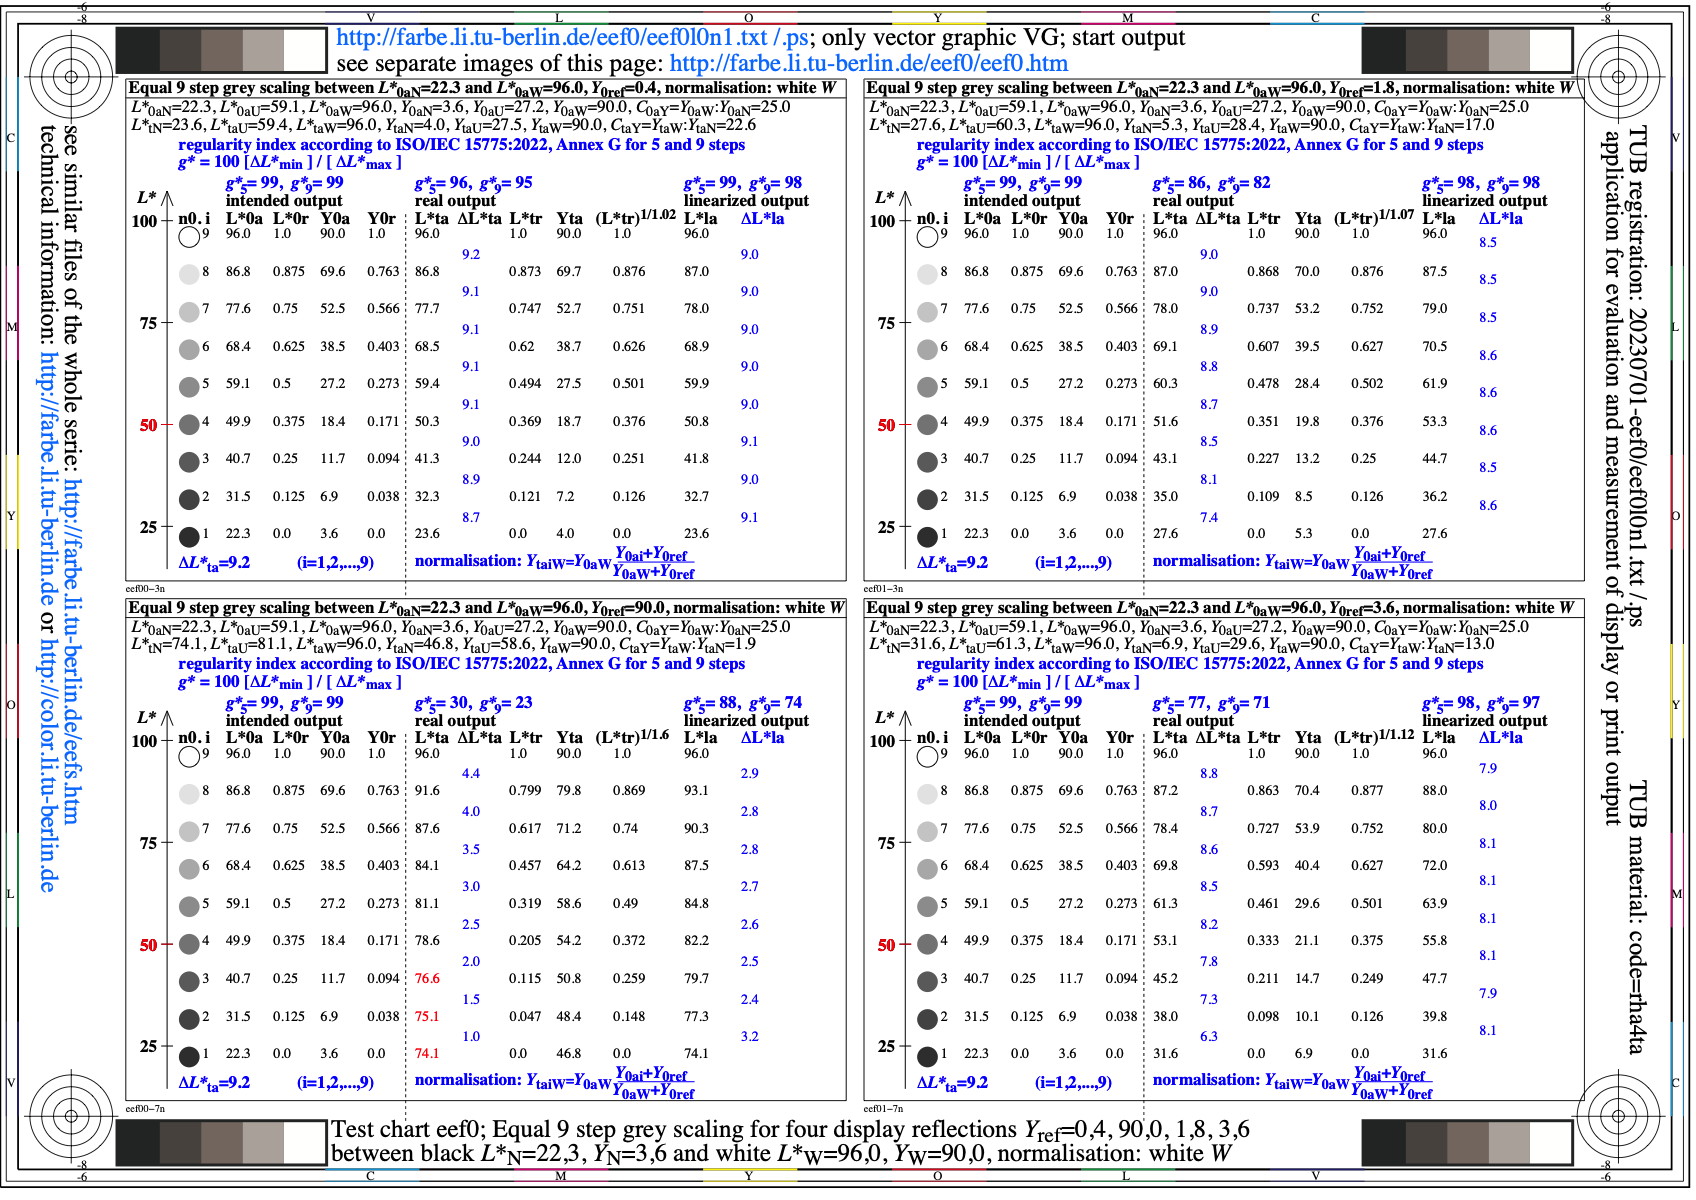
Image eef0l0n1.jpg: Output in format A6 of the file
eef0l0np.pdf, see
eef0l0n1.
PS /
TXT /
PDF /
jpg
eef0: TUB-test chart eef0; Equally spaced 9 step grey scales
for four display reflections Yref=0,4, 90,0, 1,8, 3,6
L*N=22,3 or YN=1,8 and L*W=96 or YW=90, normalisation: white W
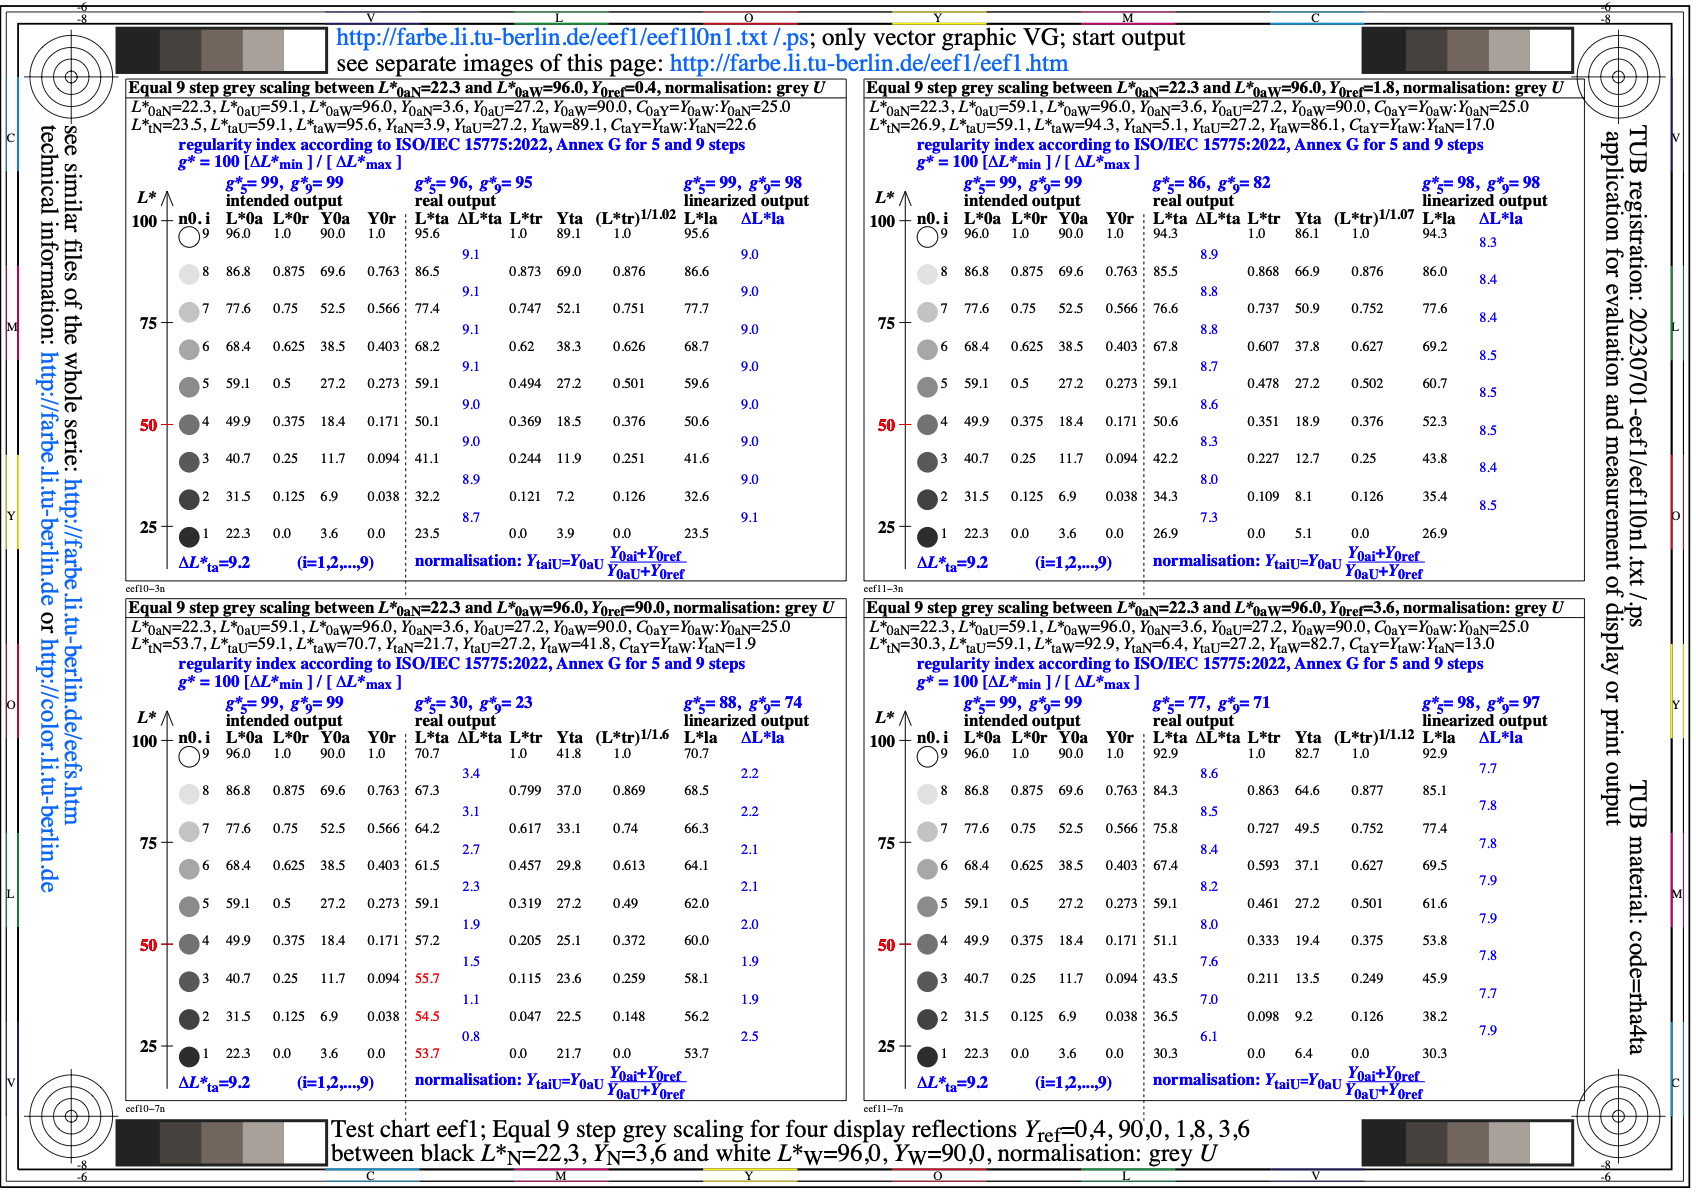
Image eef1l0n1.jpg: Output in format A6 of the file
eef1l0np.pdf, see
eef1l0n1.
PS /
TXT /
PDF /
jpg
eef1: TUB-test chart eef1; Equally spaced 9 step grey scales
for four display reflections Yref=0,4, 90, 1,8, 3,6
L*N=22,3 or YN=1,8 and L*W=96 or YW=90, normalisation: grey U
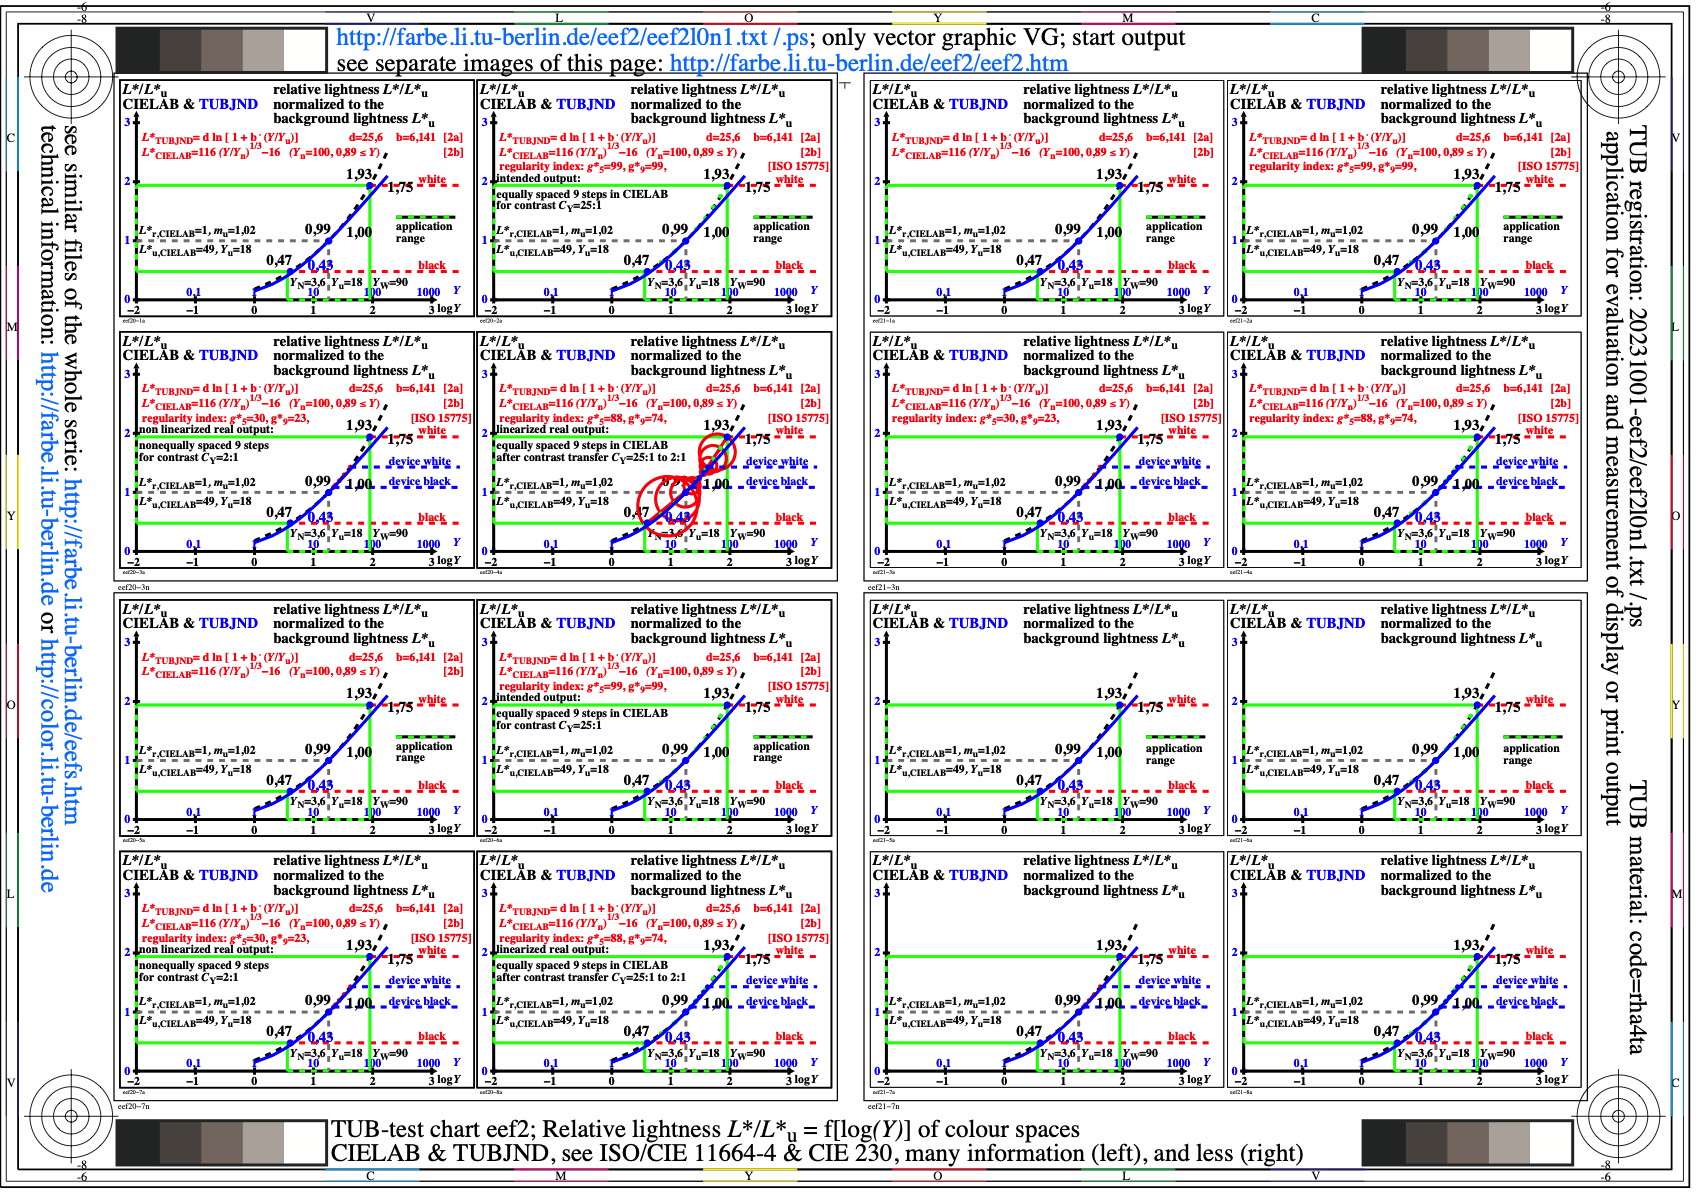
Image eef2l0n1.jpg: Output in format A6 of the file
eef2l0np.pdf, see
eef2l0n1.
PS /
TXT /
PDF /
jpg
eef2: TUB-test chart eef2; Relative lightness L*/L*u
= f[log(Y)] of colour spaces CIELAB & TUBJND,
see ISO/CIE 11664-4 & CIE 230, many and less information
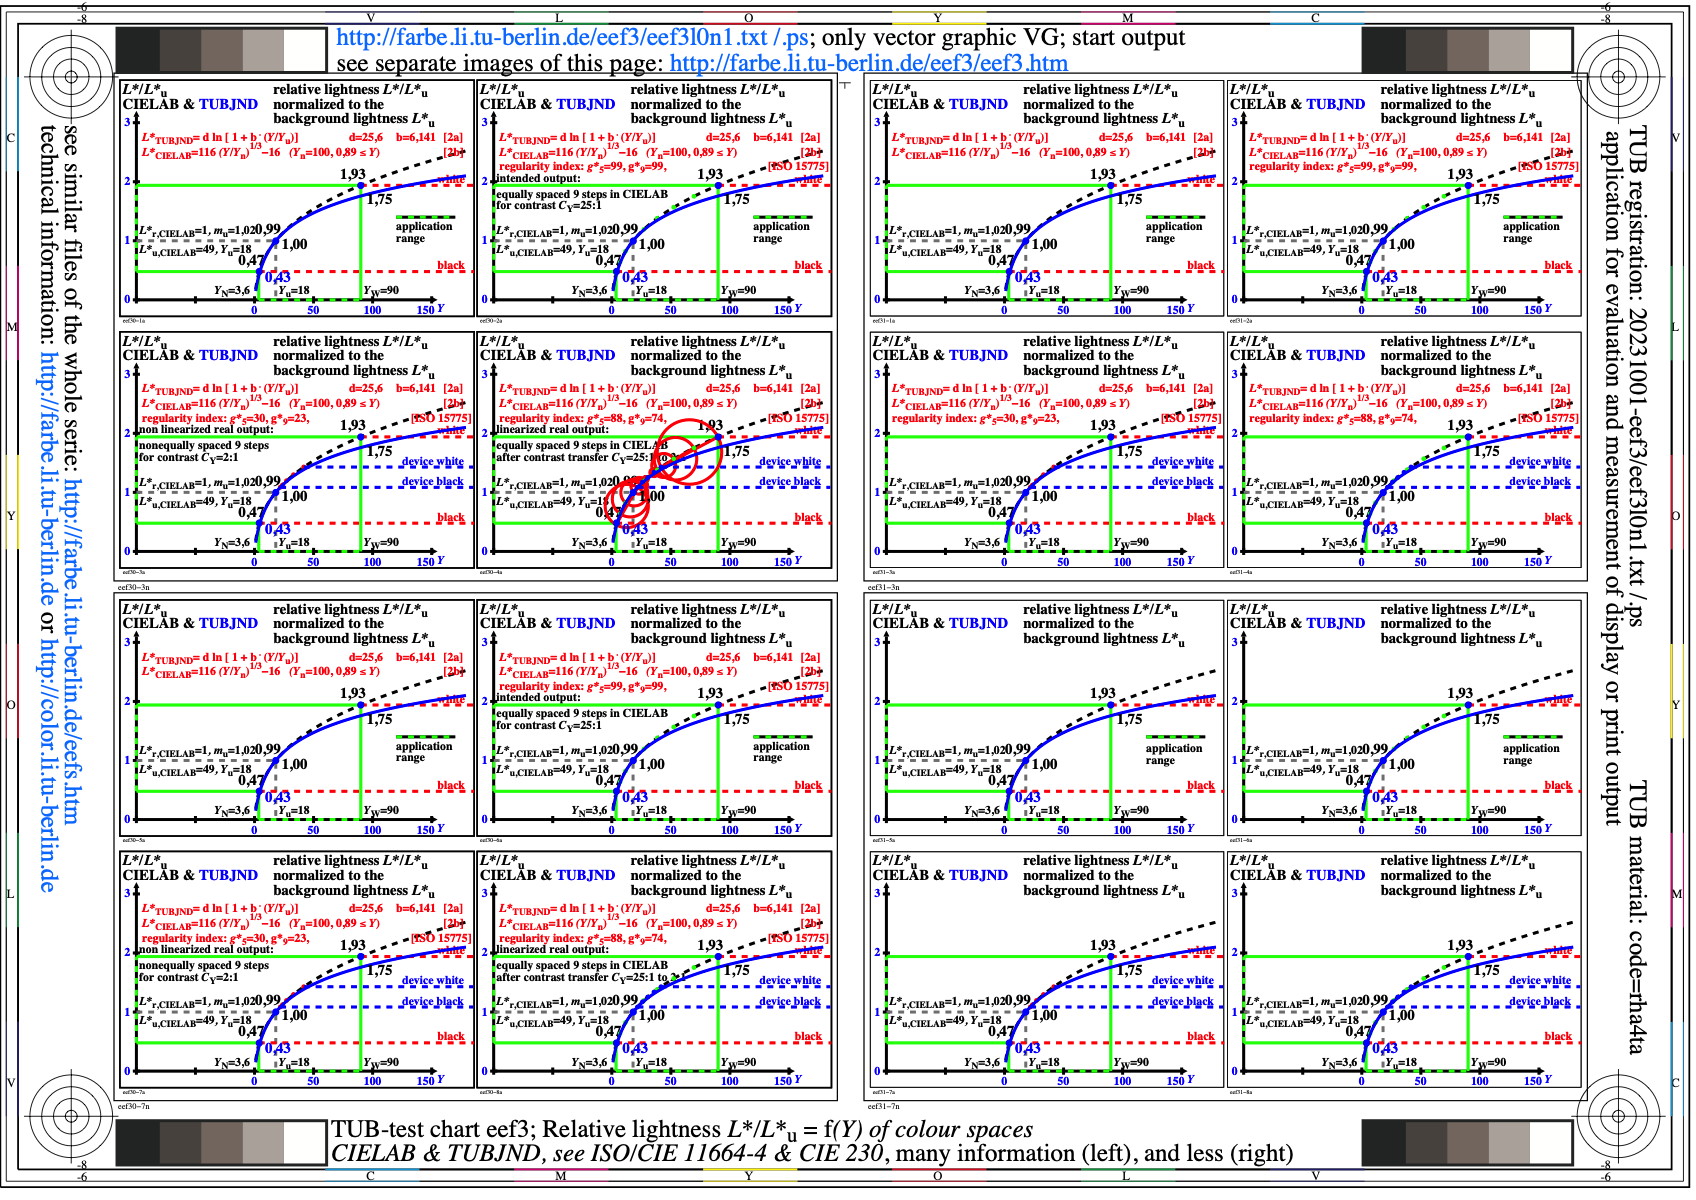
Image eef3l0n1.jpg: Output in format A6 of the file
eef3l0np.pdf, see
eef3l0n1.
PS /
TXT /
PDF /
jpg
eef3: TUB-test chart eef3; Relative lightness L*/L*u
= f(Y) of colour spaces CIELAB & TUBJND,
see ISO/CIE 11664-4 & CIE 230, many and less information
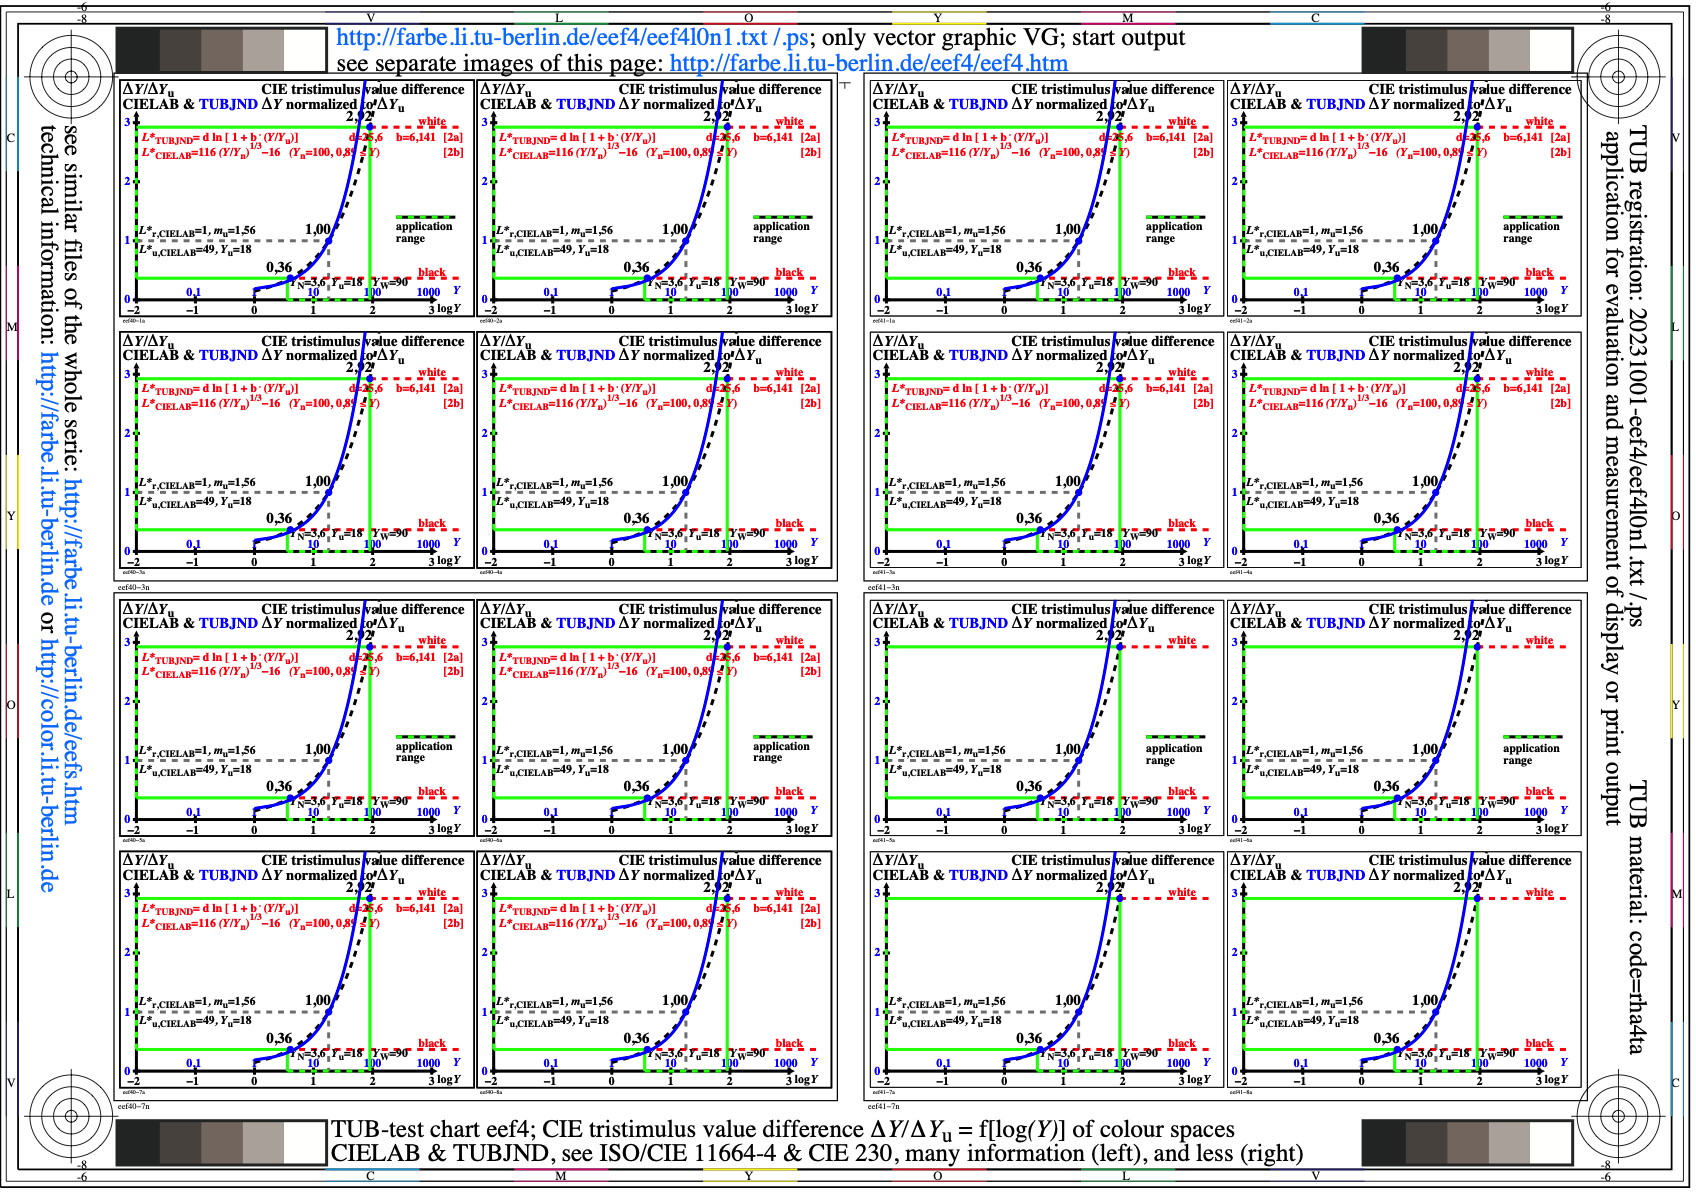
Image eef4l0n1.jpg: Output in format A6 of the file
eef4l0np.pdf, see
eef4l0n1.
PS /
TXT /
PDF /
jpg
eef4: TUB-test chart eef4; CIE-Y difference deltaY/deltaYu
= f[log(Y)] of colour spaces CIELAB & TUBJND,
see ISO/CIE 11664-4 & CIE 230, many and less information
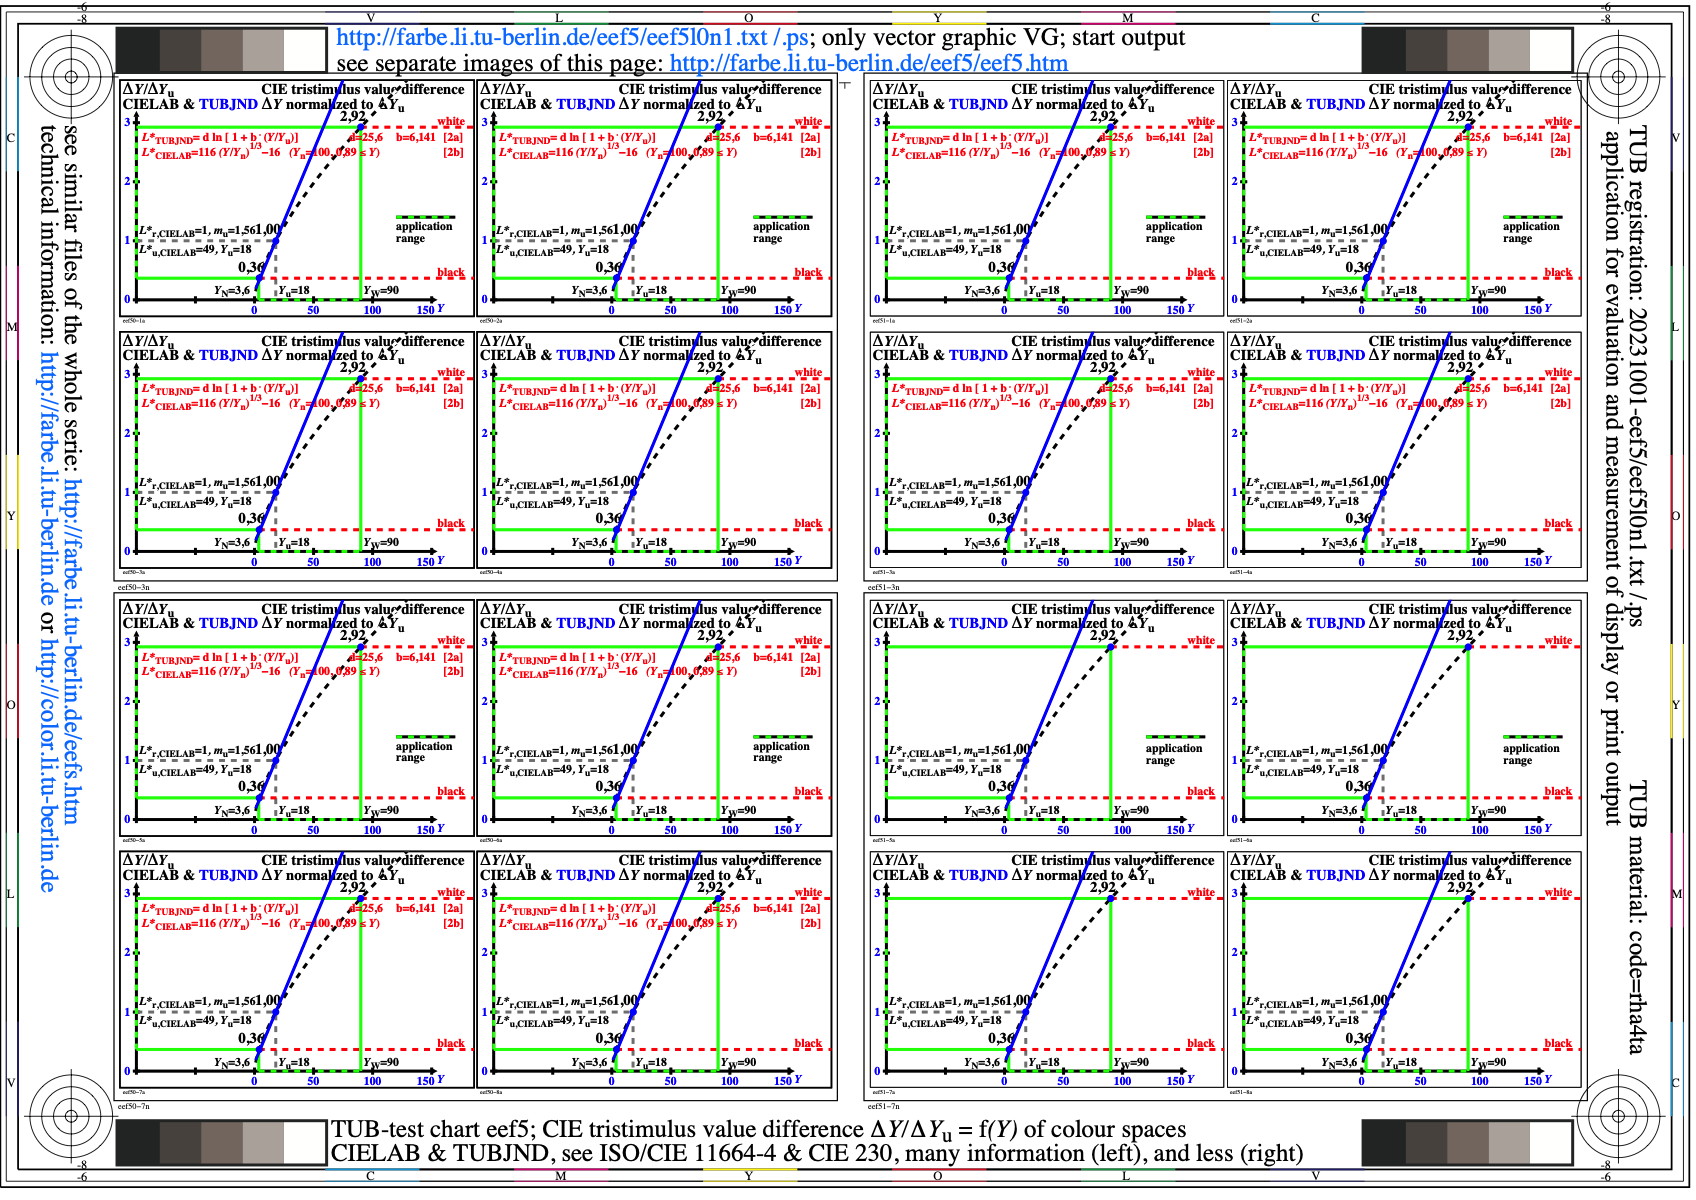
Image eef5l0n1.jpg: Output in format A6 of the file
eef5l0np.pdf, see
eef5l0n1.
PS /
TXT /
PDF /
jpg
eef5: TUB-test chart eef5; CIE-Y difference deltaY/deltaYu
= f(Y) of colour spaces CIELAB & TUBJND,
see ISO/CIE 11664-4 & CIE 230, many and less information

Image eef6l0n1.jpg: Output in format A6 of the file
eef6l0np.pdf, see
eef6l0n1.
PS /
TXT /
PDF /
jpg
eef6: TUB-test chart eef6; Sensitivity (deltaY/Y)/(deltaYu/Yu)
= f[log(Y)] of colour spaces CIELAB & TUBJND,
see ISO/CIE 11664-4 & CIE 230, many and less information
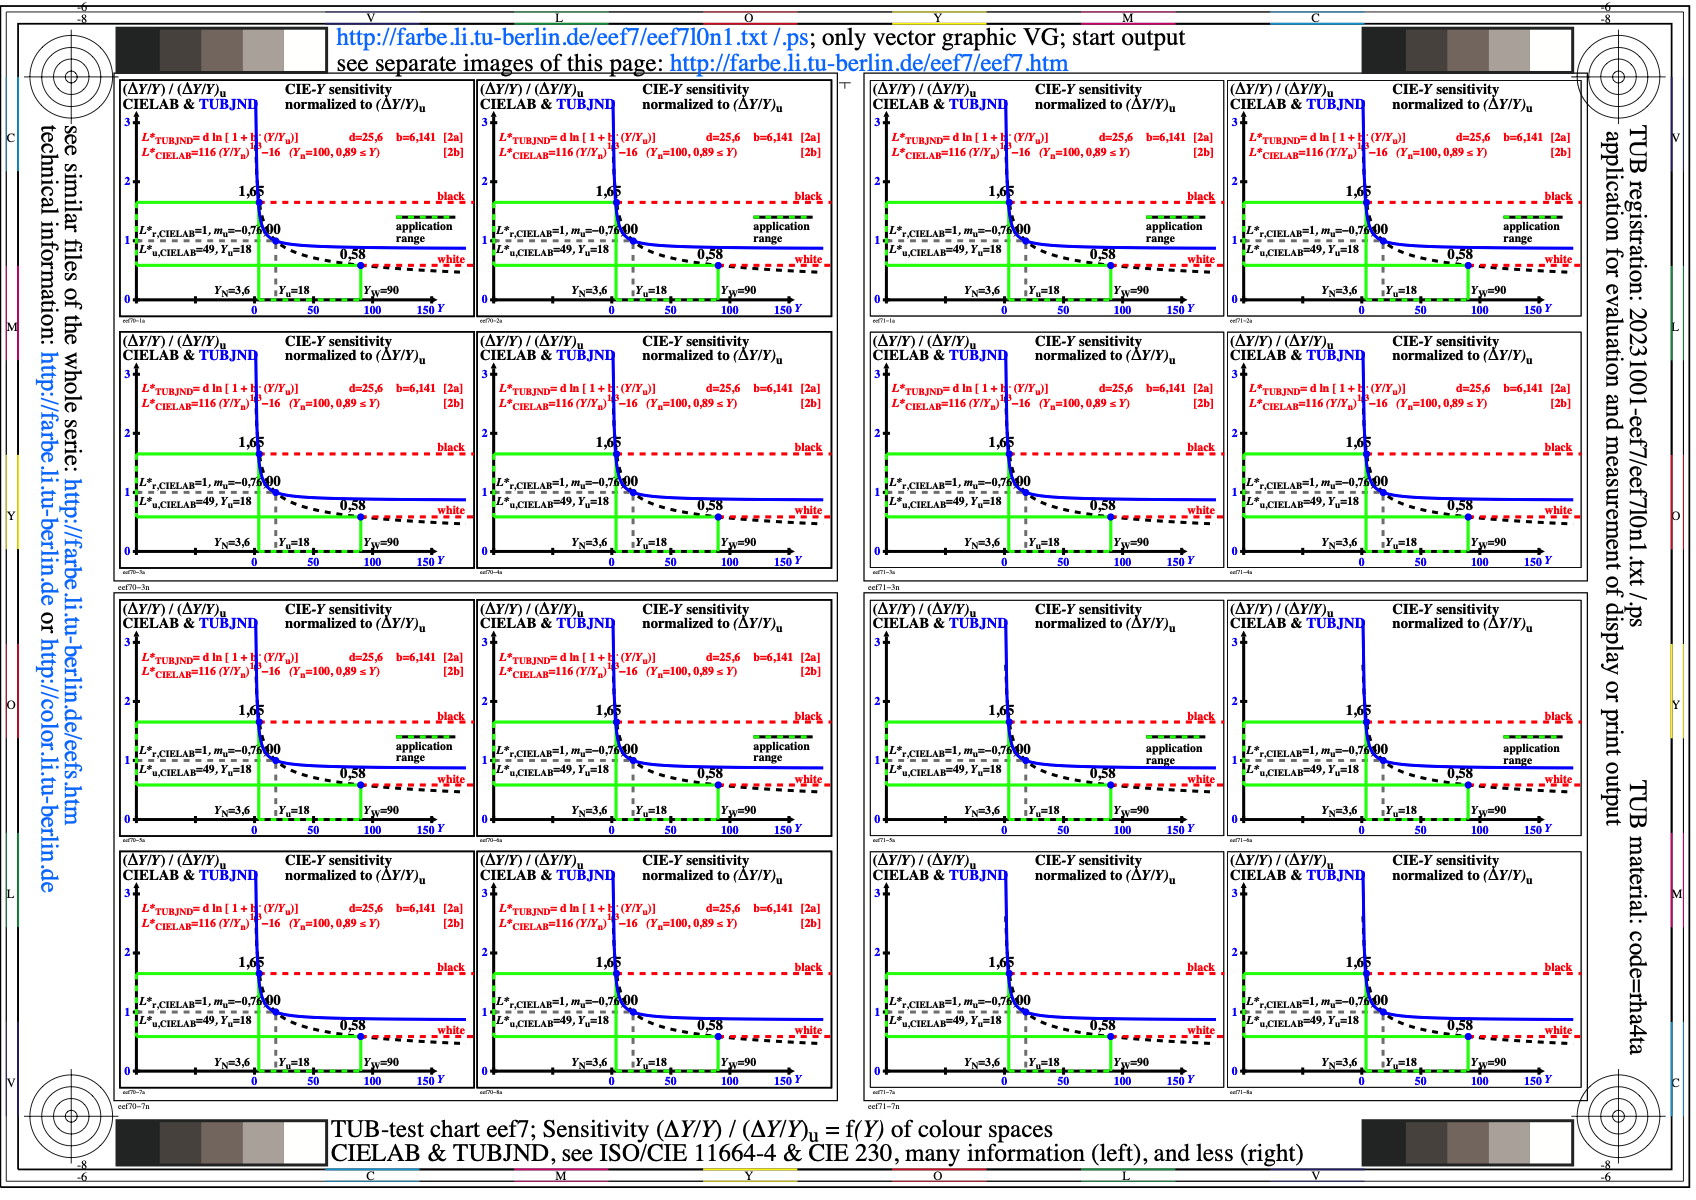
Image eef7l0n1.jpg: Output in format A6 of the file
eef7l0np.pdf, see
eef7l0n1.
PS /
TXT /
PDF /
jpg
eef7: TUB-test chart eef7; Sensitivity (deltaY/Y)/(deltaYu/Yu)
= f(Y) of colour spaces CIELAB & TUBJND,
see ISO/CIE 11664-4 & CIE 230, many and less information
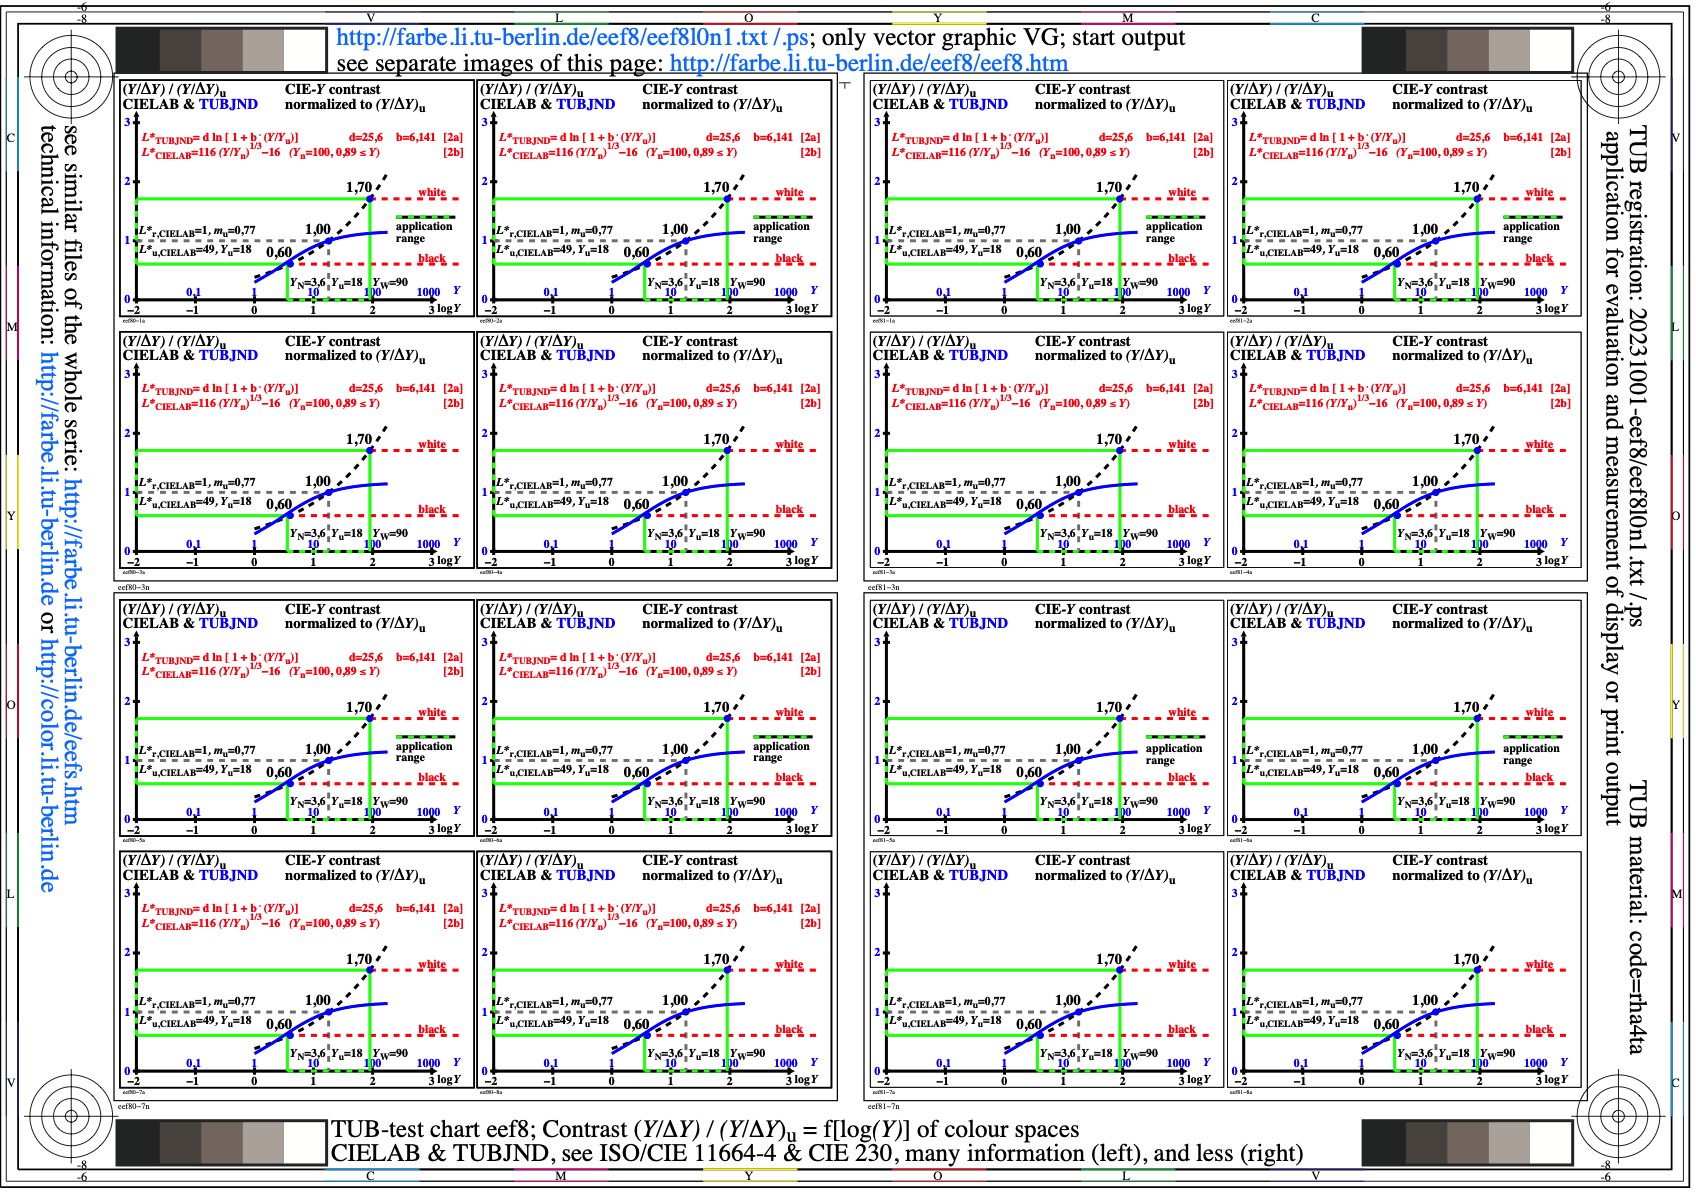
Image eef8l0n1.jpg: Output in format A6 of the file
eef8l0np.pdf, see
eef8l0n1.
PS /
TXT /
PDF /
jpg
eef8: TUB-test chart eef8; Contrast (Y/deltaY)/(Yu/deltaYu)
= f[log(Y)] of colour spaces CIELAB & TUBJND,
see ISO/CIE 11664-4 & CIE 230, many and less information
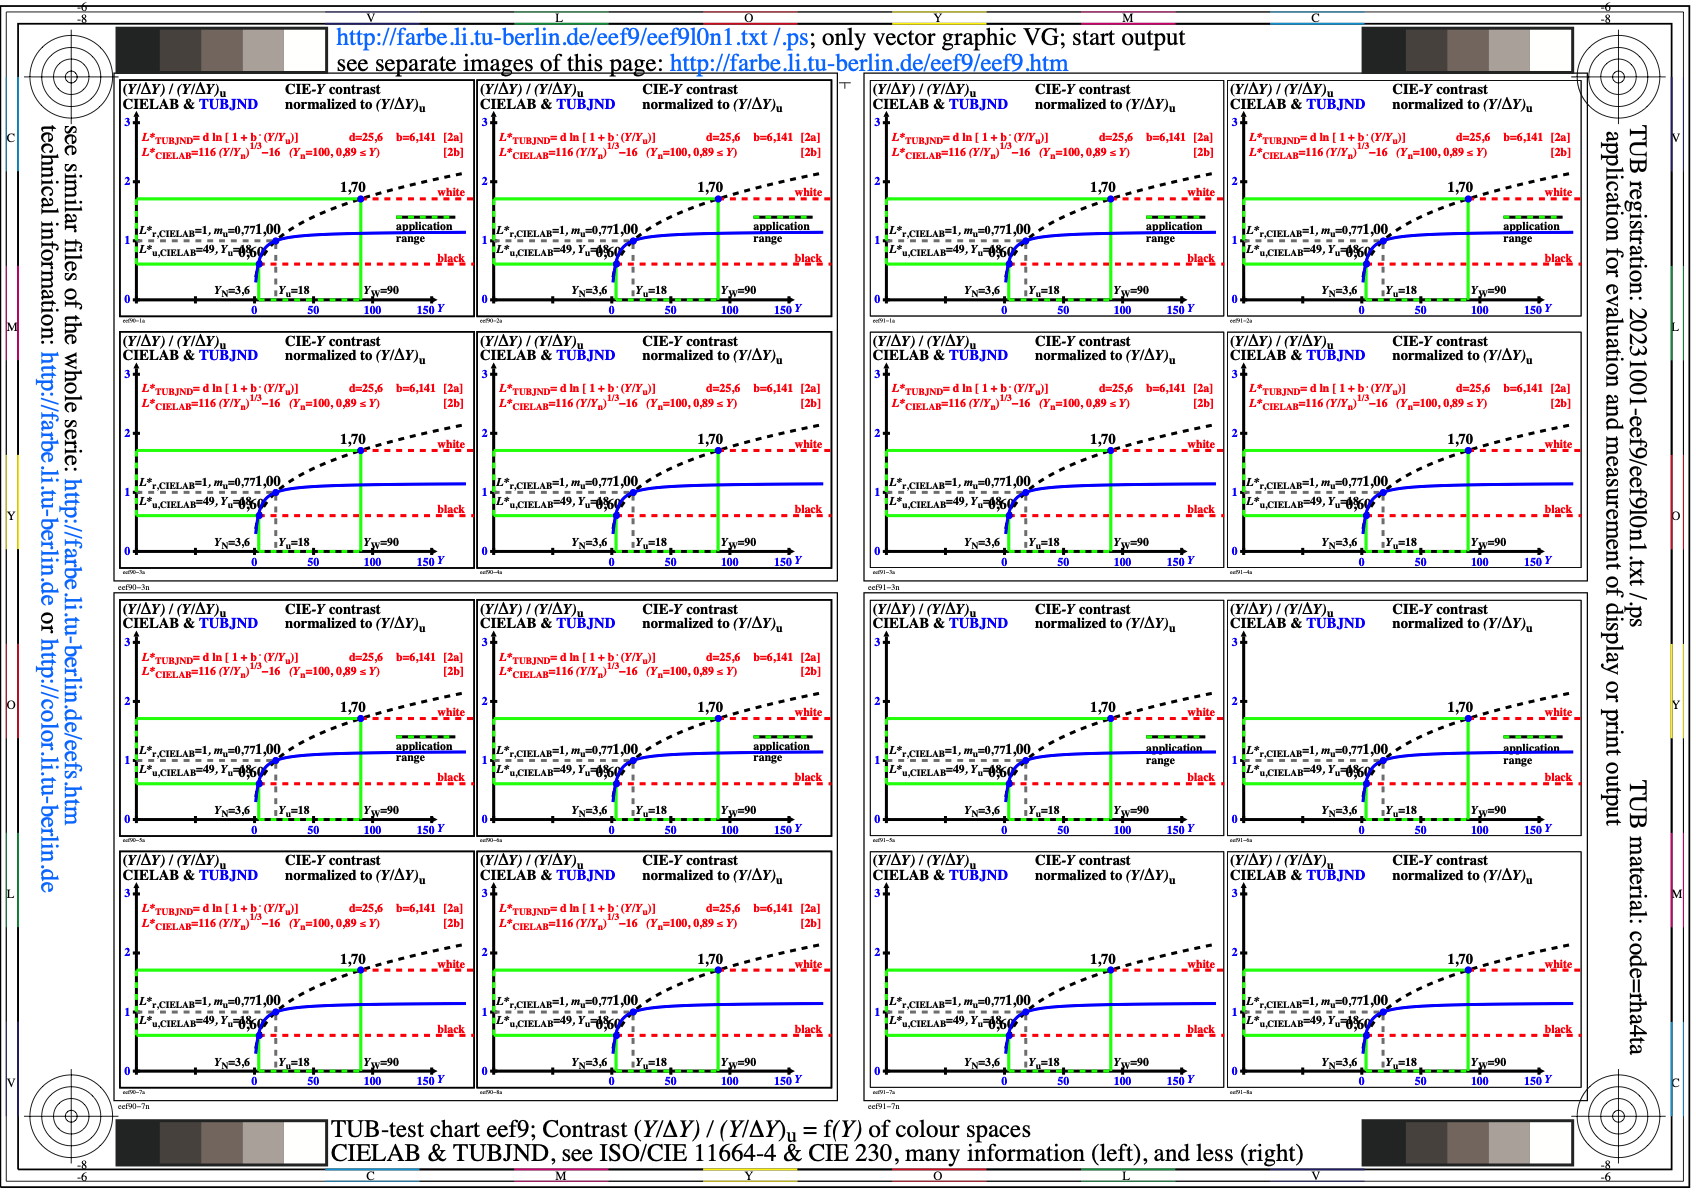
Image eef9l0n1.jpg: Output in format A6 of the file
eef9l0np.pdf, see
eef9l0n1.
PS /
TXT /
PDF /
jpg
eef9: TUB-test chart eef9; Contrast (Y/deltaY)/(Yu/deltaYu)
= f(Y) of colour spaces CIELAB & TUBJND,
see ISO/CIE 11664-4 & CIE 230, many and less information
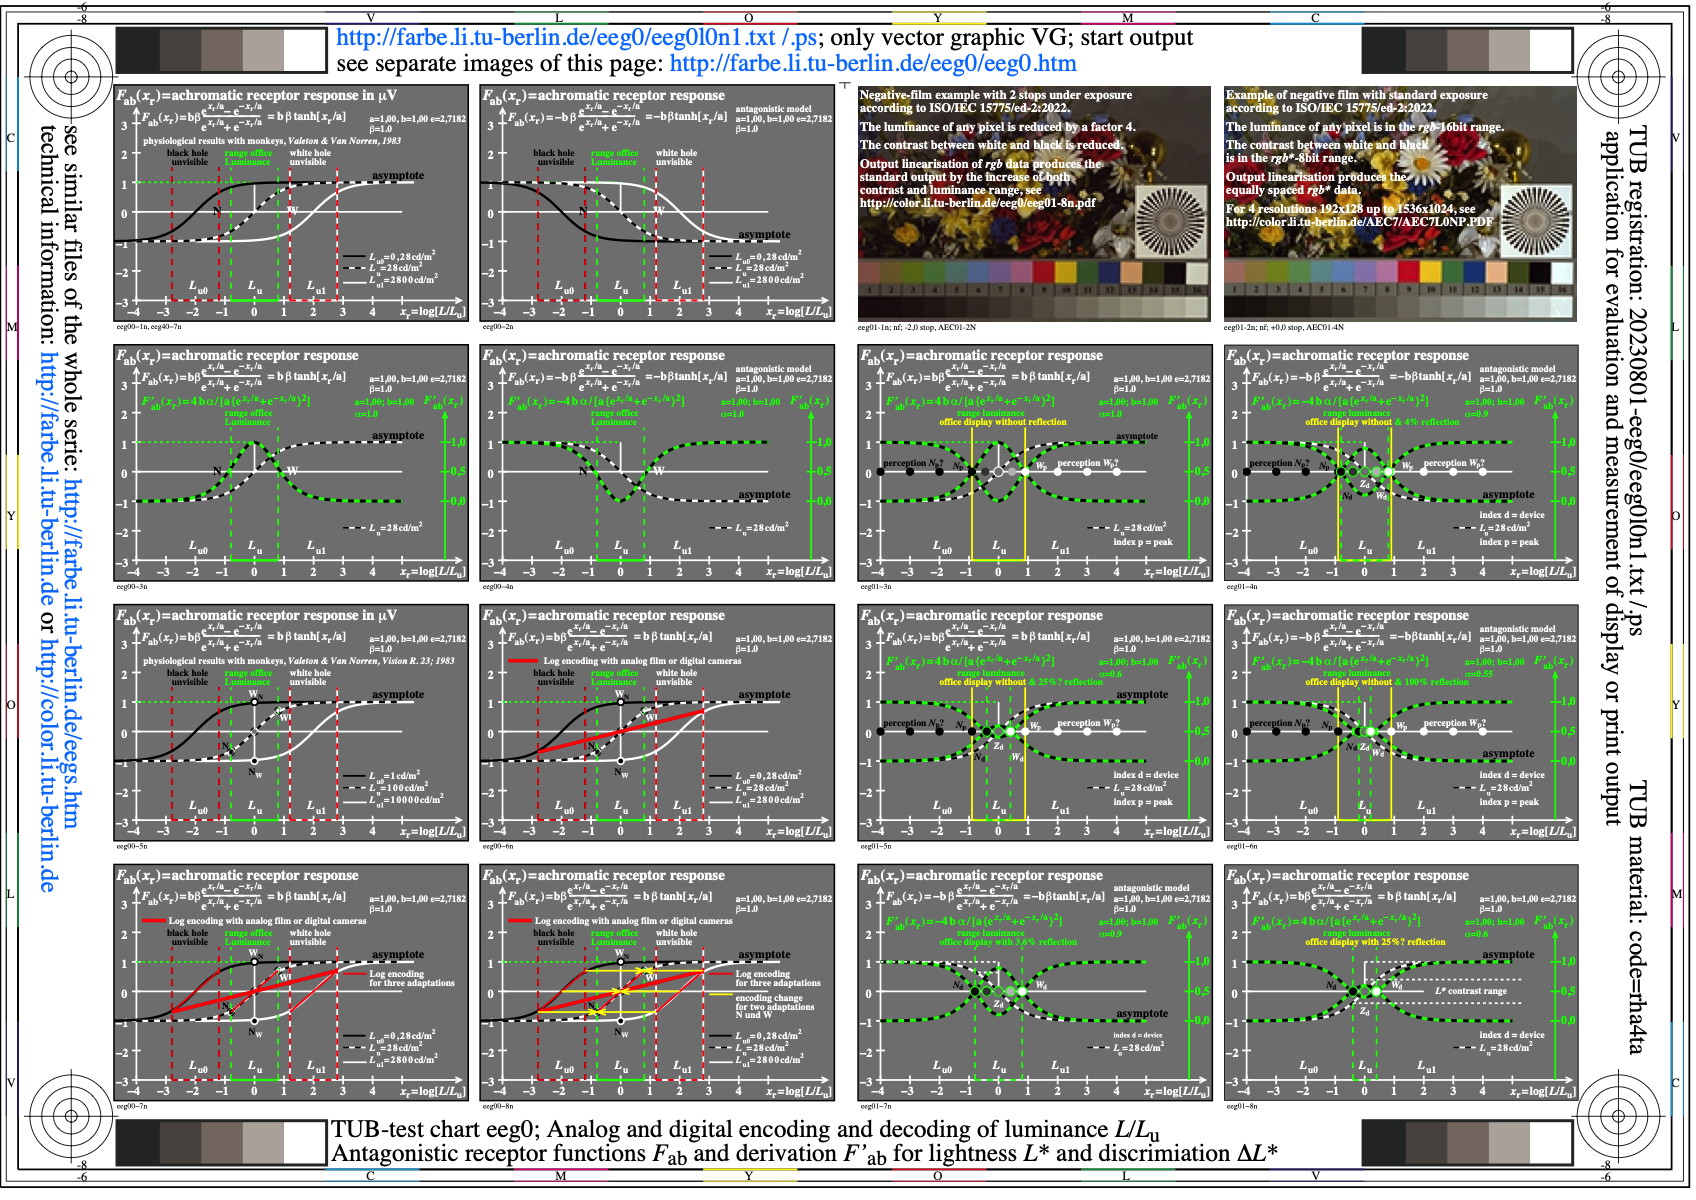
Image eeg0l0n1.jpg: Output in format A6 of the file
eeg0l0np.pdf, see
eeg0l0n1.
PS /
TXT /
PDF /
jpg
eeg0: TUB-test chart eeg0; Ostwald optimal colours for D65
Calculation of tristimulus values Yu for equal greyness
as function of CIE chromaticity (x,y), alpha variable
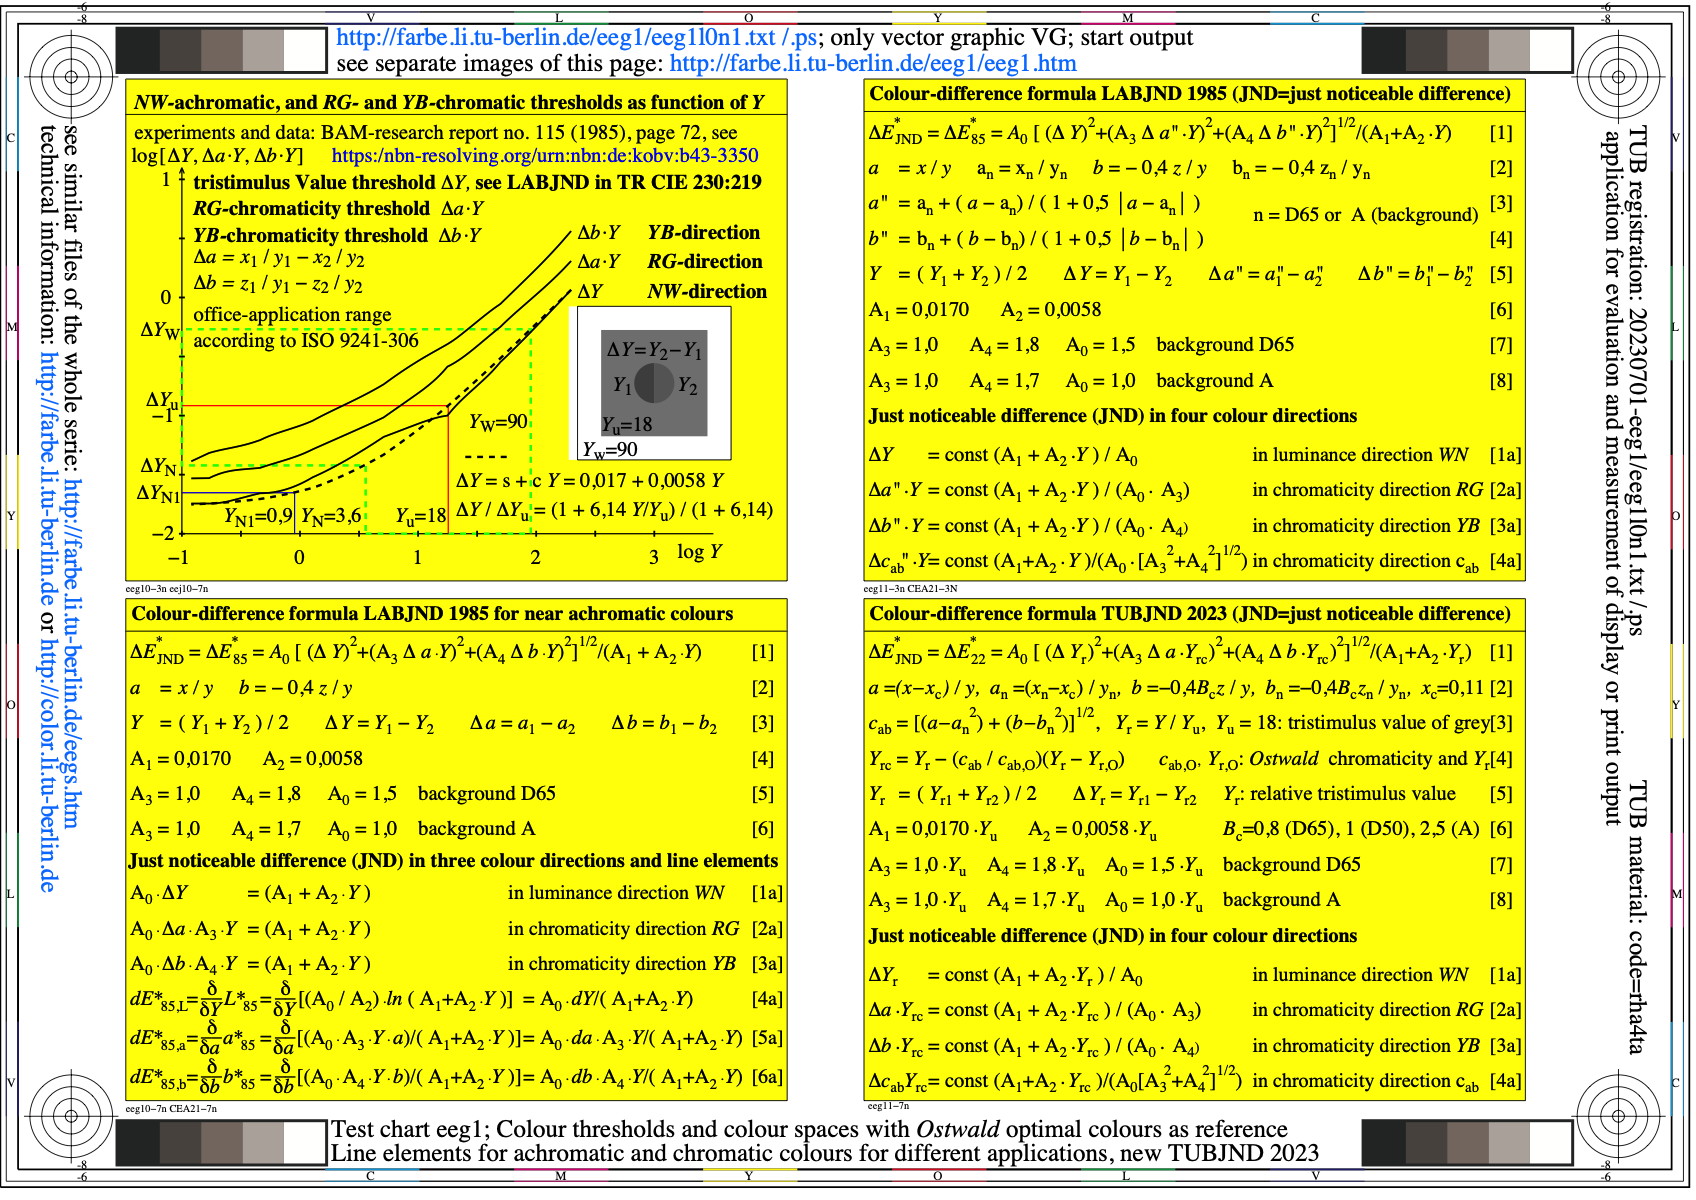
Image eeg1l0n1.jpg: Output in format A6 of the file
eeg1l0np.pdf, see
eeg1l0n1.
PS /
TXT /
PDF /
jpg
eeg1: TUB-test chart eeg1; Colour thresholds and colour spaces
Ostwald optimal colours as surface colour reference
Colour line elements including the colour space TUBJND 2023
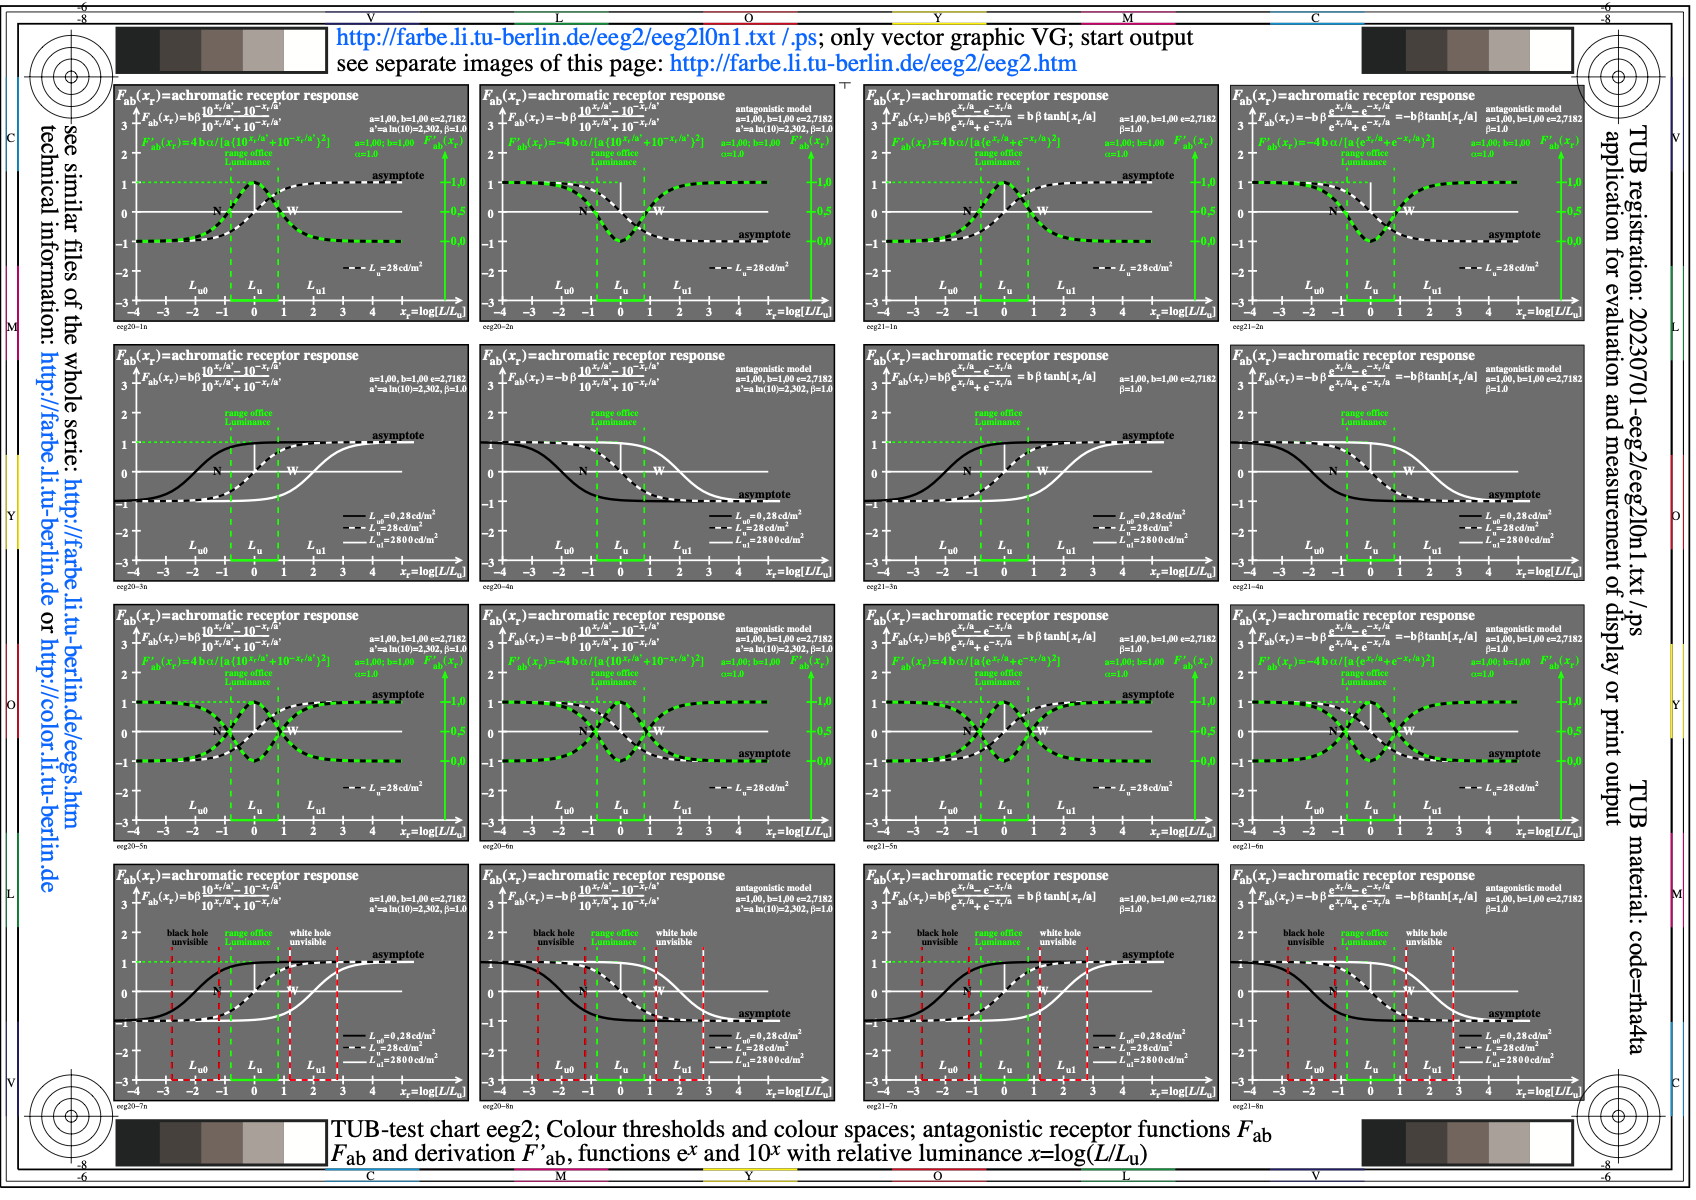
Image eeg2l0n1.jpg: Output in format A6 of the file
eeg2l0np.pdf, see
eeg2l0n1.
PS /
TXT /
PDF /
jpg
eeg2: TUB-test chart eeg2; Antagonistic receptor functions Fab
Exponential receptor functions e^x with x=log(L/Lu)
Derivation F'ab of antagonistic receptor functions Fab
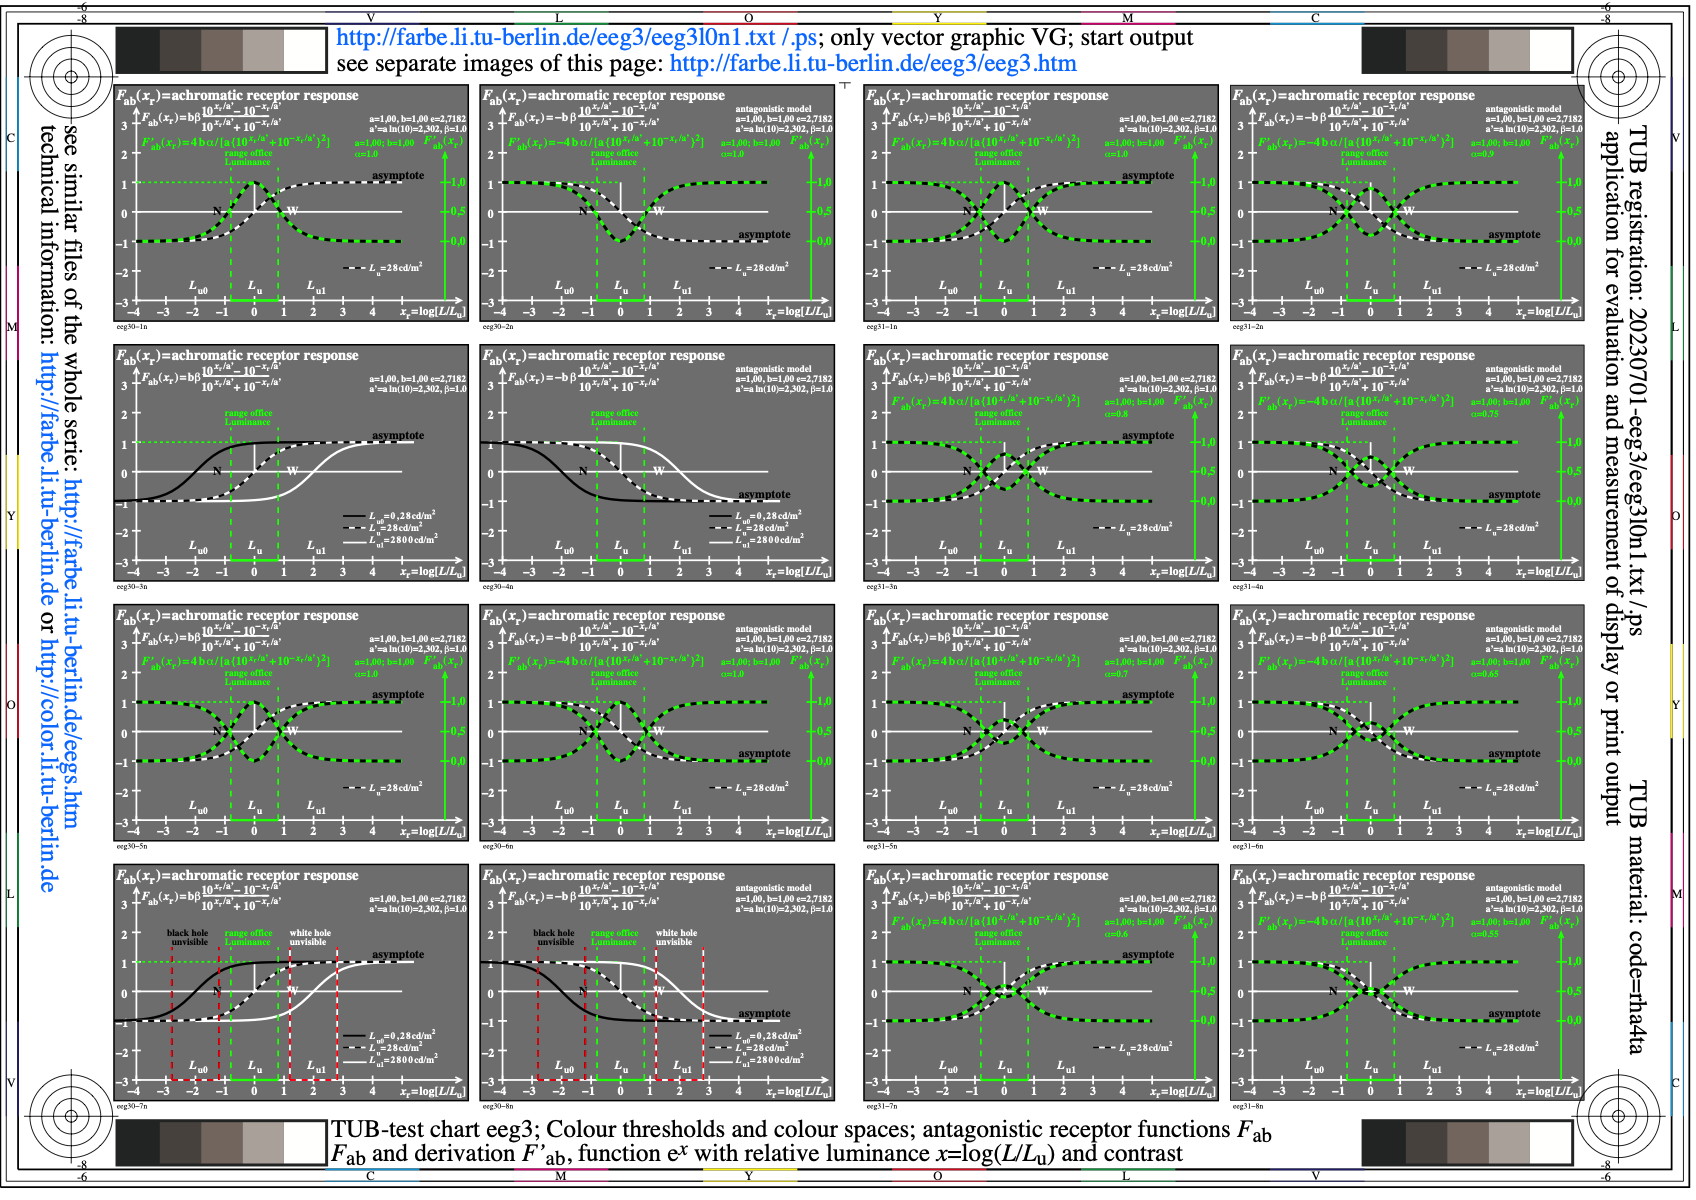
Image eeg3l0n1.jpg: Output in format A6 of the file
eeg3l0np.pdf, see
eeg3l0n1.
PS /
TXT /
PDF /
jpg
eeg3: TUB-test chart eeg3; Antagonistic receptor functions Fab
Exponential receptor functions 10^x with x=log(L/Lu)
Derivation F'ab of antagonistic receptor functions Fab
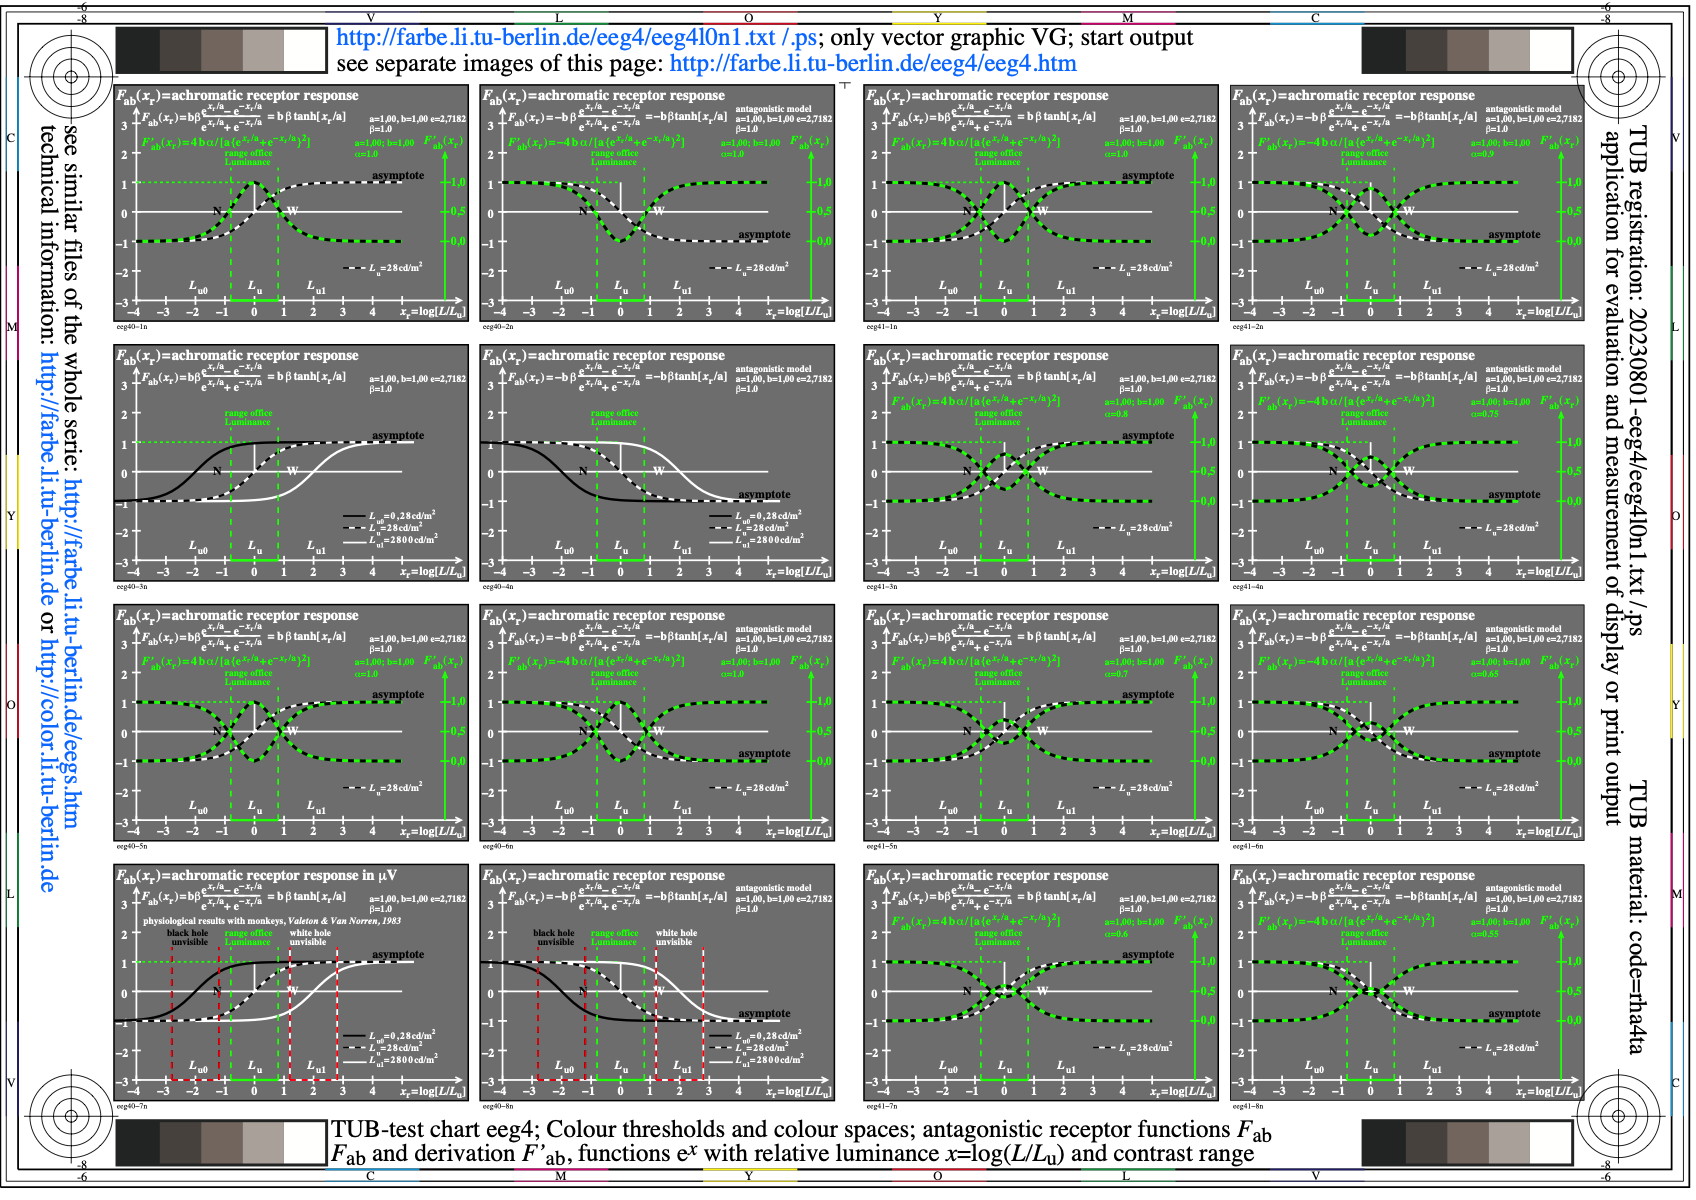
Image eeg4l0n1.jpg: Output in format A6 of the file
eeg4l0np.pdf, see
eeg4l0n1.
PS /
TXT /
PDF /
jpg
eeg4: TUB-test chart eeg4; Receptor functions Fab and contrast
Exponential receptor functions e^x with x=log(L/Lu)
Derivation F'ab of antagonistic receptor functions Fab
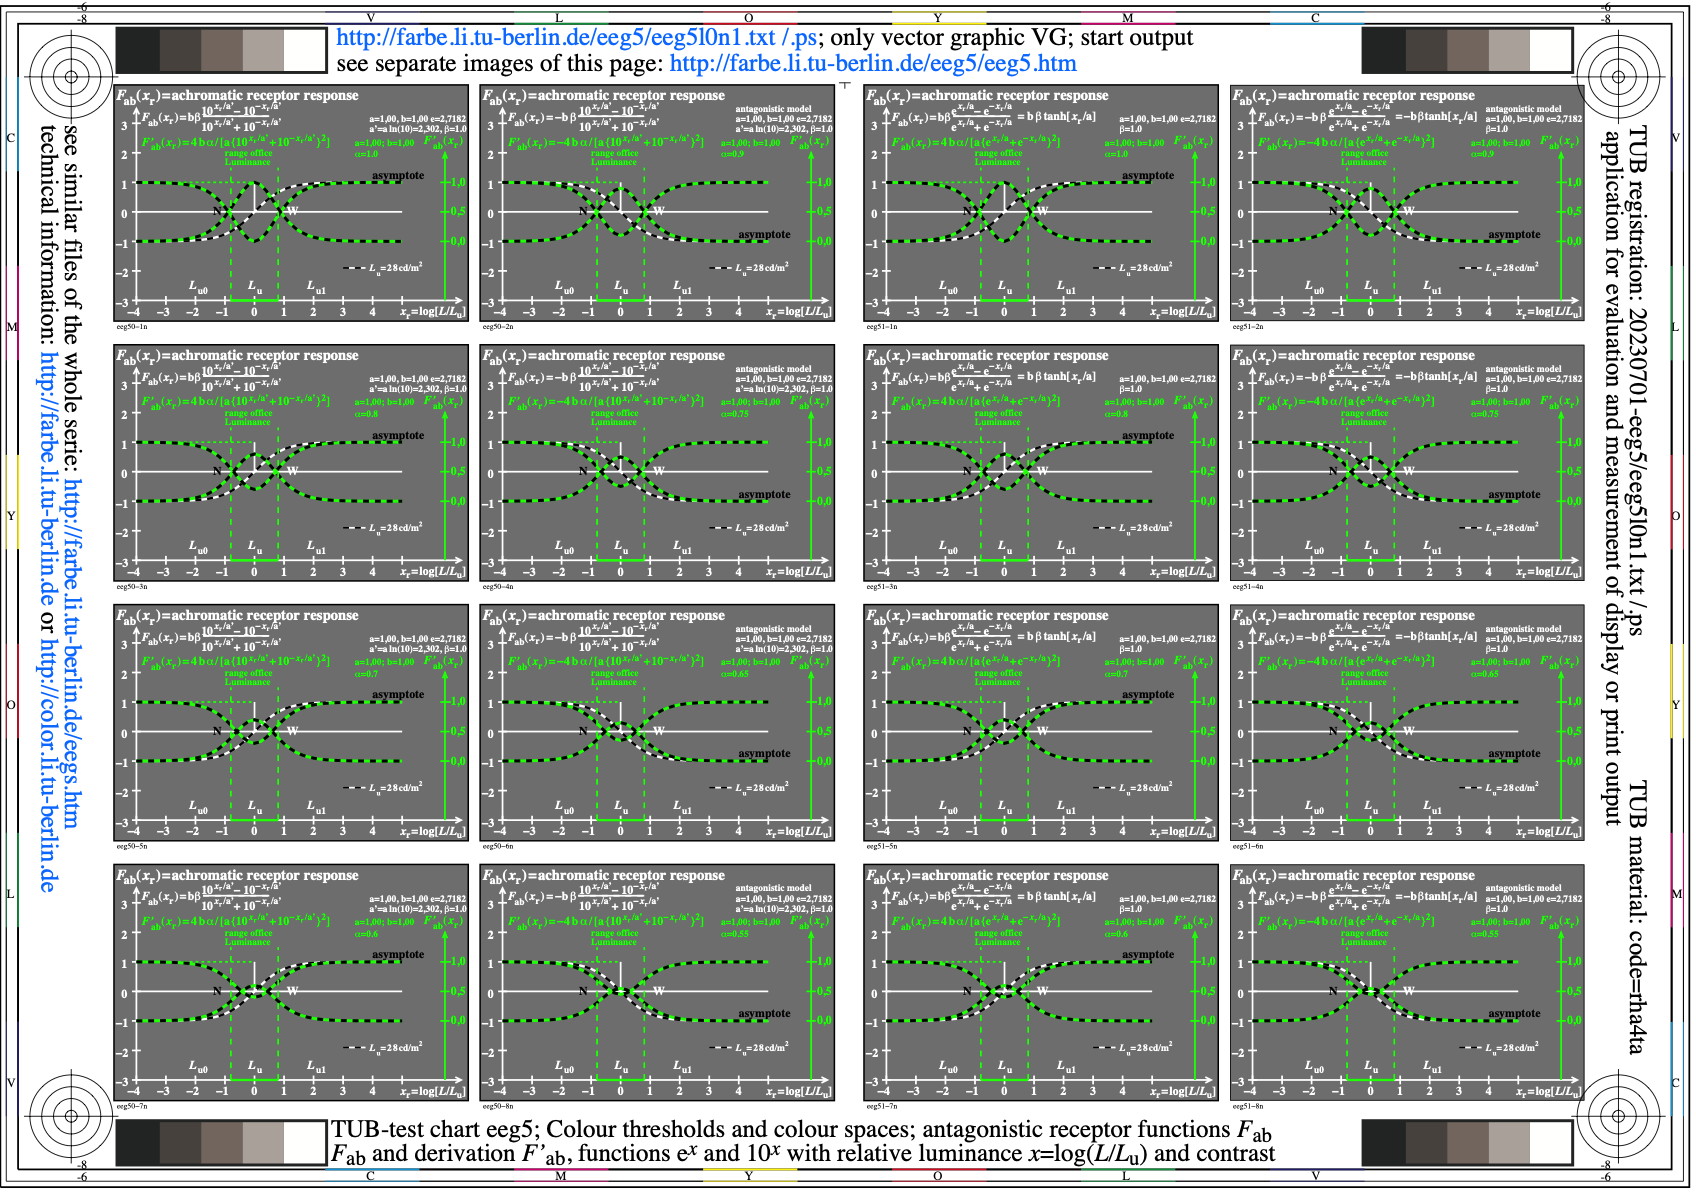
Image eeg5l0n1.jpg: Output in format A6 of the file
eeg5l0np.pdf, see
eeg5l0n1.
PS /
TXT /
PDF /
jpg
eeg5: TUB-test chart eeg5; Receptor functions Fab and contrast
Exponential receptor functions 10^x with x=log(L/Lu)
Derivation F'ab of antagonistic receptor functions Fab
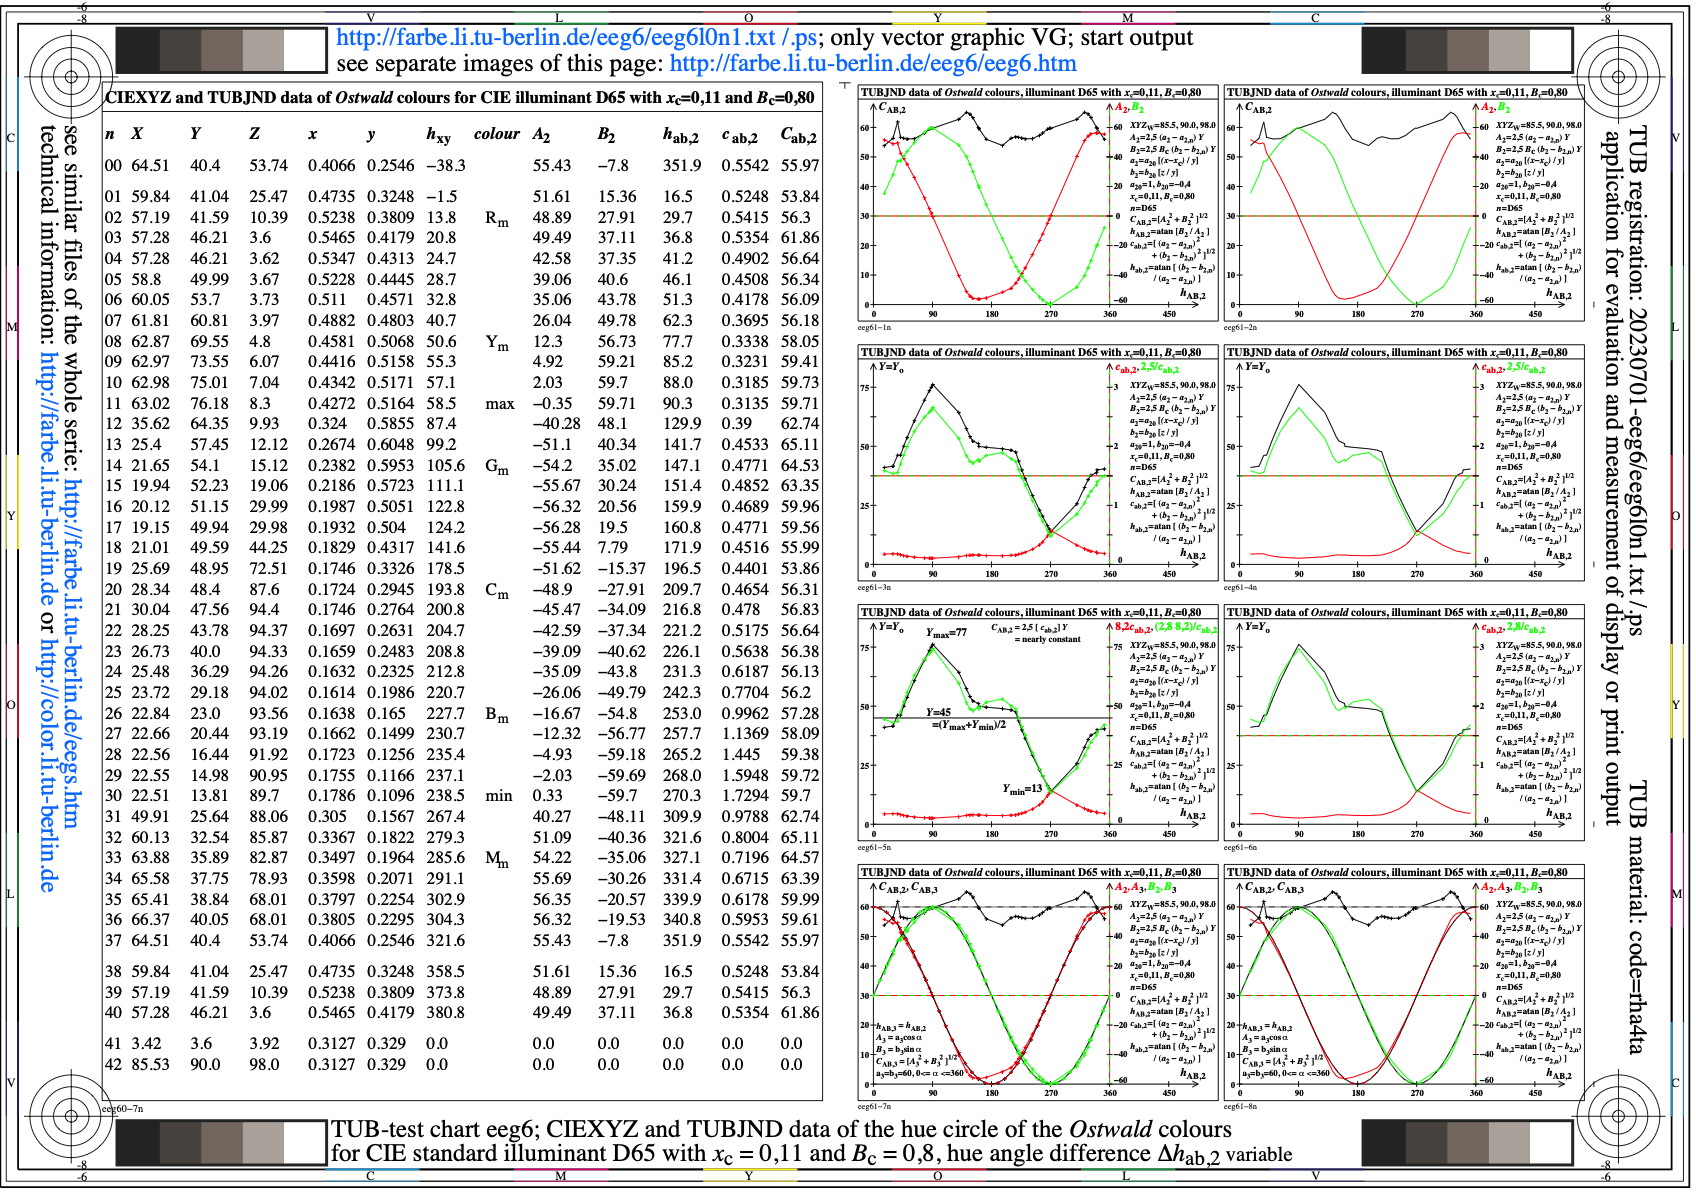
Image eeg6l0n1.jpg: Output in format A6 of the file
eeg6l0np.pdf, see
eeg6l0n1.
PS /
TXT /
PDF /
jpg
eeg6: TUB-test chart eeg6; Ostwald optimal colours for D65
Calculation of tristimulus values Yu for equal greyness
as function of CIE chromaticity (x,y), alpha variable

Image eeg7l0n1.jpg: Output in format A6 of the file
eeg7l0np.pdf, see
eeg7l0n1.
PS /
TXT /
PDF /
jpg
eeg7: TUB-test chart eeg7; Ostwald optimal colours for D65
Calculation of tristimulus values Yu for equal greyness
as function of CIE chromaticity (x,y), alpha=10

Image eeg8l0n1.jpg: Output in format A6 of the file
eeg8l0np.pdf, see
eeg8l0n1.
PS /
TXT /
PDF /
jpg
eeg8: TUB-test chart eeg8; Ostwald optimal colours for D50
Calculation of tristimulus values Yu for equal greyness
as function of CIE chromaticity (x,y), alpha variable
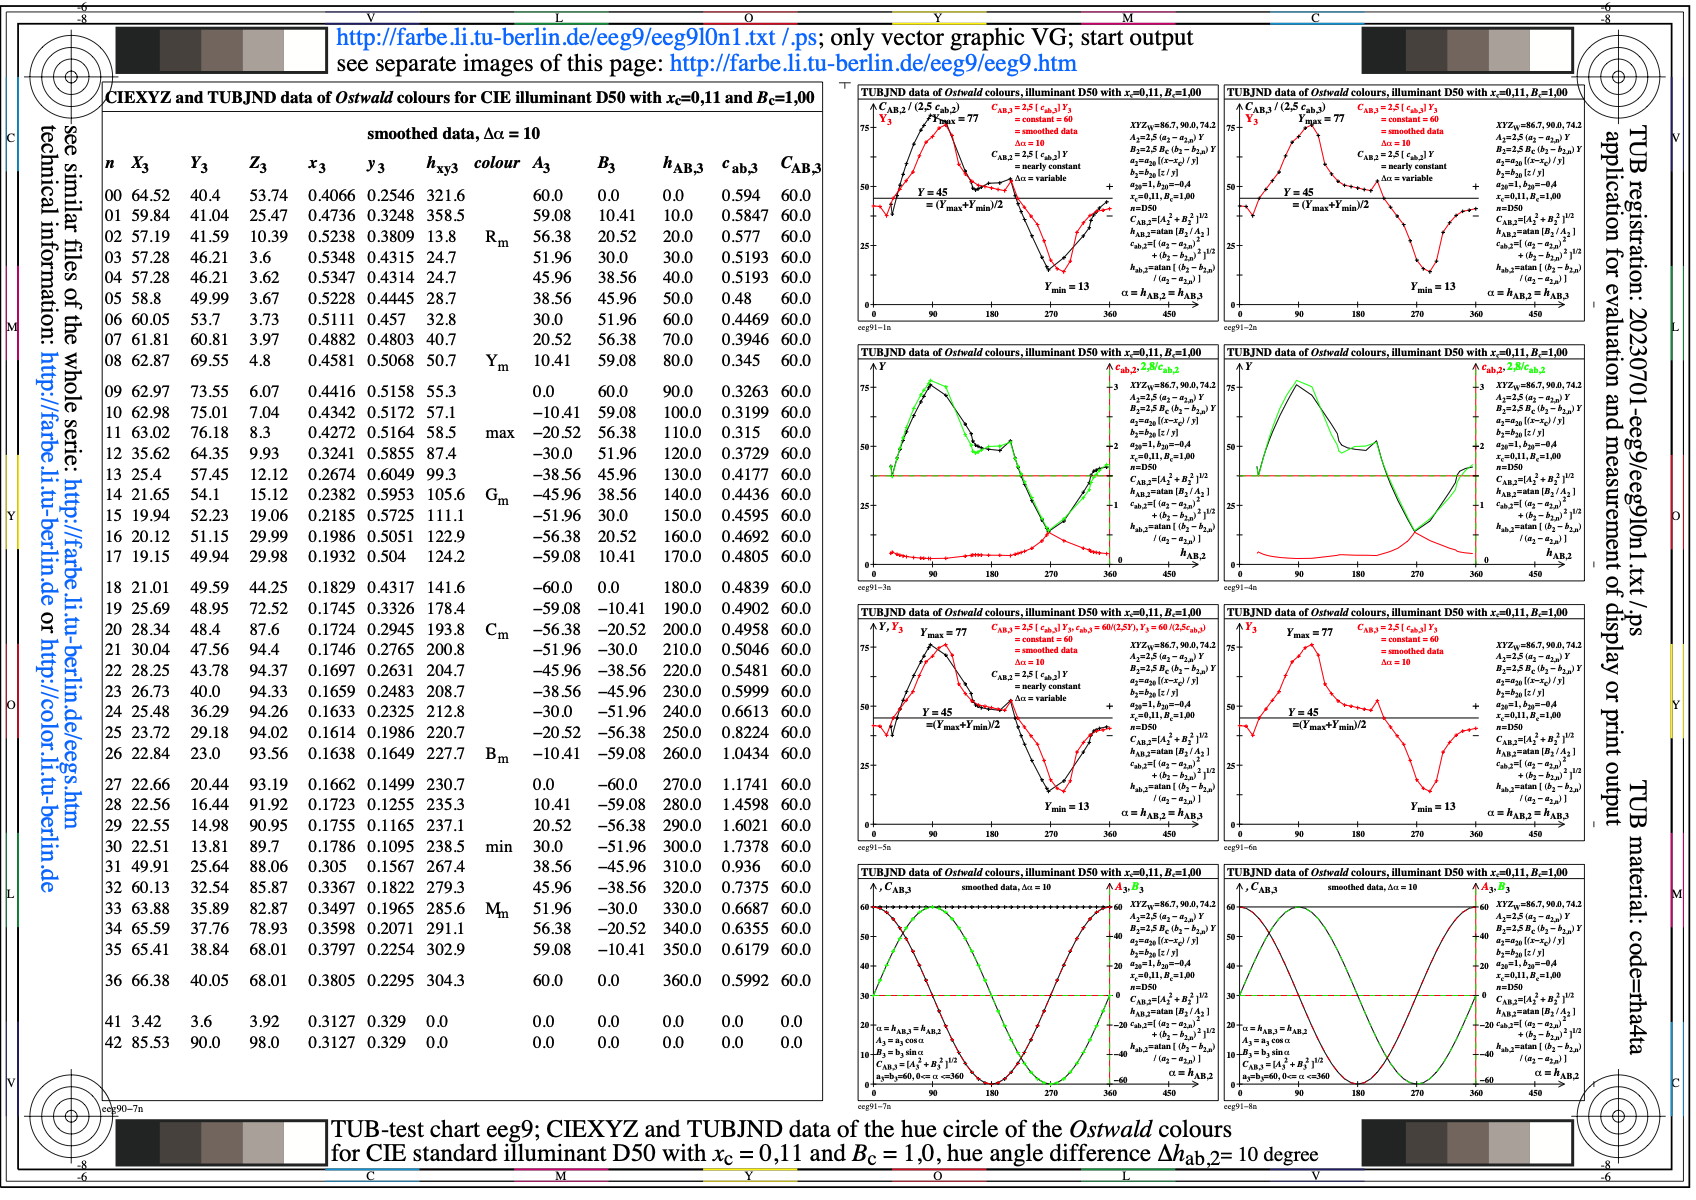
Image eeg9l0n1.jpg: Output in format A6 of the file
eeg9l0np.pdf, see
eeg9l0n1.
PS /
TXT /
PDF /
jpg
eeg9: TUB-test chart eeg9; Ostwald optimal colours for D50
Calculation of tristimulus values Yu for equal greyness
as function of CIE chromaticity (x,y), alpha=10
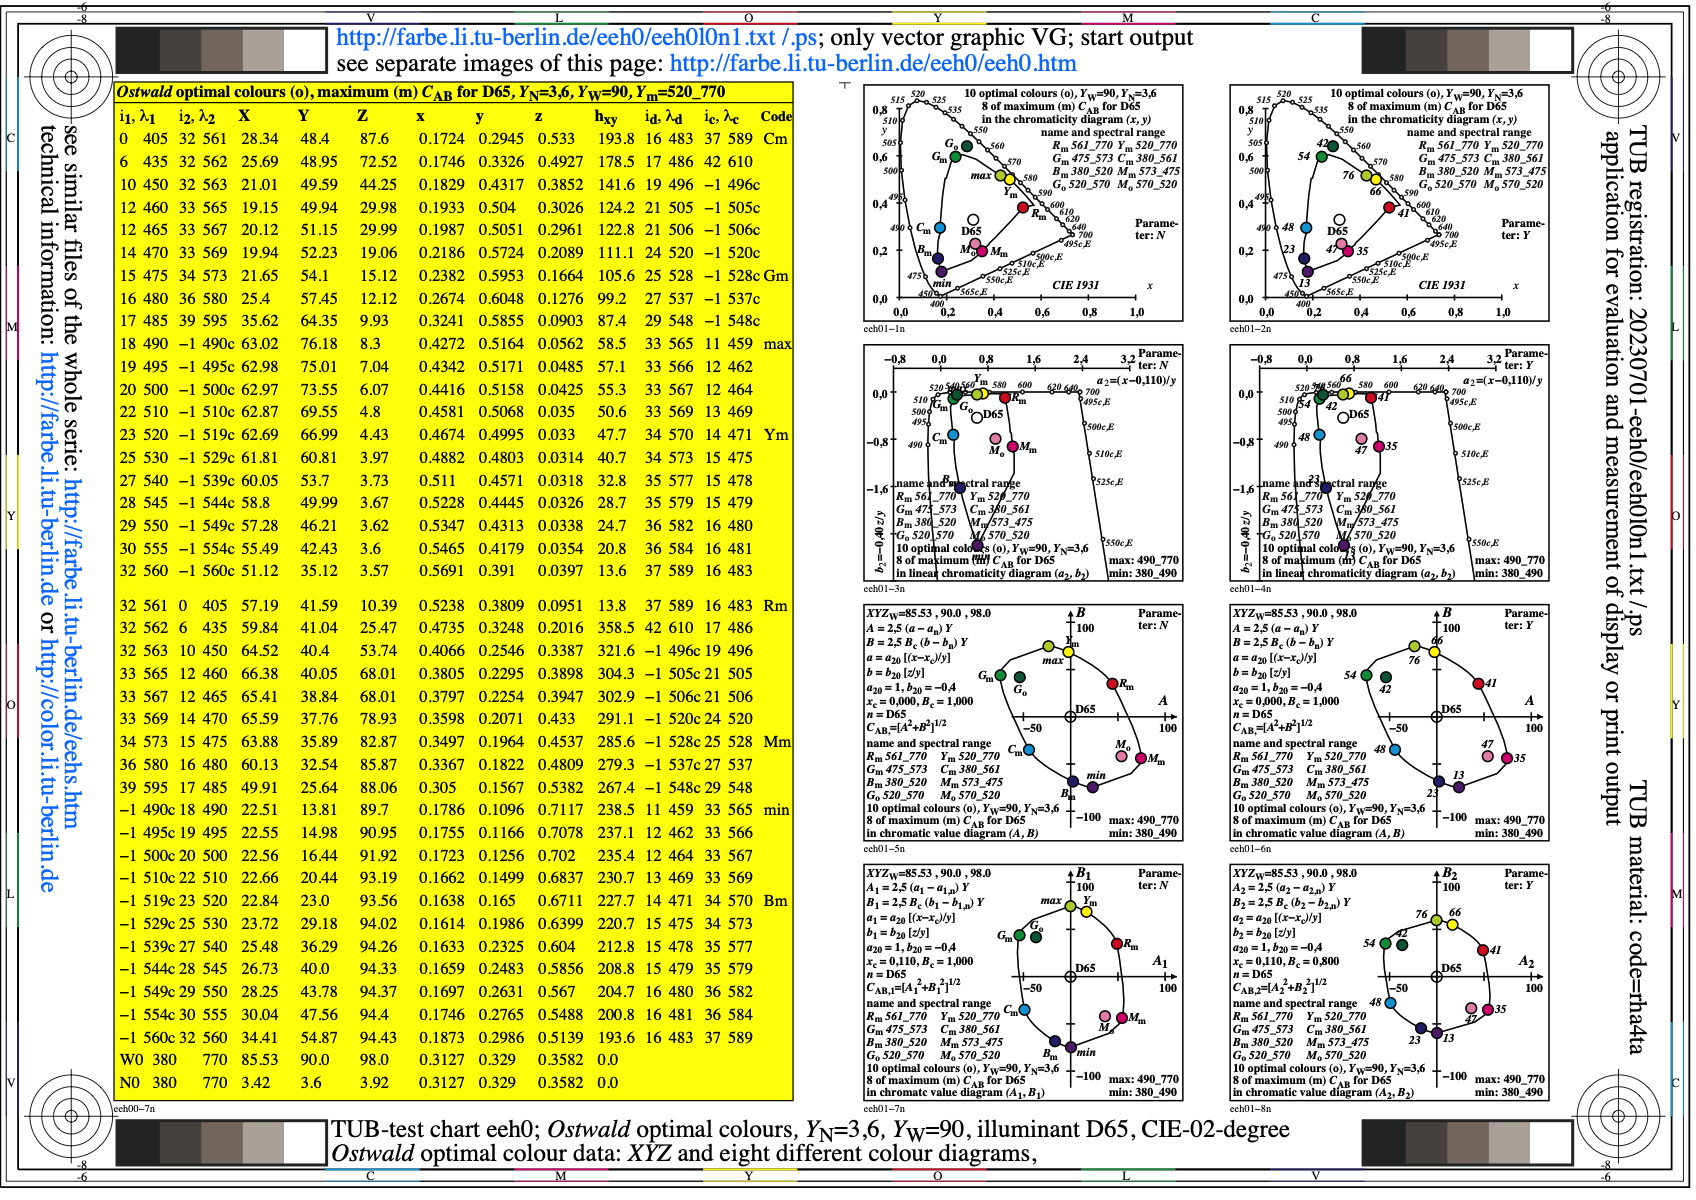
Image eeh0l0n1.jpg: Output in format A6 of the file
eeh0l0np.pdf, see
eeh0l0n1.
PS /
TXT /
PDF /
jpg
eeh0: TUB-test chart eeh0; Ostwald-optimal colours
YN=3,6, YW=90, CIE illuminant D65, CIE 02 degree
XYZ data, wavelength limits, and 8 colour diagrams
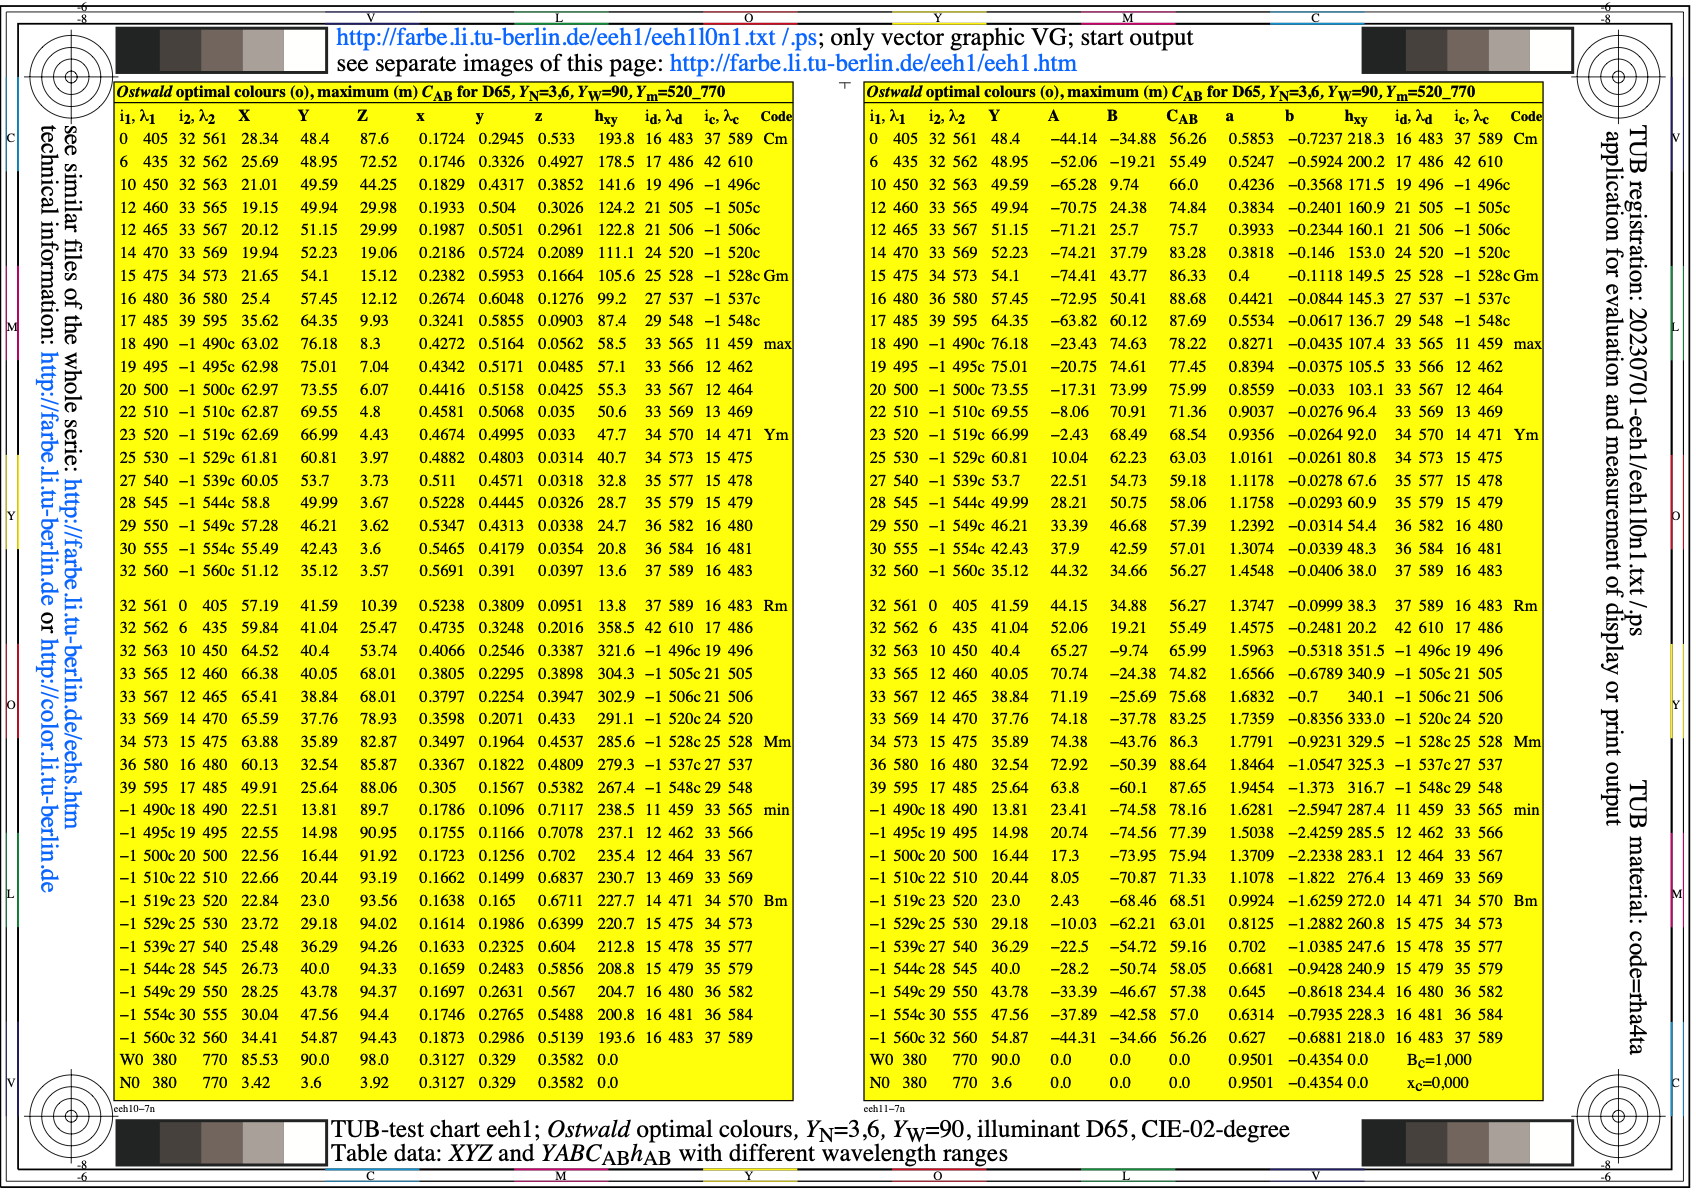
Image eeh1l0n1.jpg: Output in format A6 of the file
eeh1l0np.pdf, see
eeh1l0n1.
PS /
TXT /
PDF /
jpg
eeh1: TUB-test chart eeh1; Ostwald-optimal colours
YN=3,6, YW=90, CIE illuminant D65, CIE 02 degree
Table data XYZ and YABCh with wavelength limits
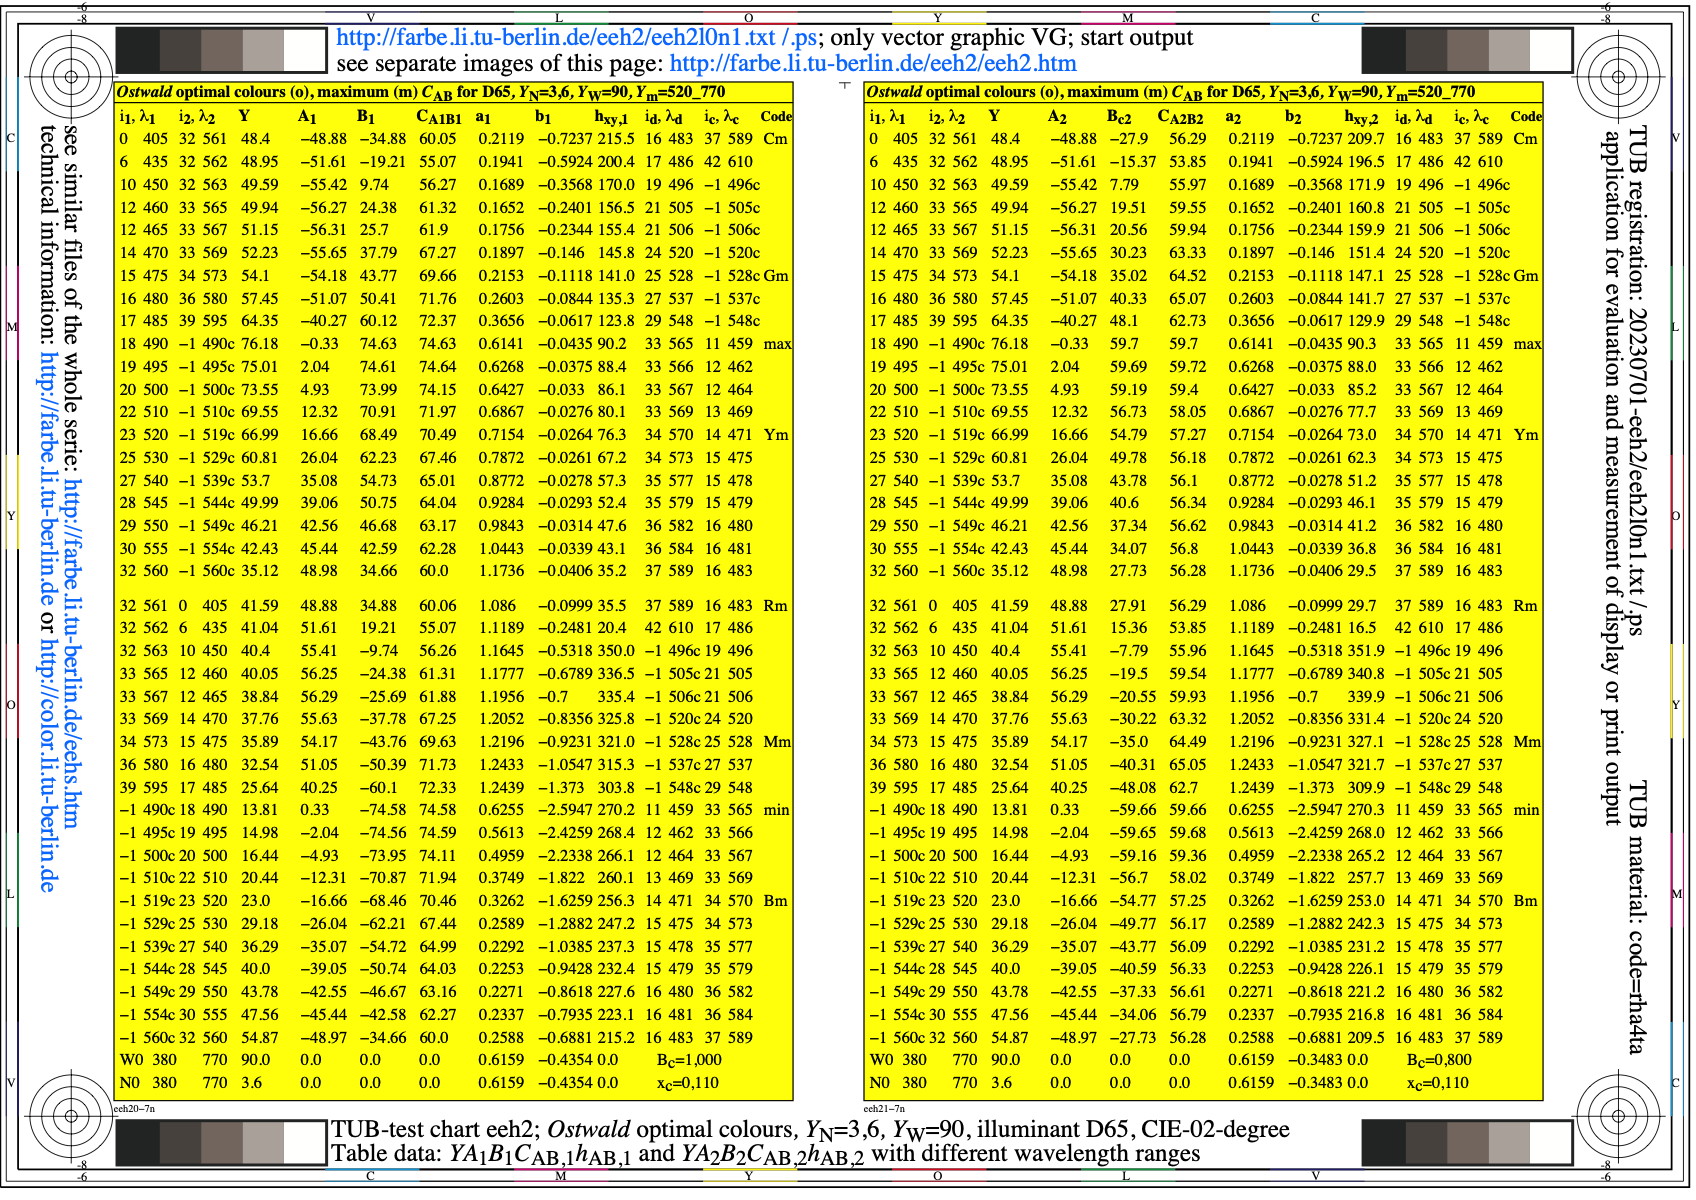
Image eeh2l0n1.jpg: Output in format A6 of the file
eeh2l0np.pdf, see
eeh2l0n1.
PS /
TXT /
PDF /
jpg
eeh2: TUB-test chart eeh2; Ostwald-optimal colours
YN=3,6, YW=90, CIE illuminant D65, CIE 02 degree
Table data YABCh1 and YABCh2 with wavelength limits
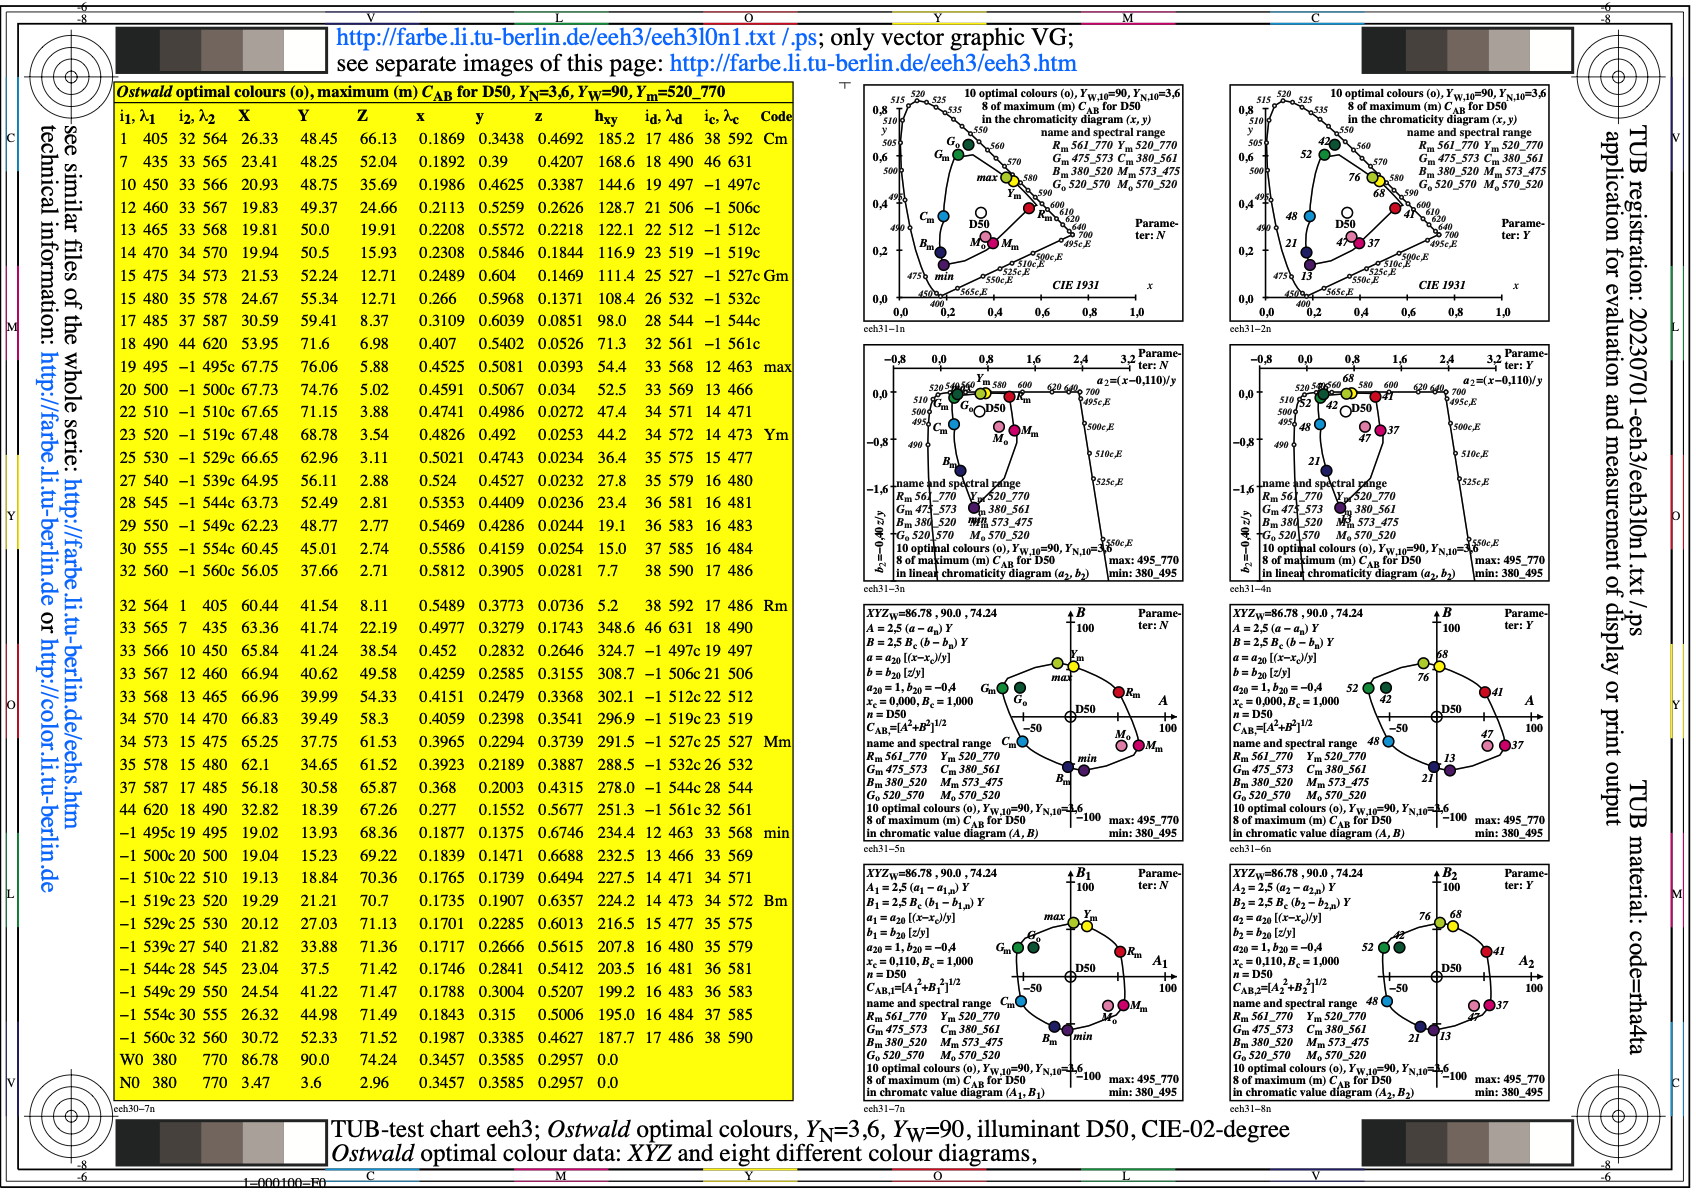
Image eeh3l0n1.jpg: Output in format A6 of the file
eeh3l0np.pdf, see
eeh3l0n1.
PS /
TXT /
PDF /
jpg
eeh3: TUB-test chart eeh3; Ostwald-optimal colours
YN=3,6, YW=90, CIE illuminant D50, CIE 02 degree
XYZ data, wavelength limits, and 8 colour diagrams
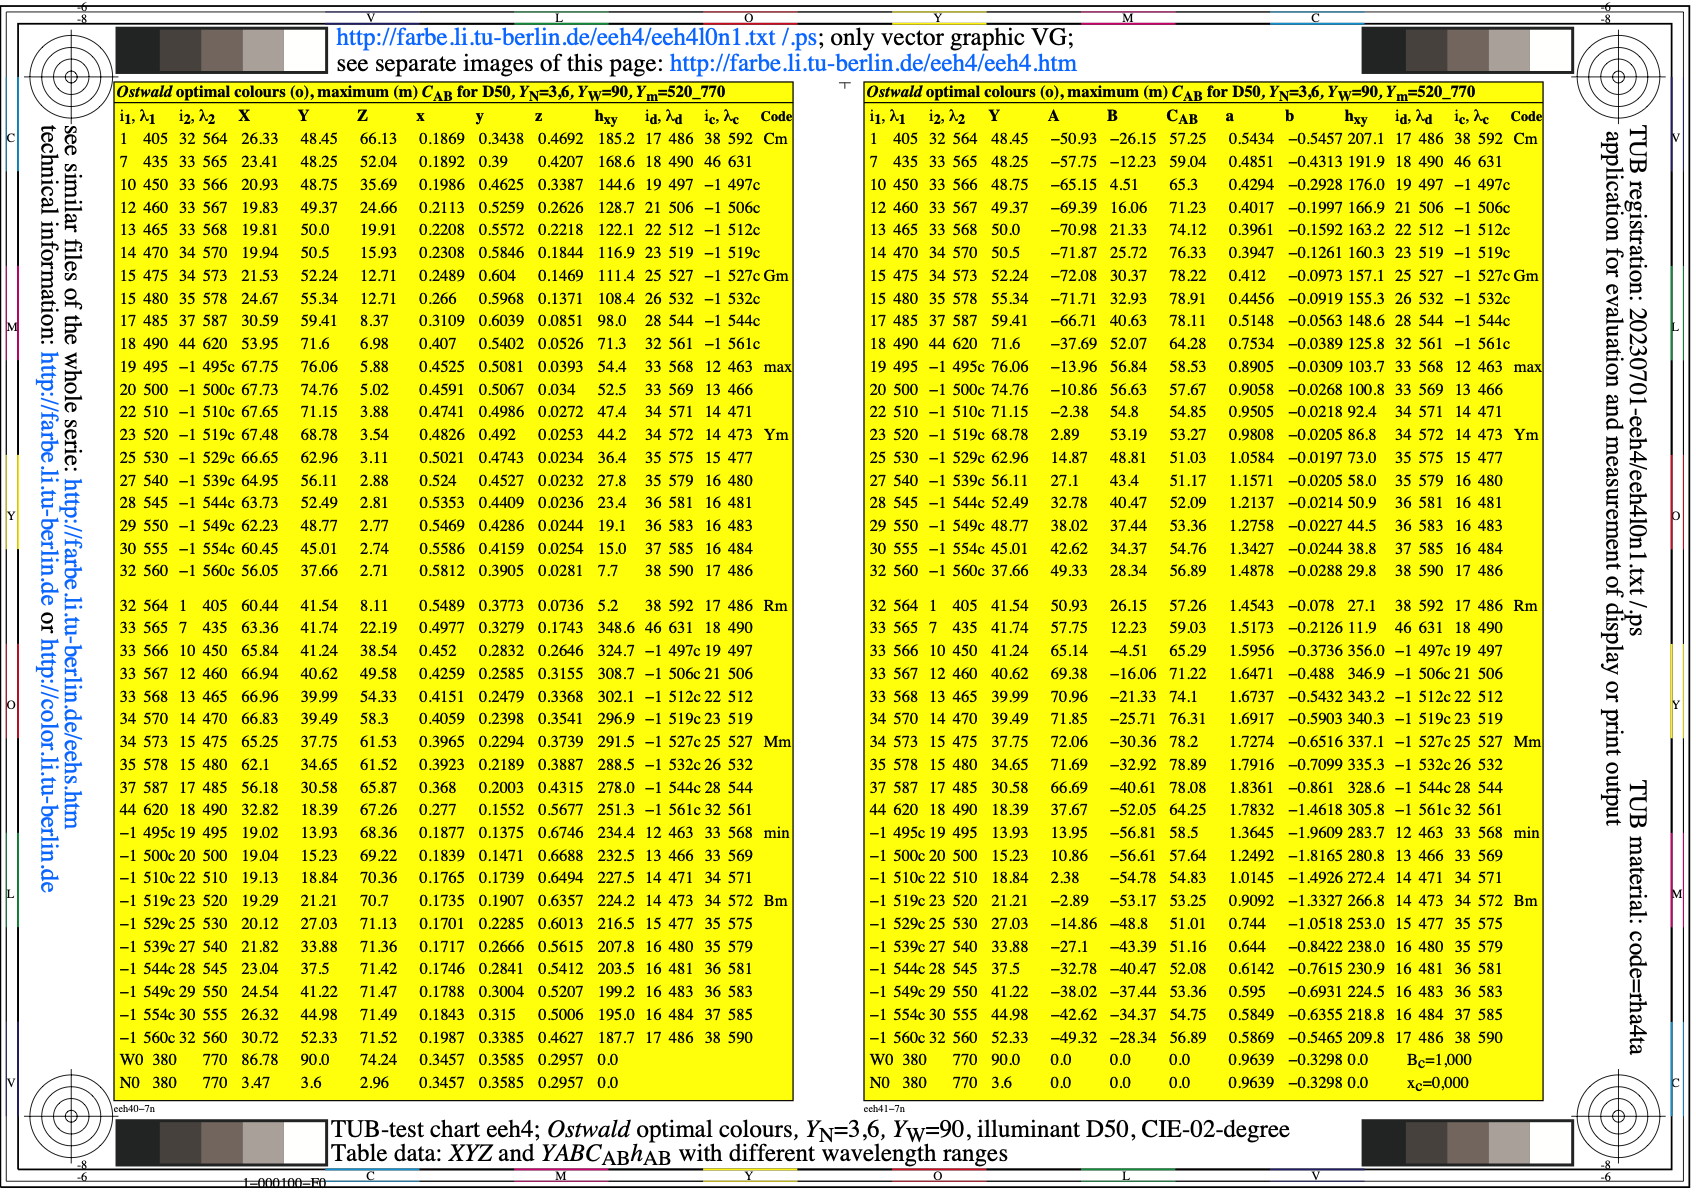
Image eeh4l0n1.jpg: Output in format A6 of the file
eeh4l0np.pdf, see
eeh4l0n1.
PS /
TXT /
PDF /
jpg
eeh4: TUB-test chart eeh4; Ostwald-optimal colours
YN=3,6, YW=90, CIE illuminant D50, CIE 02 degree
Table data XYZ and YABCh with wavelength limits
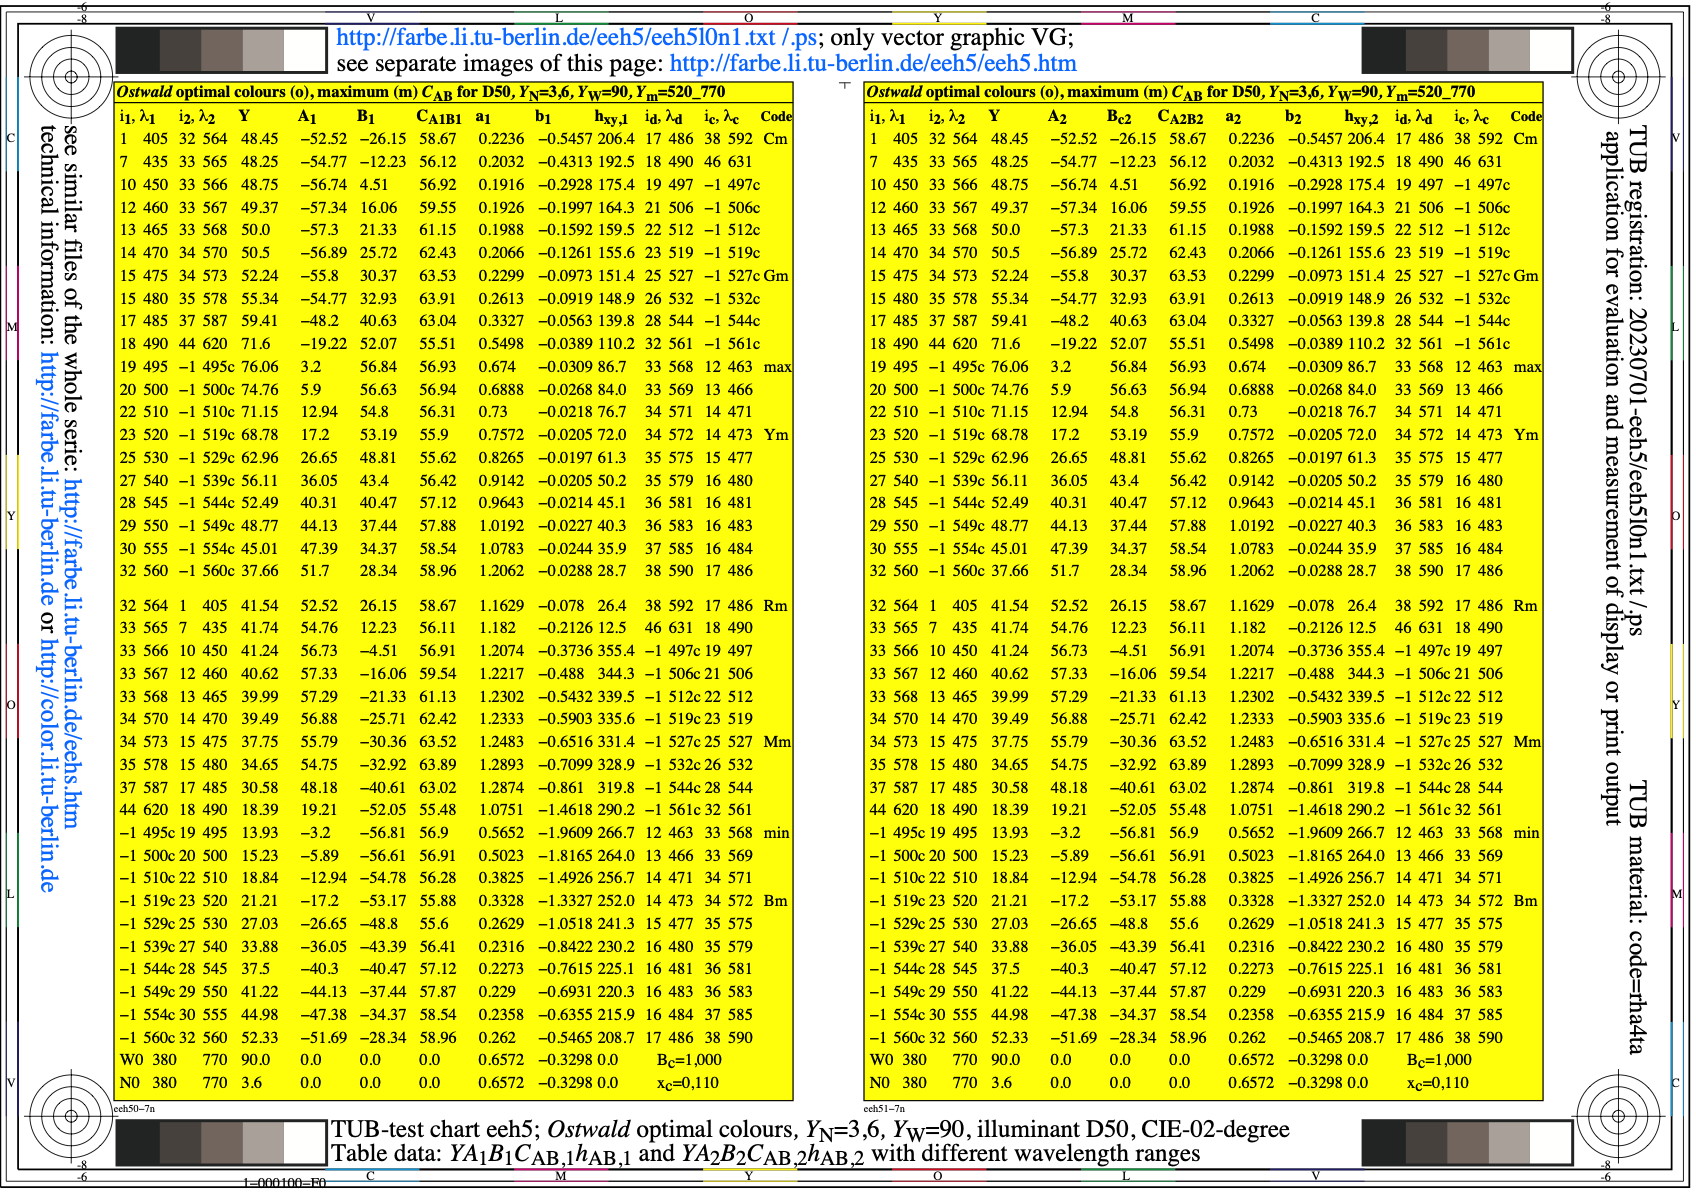
Image eeh5l0n1.jpg: Output in format A6 of the file
eeh5l0np.pdf, see
eeh5l0n1.
PS /
TXT /
PDF /
jpg
eeh5: TUB-test chart eeh5; Ostwald-optimal colours
YN=3,6, YW=90, CIE illuminant D50, CIE 02 degree
Table data YABCh1 and YABCh2 with wavelength limits
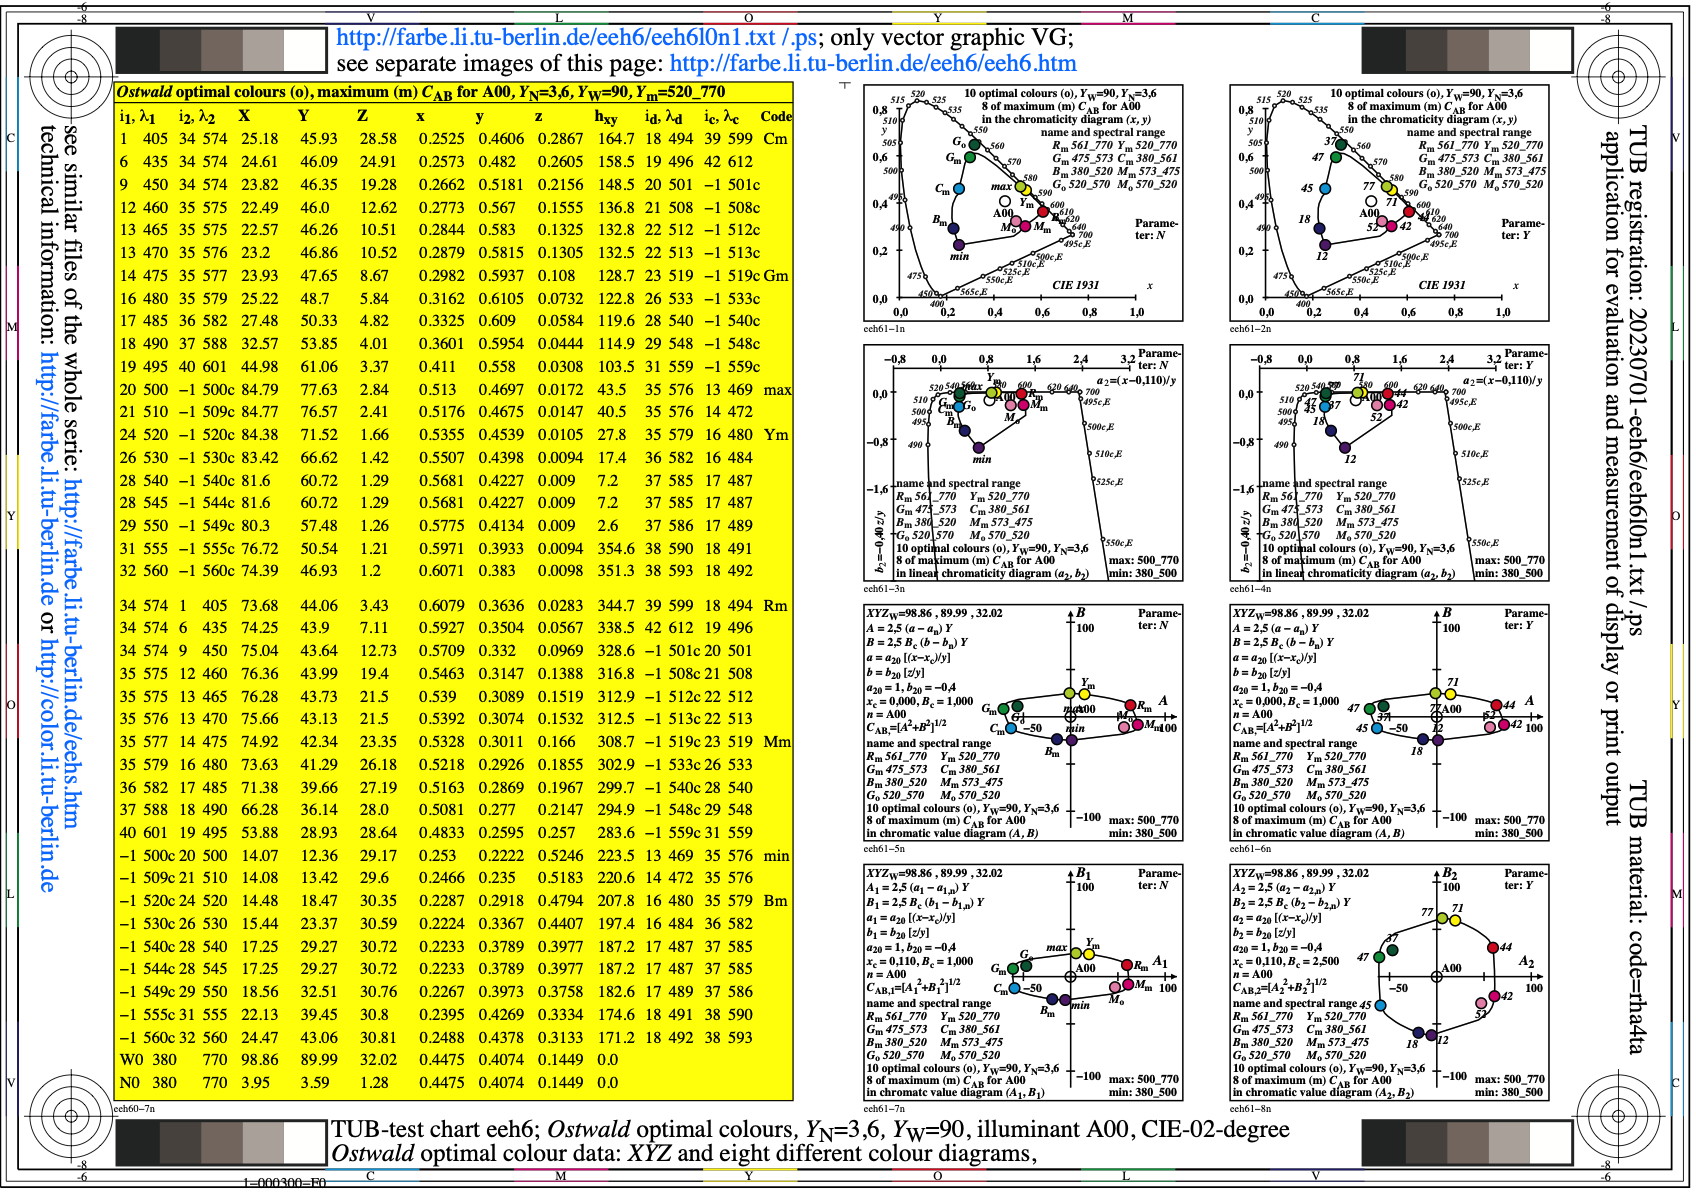
Image eeh6l0n1.jpg: Output in format A6 of the file
eeh6l0np.pdf, see
eeh6l0n1.
PS /
TXT /
PDF /
jpg
eeh6: TUB-test chart eeh6; Ostwald-optimal colours
YN=3,6, YW=90, CIE illuminant A, CIE 02 degree
XYZ data, wavelength limits, and 8 colour diagrams
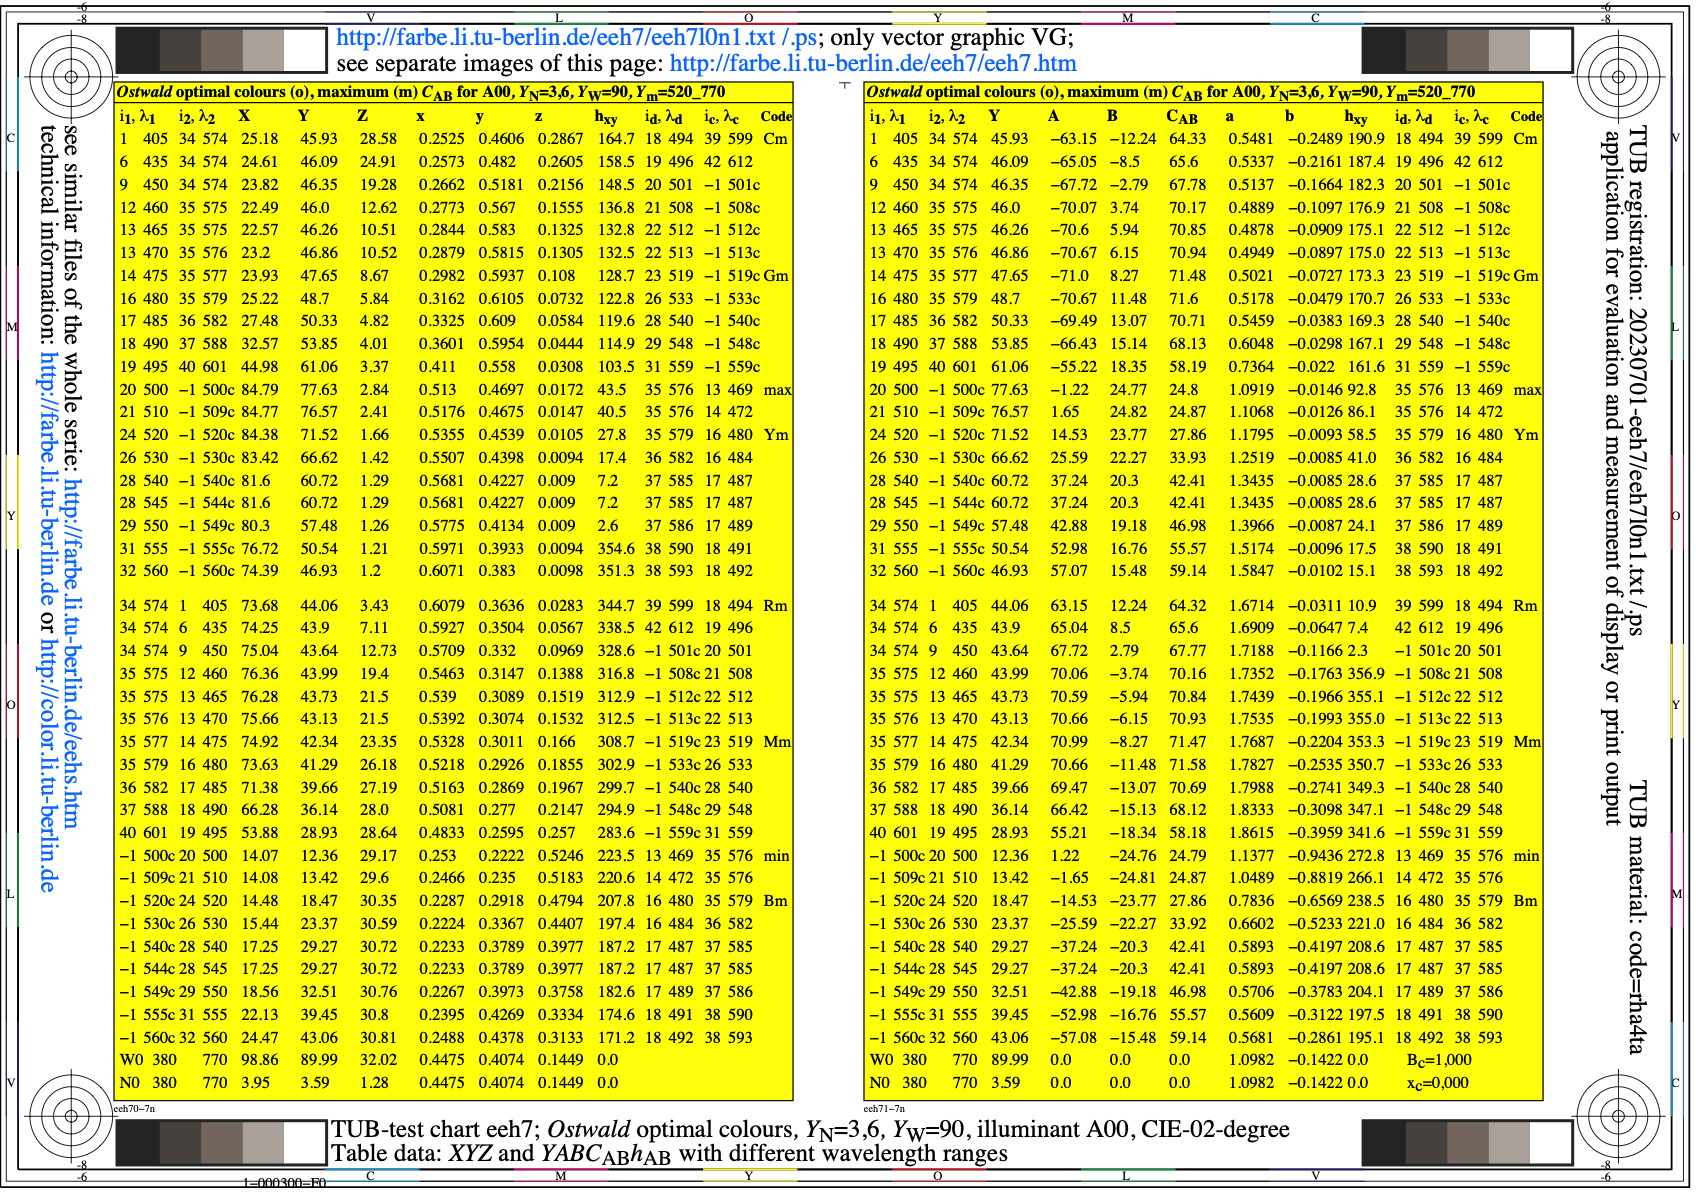
Image eeh7l0n1.jpg: Output in format A6 of the file
eeh7l0np.pdf, see
eeh7l0n1.
PS /
TXT /
PDF /
jpg
eeh7: TUB-test chart eeh7; Ostwald-optimal colours
YN=3,6, YW=90, CIE illuminant A, CIE 02 degree
Table data XYZ and YABCh with wavelength limits
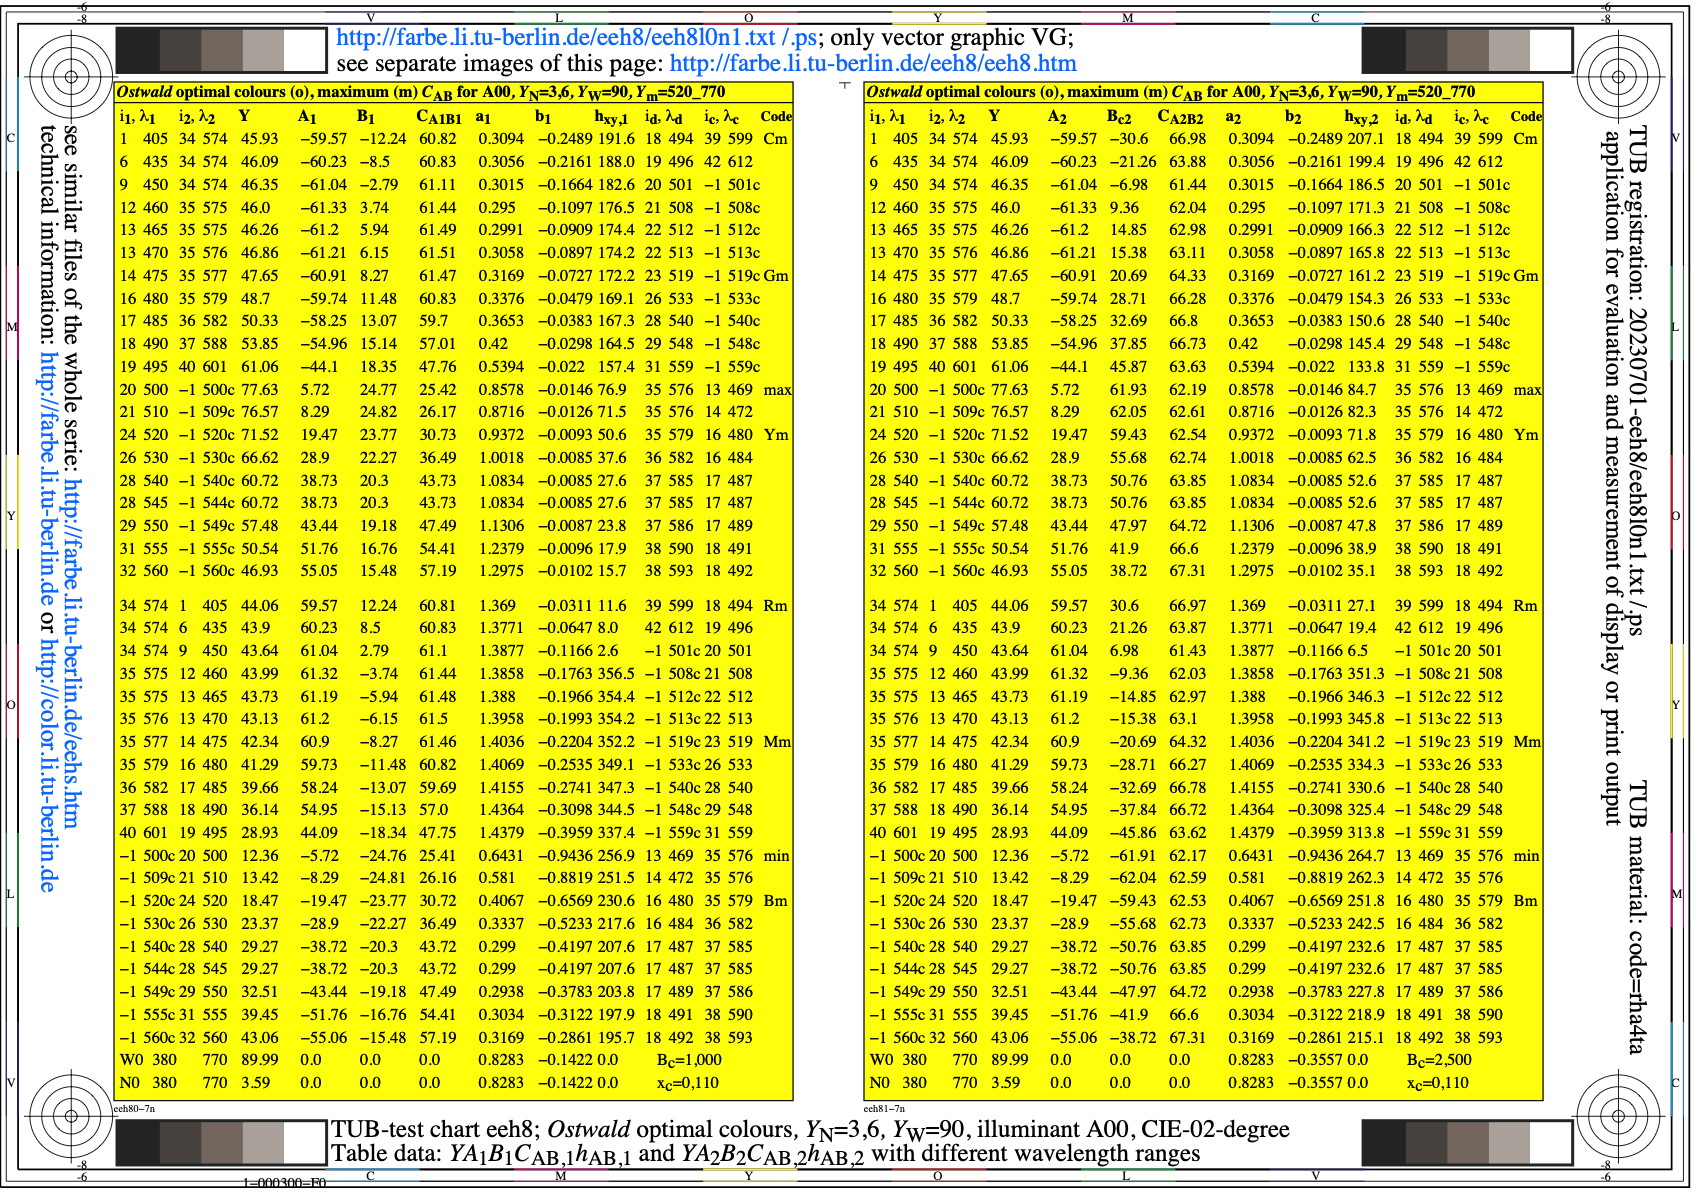
Image eeh8l0n1.jpg: Output in format A6 of the file
eeh8l0np.pdf, see
eeh8l0n1.
PS /
TXT /
PDF /
jpg
eeh8: TUB-test chart eeh8; Ostwald-optimal colours
YN=3,6, YW=90, CIE illuminant A, CIE 02 degree
Table data YABCh1 and YABCh2 with wavelength limits
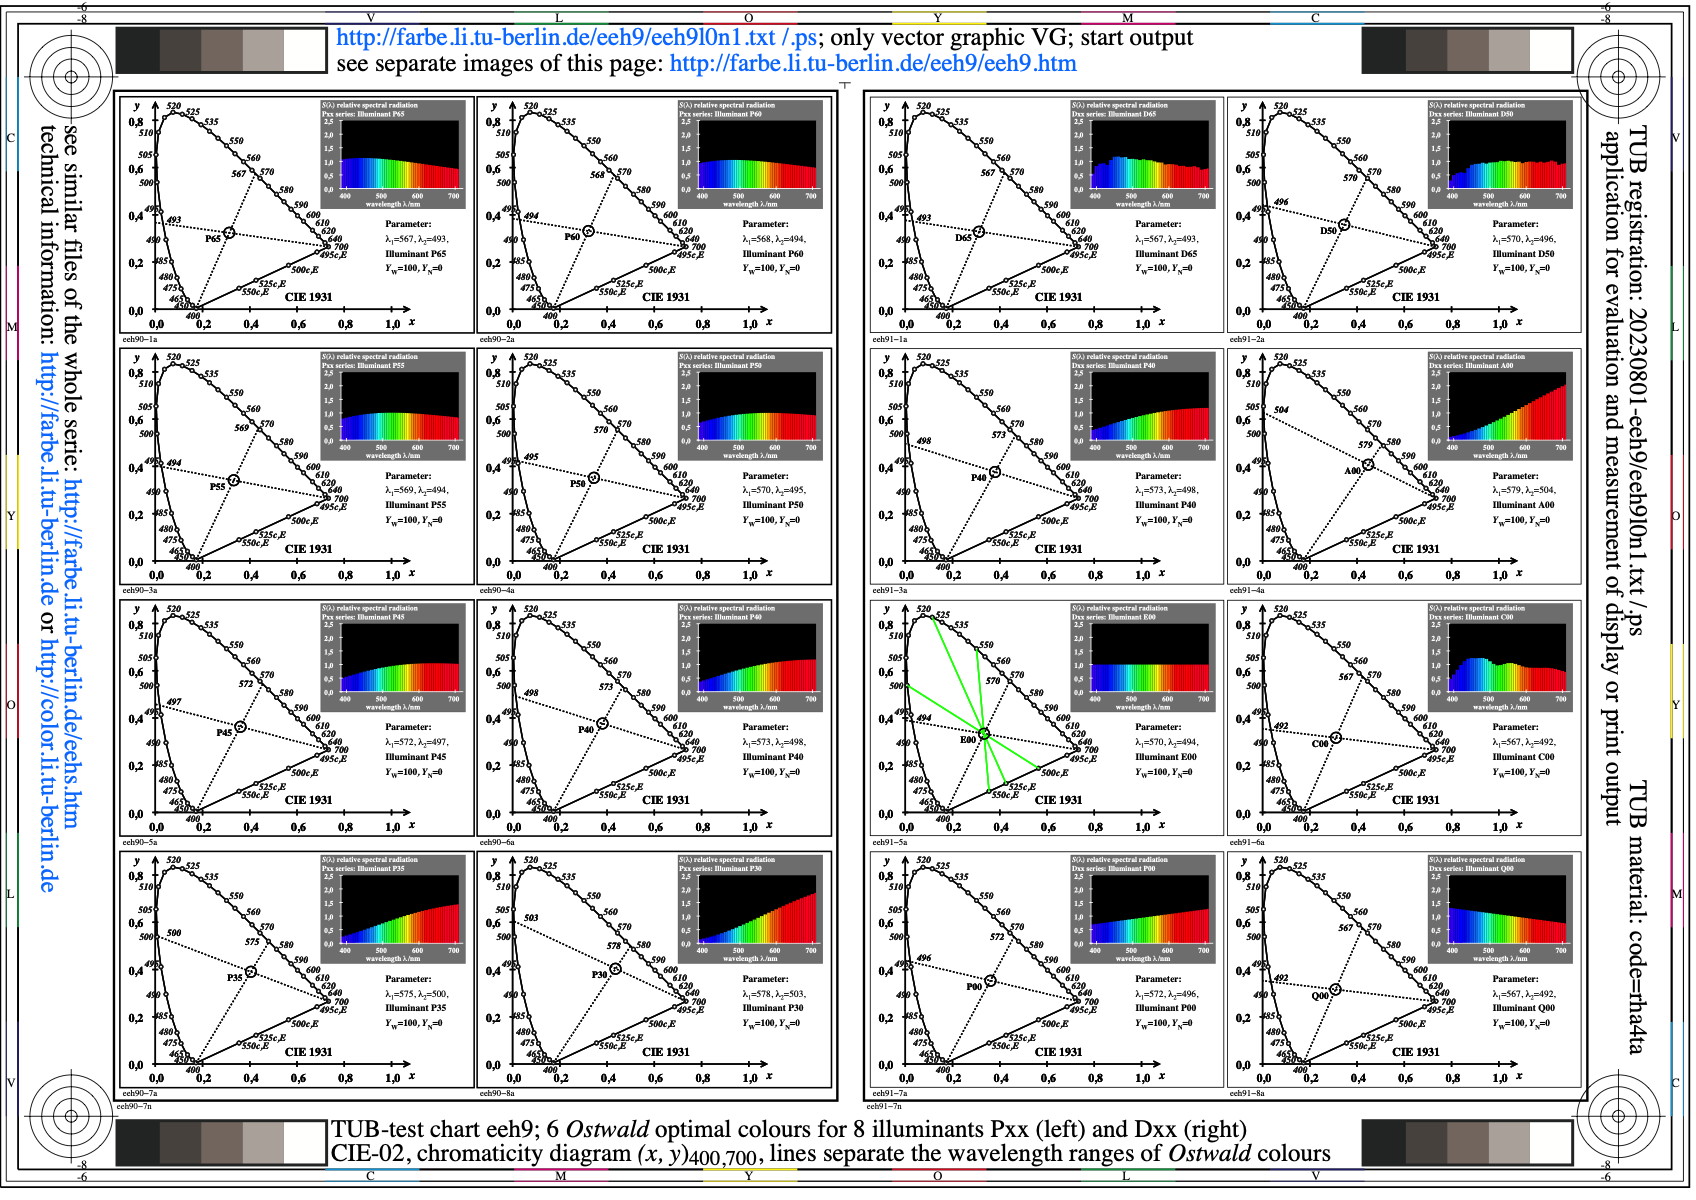
Image eeh9l0n1.jpg: Output in format A6 of the file
eeh9l0np.pdf, see
eeh9l0n1.
PS /
TXT /
PDF /
jpg
eeh9: TUB-test chart eeh9; 8 spectral radiations of Pxx and Dxx
and Dxx for calculation of Ostwald optimal colours;
wavelength limits by (x,y)400,700; CIE 02-degree observer
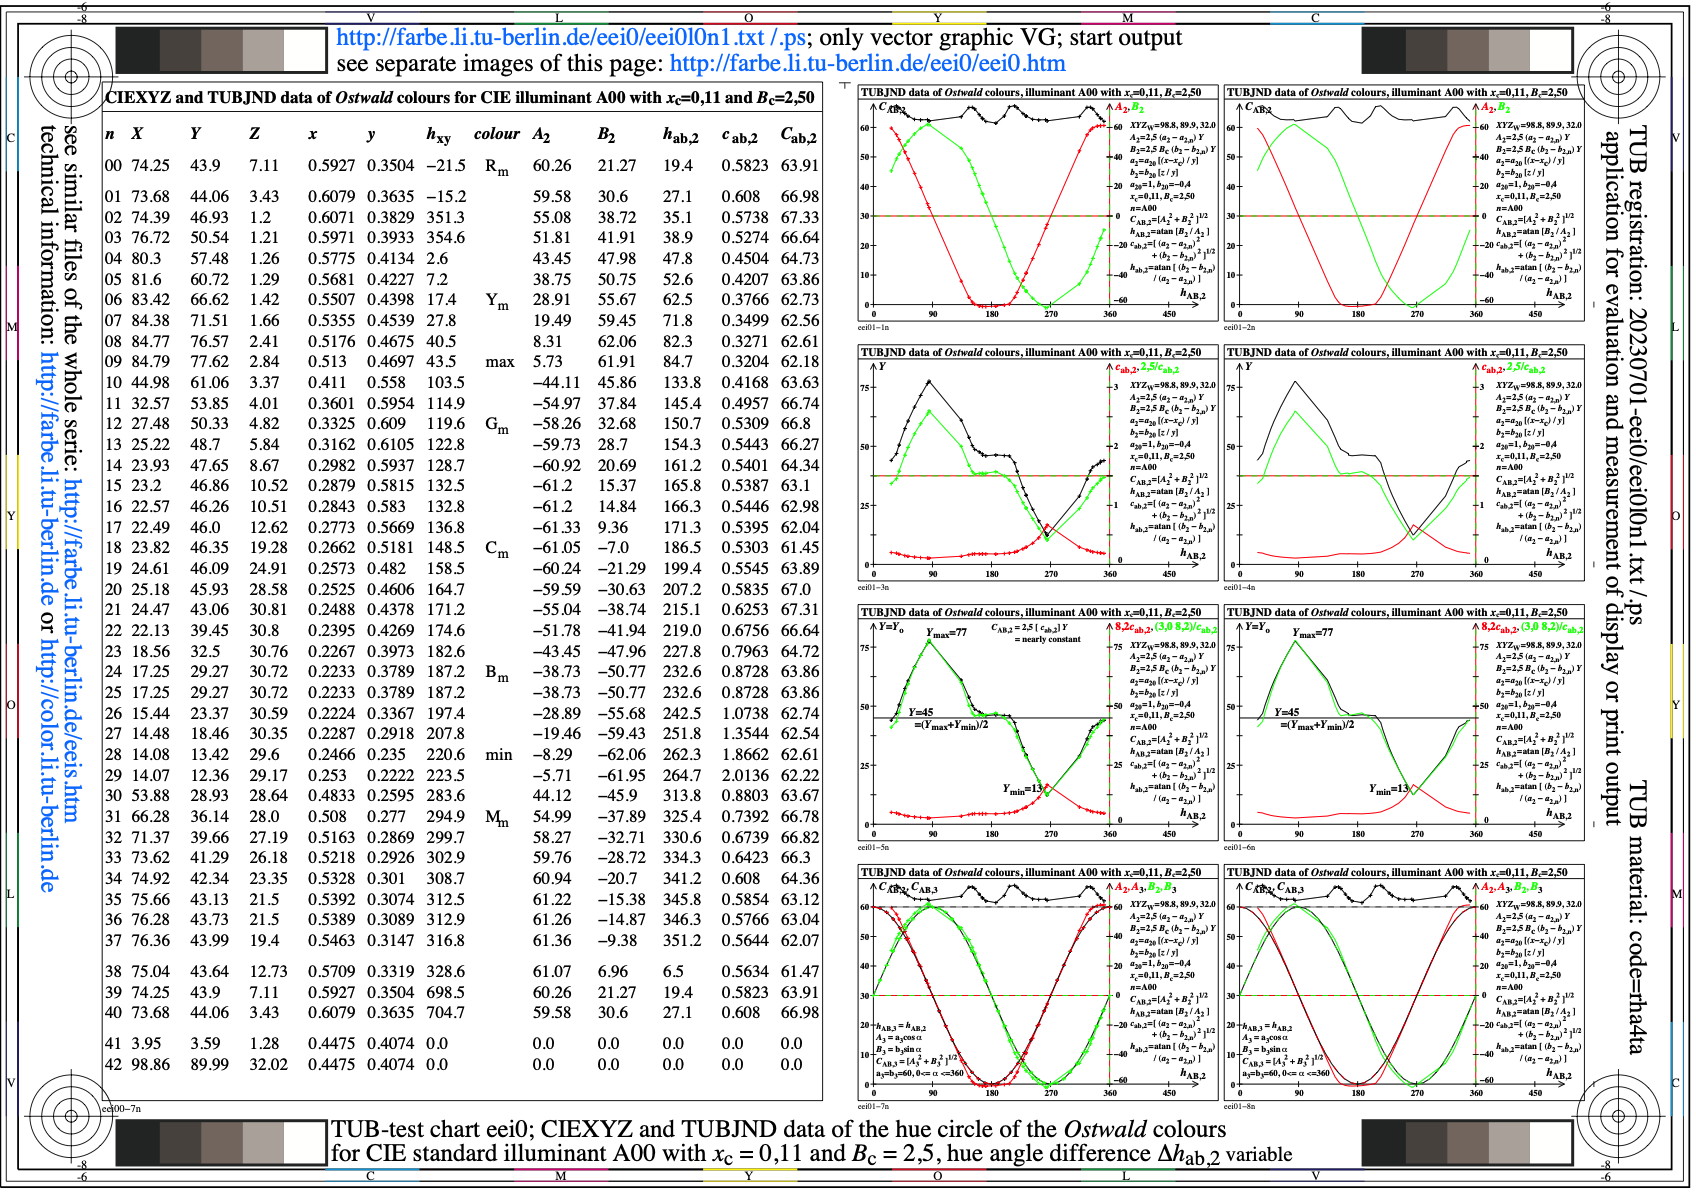
Image eei0l0n1.jpg: Output in format A6 of the file
eei0l0np.pdf, see
eei0l0n1.
PS /
TXT /
PDF /
jpg
eei0: TUB-test chart eei0; Ostwald optimal colours for A00
Calculation of tristimulus values Yu for equal greyness
as function of CIE chromaticity (x,y), alpha variable

Image eei1l0n1.jpg: Output in format A6 of the file
eei1l0np.pdf, see
eei1l0n1.
PS /
TXT /
PDF /
jpg
eei1: TUB-test chart eei1; Ostwald optimal colours for A00
Calculation of tristimulus values Yu for equal greyness
as function of CIE chromaticity (x,y), alpha=10
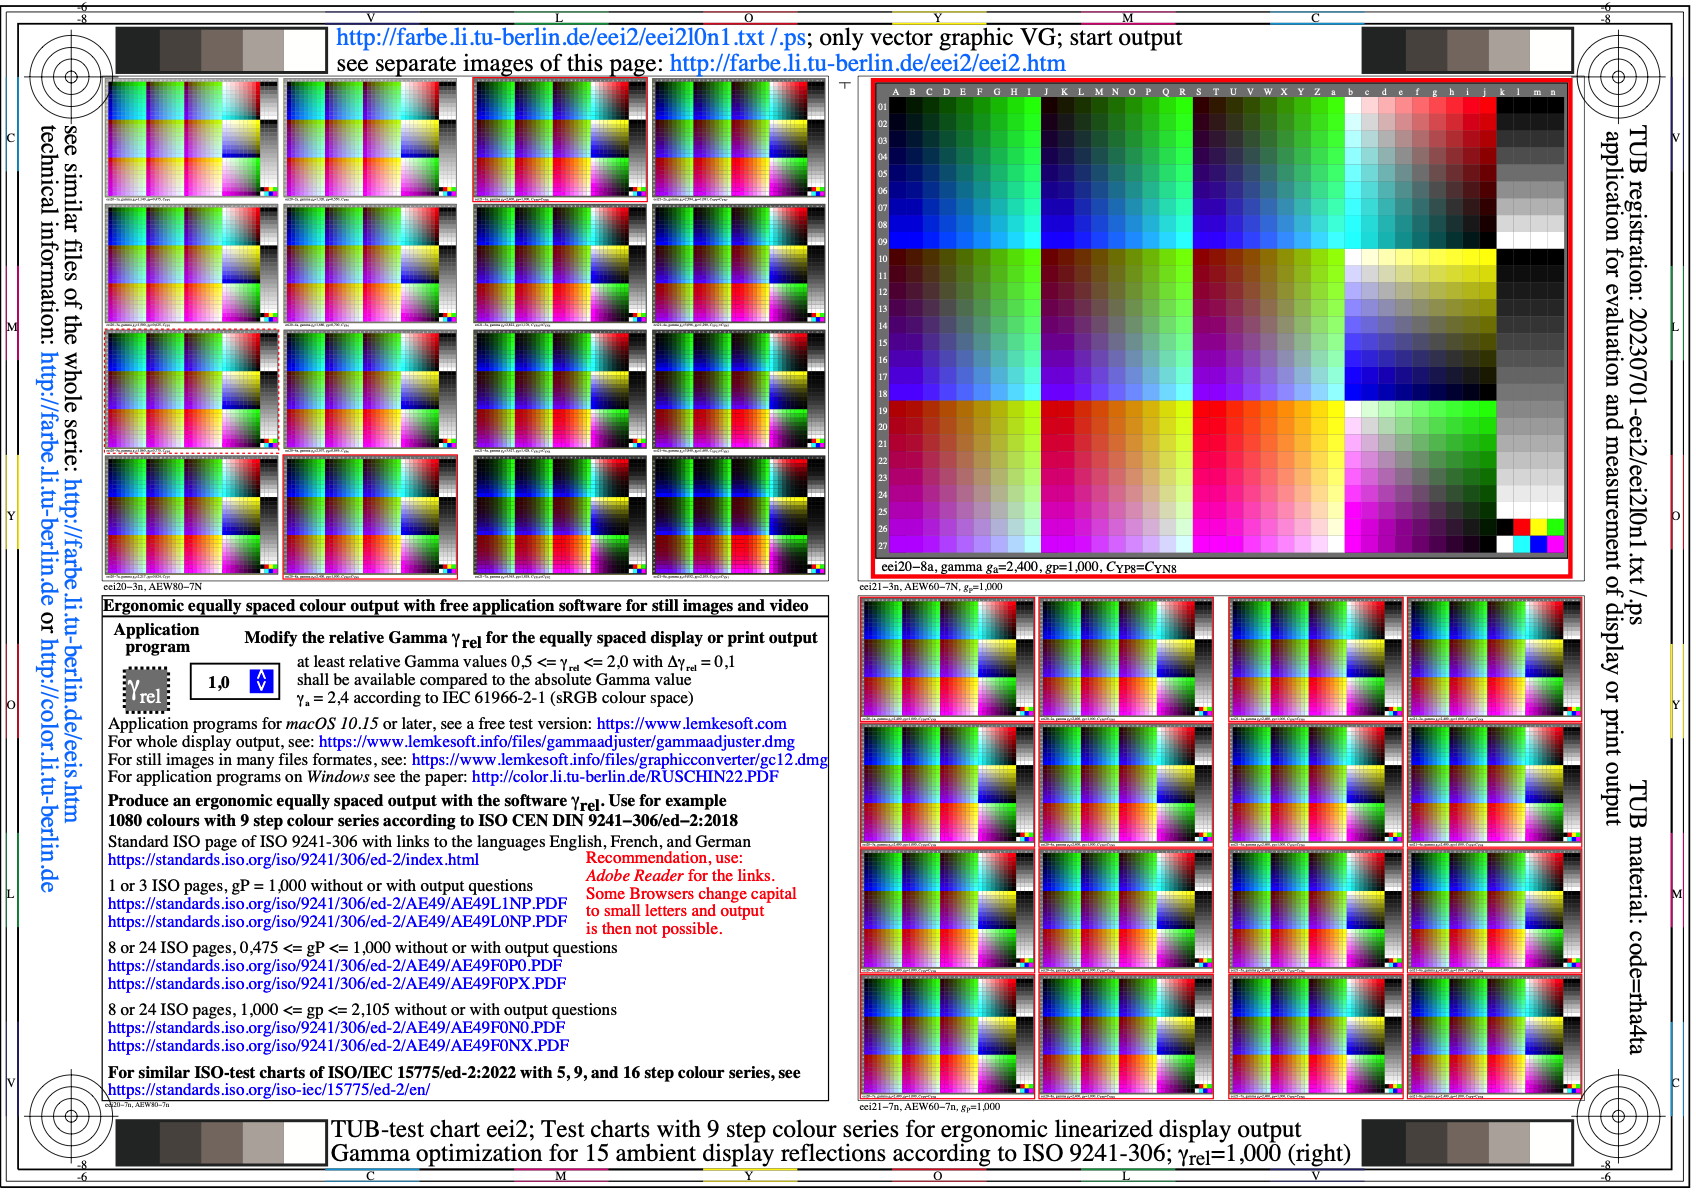
Image eei2l0n1.jpg: Output in format A6 of the file
eei2l0np.pdf, see
eei2l0n1.
PS /
TXT /
PDF /
jpg
eei2: TUB-test chart eei2; 9 step colour series for gamma
optimization for 15 display reflections & contrasts according to
ISO 9241\55306:2018 and ISO/IEC 15775:2022; gamma_rel=1,000
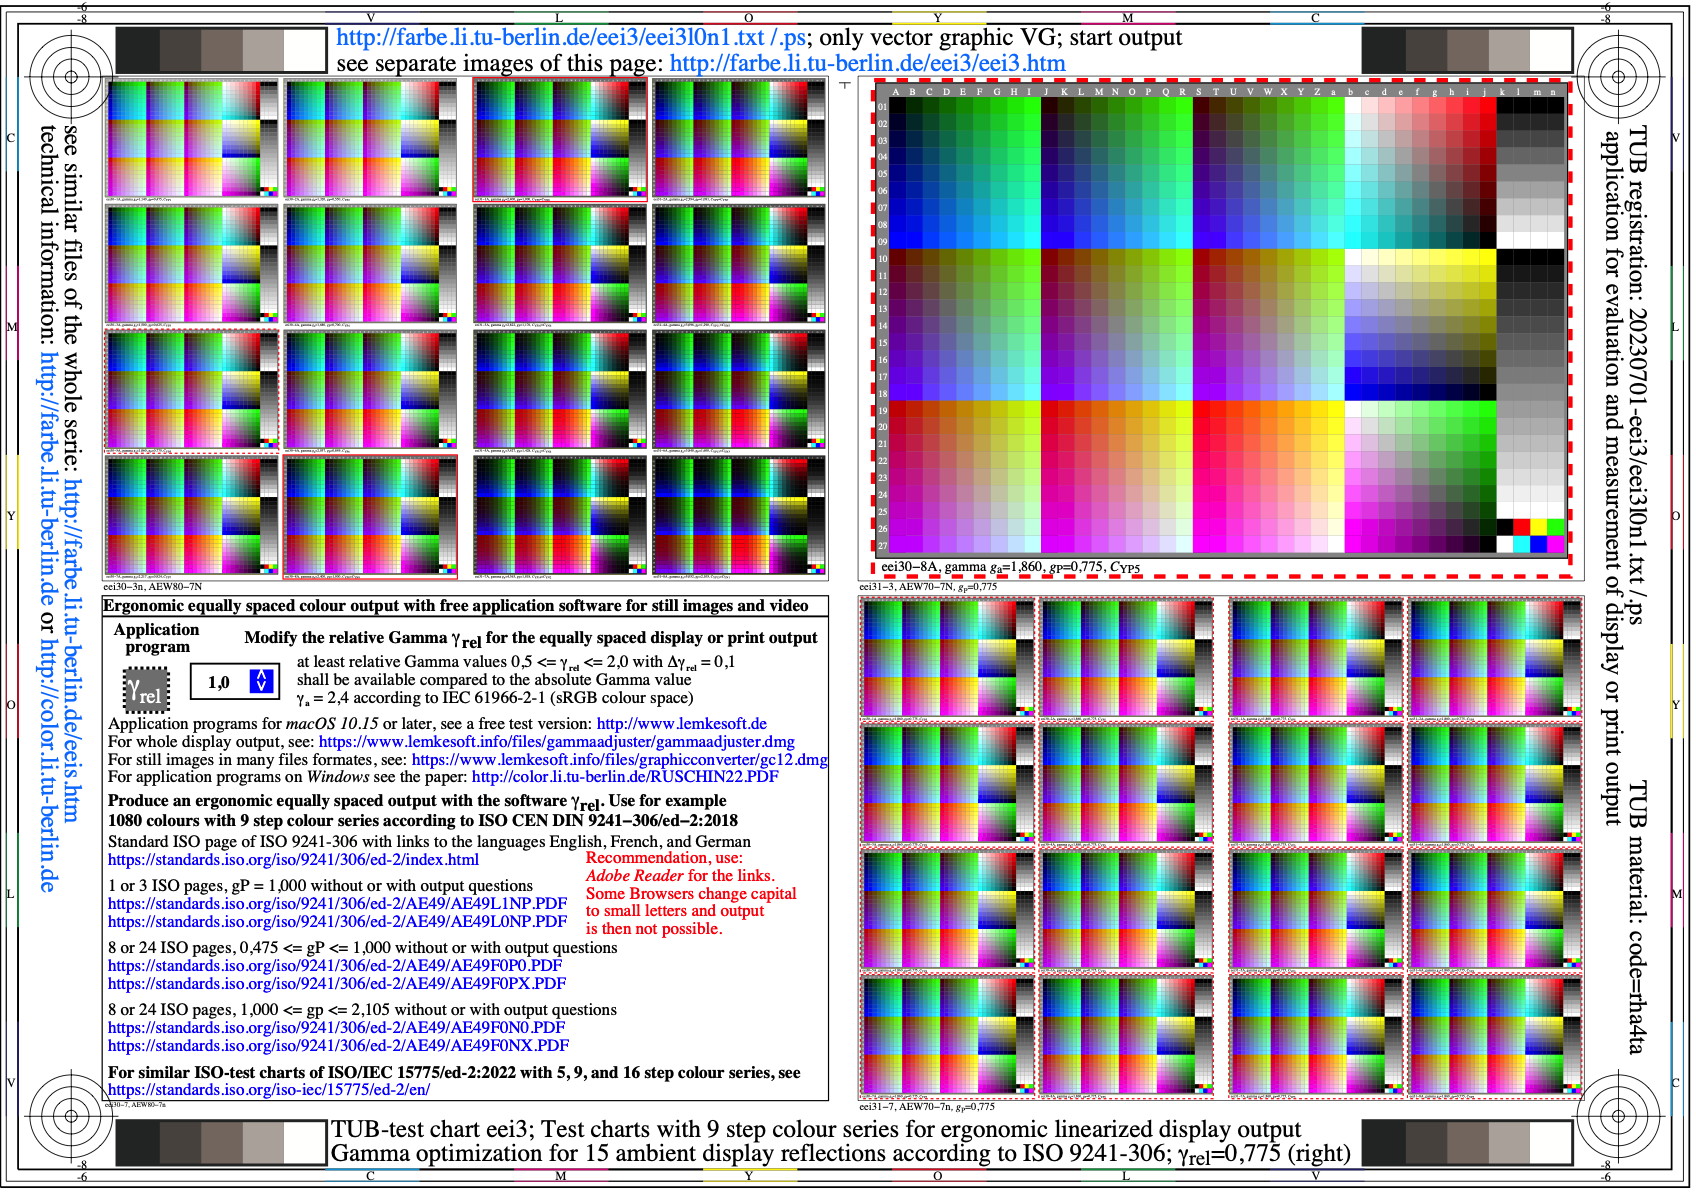
Image eei3l0n1.jpg: Output in format A6 of the file
eei3l0np.pdf, see
eei3l0n1.
PS /
TXT /
PDF /
jpg
eei3: TUB-test chart eei3; 9 step colour series for gamma
optimization for 15 display reflections & contrasts according to
ISO 9241\55306:2018 and ISO/IEC 15775:2022; gamma_rel=0,775
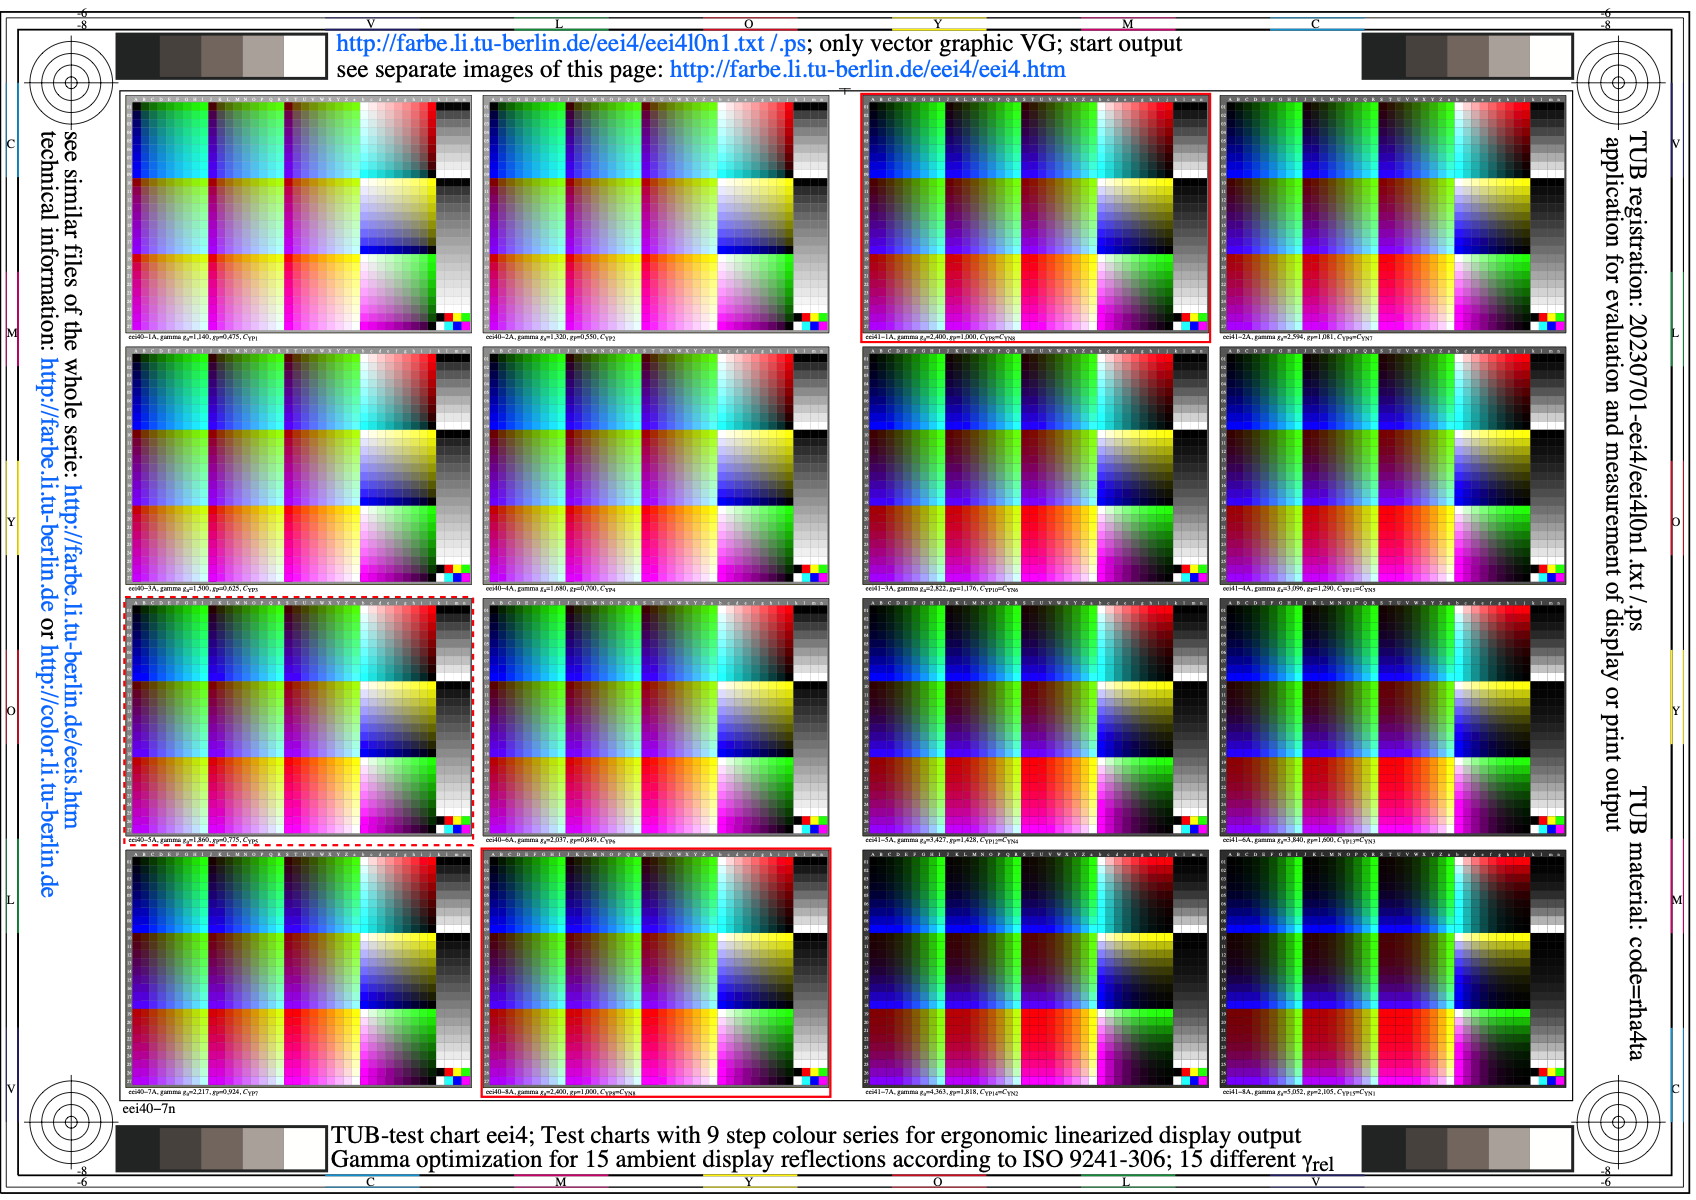
Image eei4l0n1.jpg: Output in format A6 of the file
eei4l0np.pdf, see
eei4l0n1.
PS /
TXT /
PDF /
jpg
eei4: TUB-test chart eei4; 9 step colour series for gamma
optimization for 15 display reflections & contrasts according to
ISO 9241\55306:2018 and ISO/IEC 15775:2022; 15 gamma_rel

Image eei5l0n1.jpg: Output in format A6 of the file
eei5l0np.pdf, see
eei5l0n1.
PS /
TXT /
PDF /
jpg
eei5: TUB-test chart eei5; 9 step colour series for gamma
optimization for 15 display reflections & contrasts according to
ISO 9241\55306:2018 and ISO/IEC 15775:2022; gamma_rel=1,000
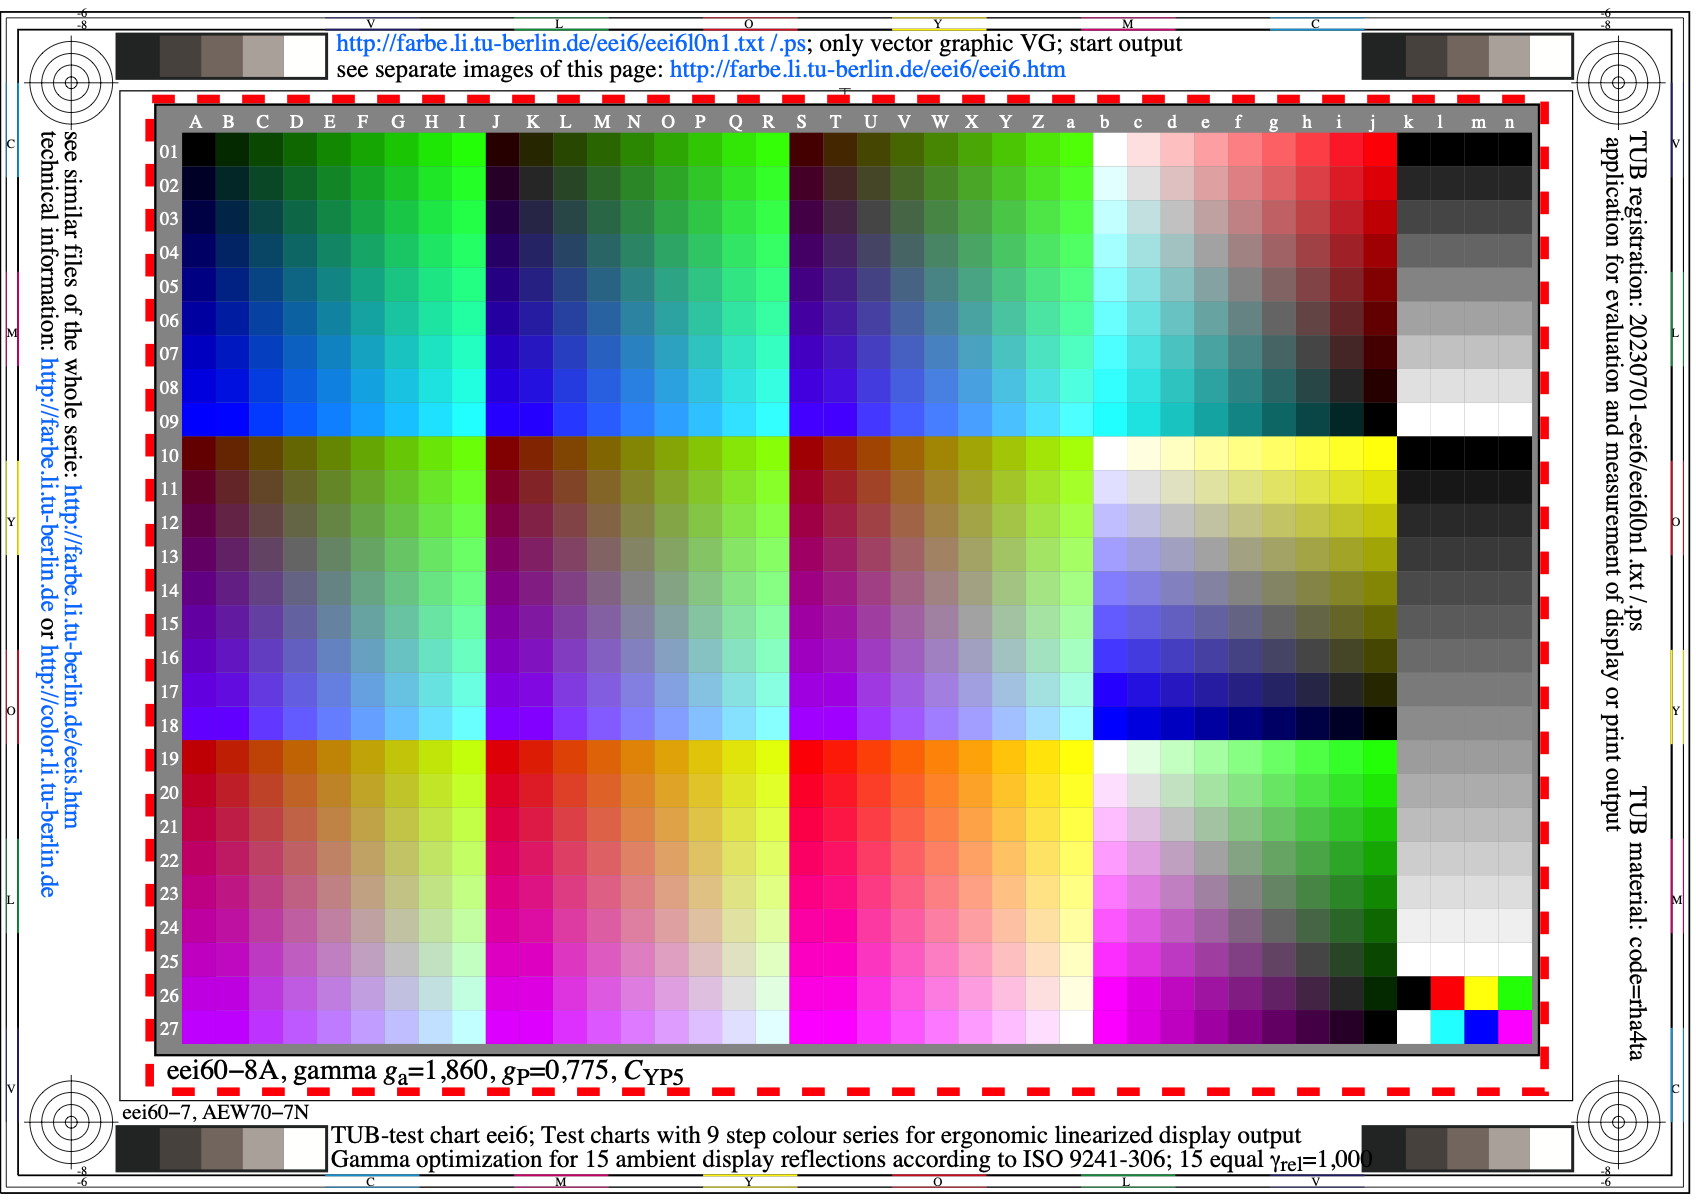
Image eei6l0n1.jpg: Output in format A6 of the file
eei6l0np.pdf, see
eei6l0n1.
PS /
TXT /
PDF /
jpg
eei6: TUB-test chart eei6; 9 step colour series for gamma
optimization for 15 display reflections & contrasts according to
ISO 9241\55306:2018 and ISO/IEC 15775:2022; gamma_rel=0,775
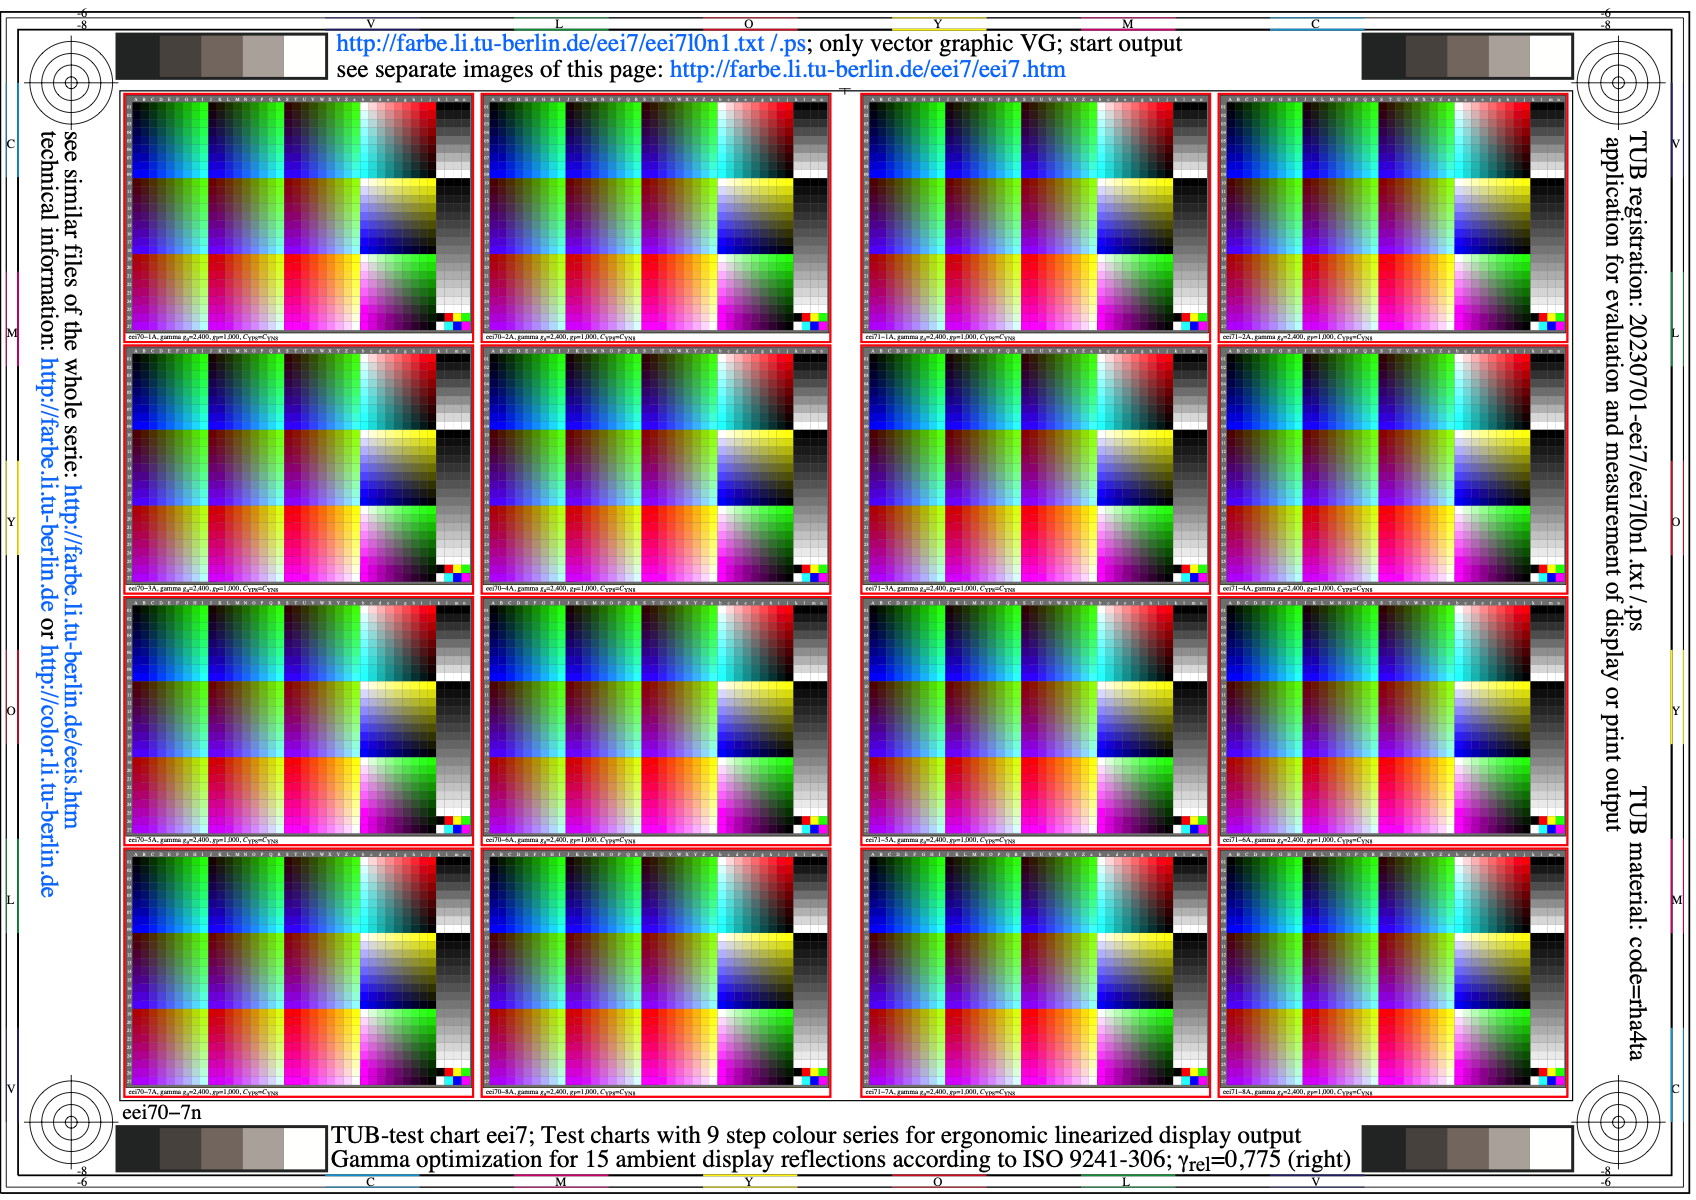
Image eei7l0n1.jpg: Output in format A6 of the file
eei7l0np.pdf, see
eei7l0n1.
PS /
TXT /
PDF /
jpg
eei7: TUB-test chart eei7; 9 step colour series for gamma
optimization for 15 display reflections & contrasts according to
ISO 9241\55306 and ISO/IEC 15775; 15 equal gamma_rel=1,000
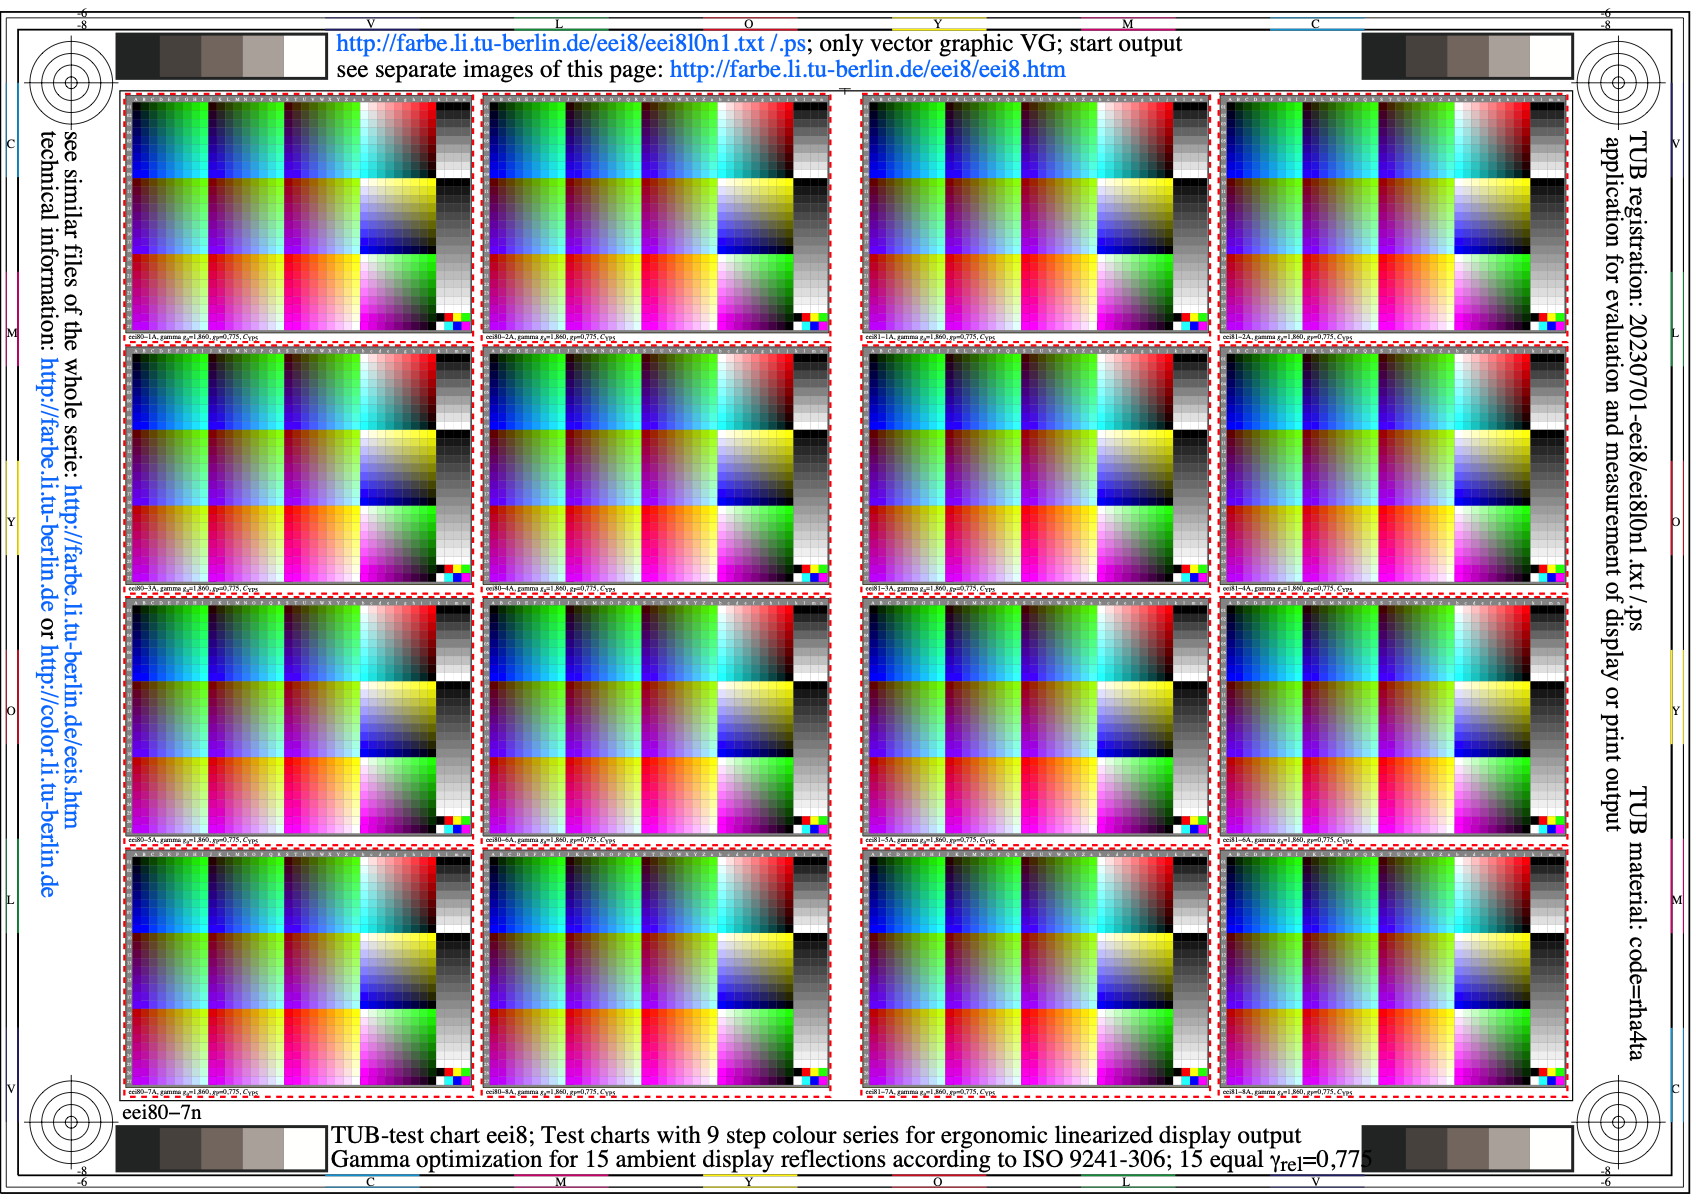
Image eei8l0n1.jpg: Output in format A6 of the file
eei8l0np.pdf, see
eei8l0n1.
PS /
TXT /
PDF /
jpg
eei8: TUB-test chart eei8; 9 step colour series for gamma
optimization for 15 display reflections & contrasts according to
ISO 9241\55306 and ISO/IEC 15775; 15 equal gamma_rel=0,775
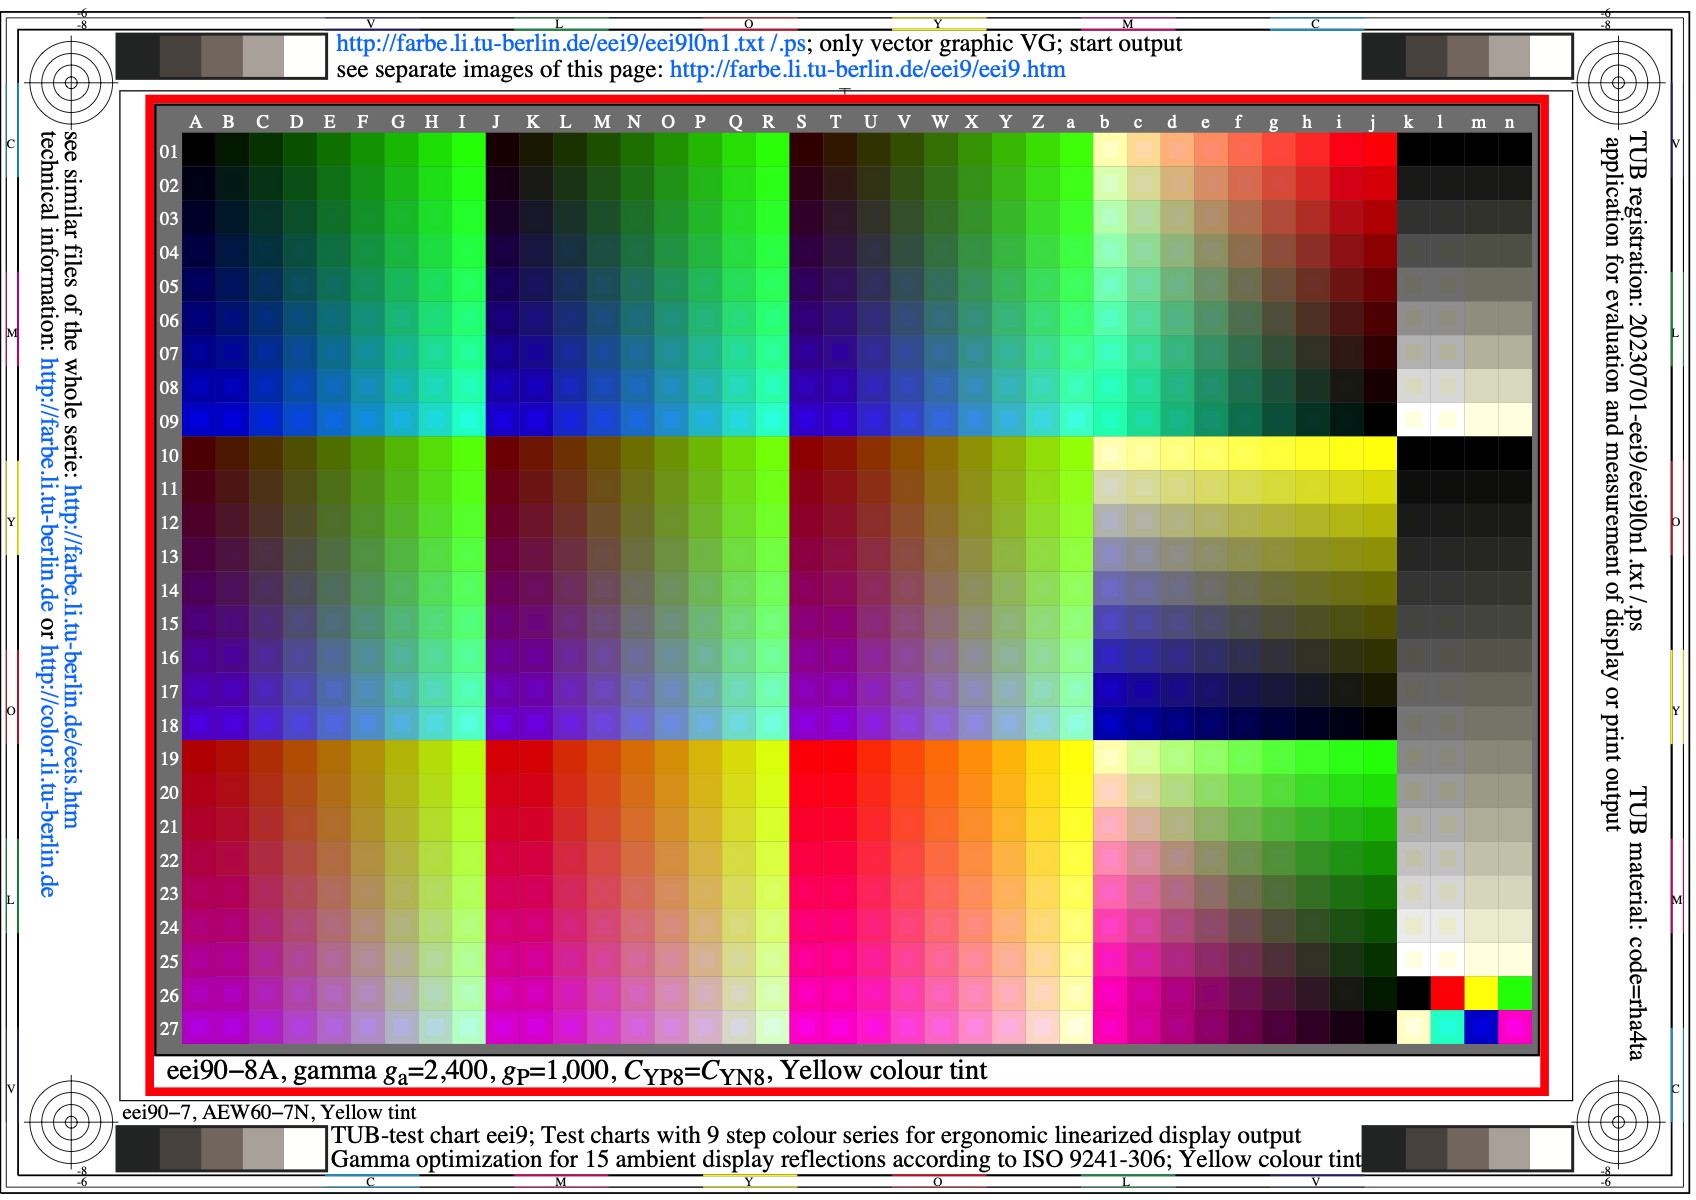
Image eei9l0n1.jpg: Output in format A6 of the file
eei9l0np.pdf, see
eei9l0n1.
PS /
TXT /
PDF /
jpg
eei9: TUB-test chart eei9; 9 step colour series for gamma
optimization for 15 display reflections & contrasts according to
ISO 9241\55306 and ISO/IEC 15775; gamma_rel=1,000, yellow tint
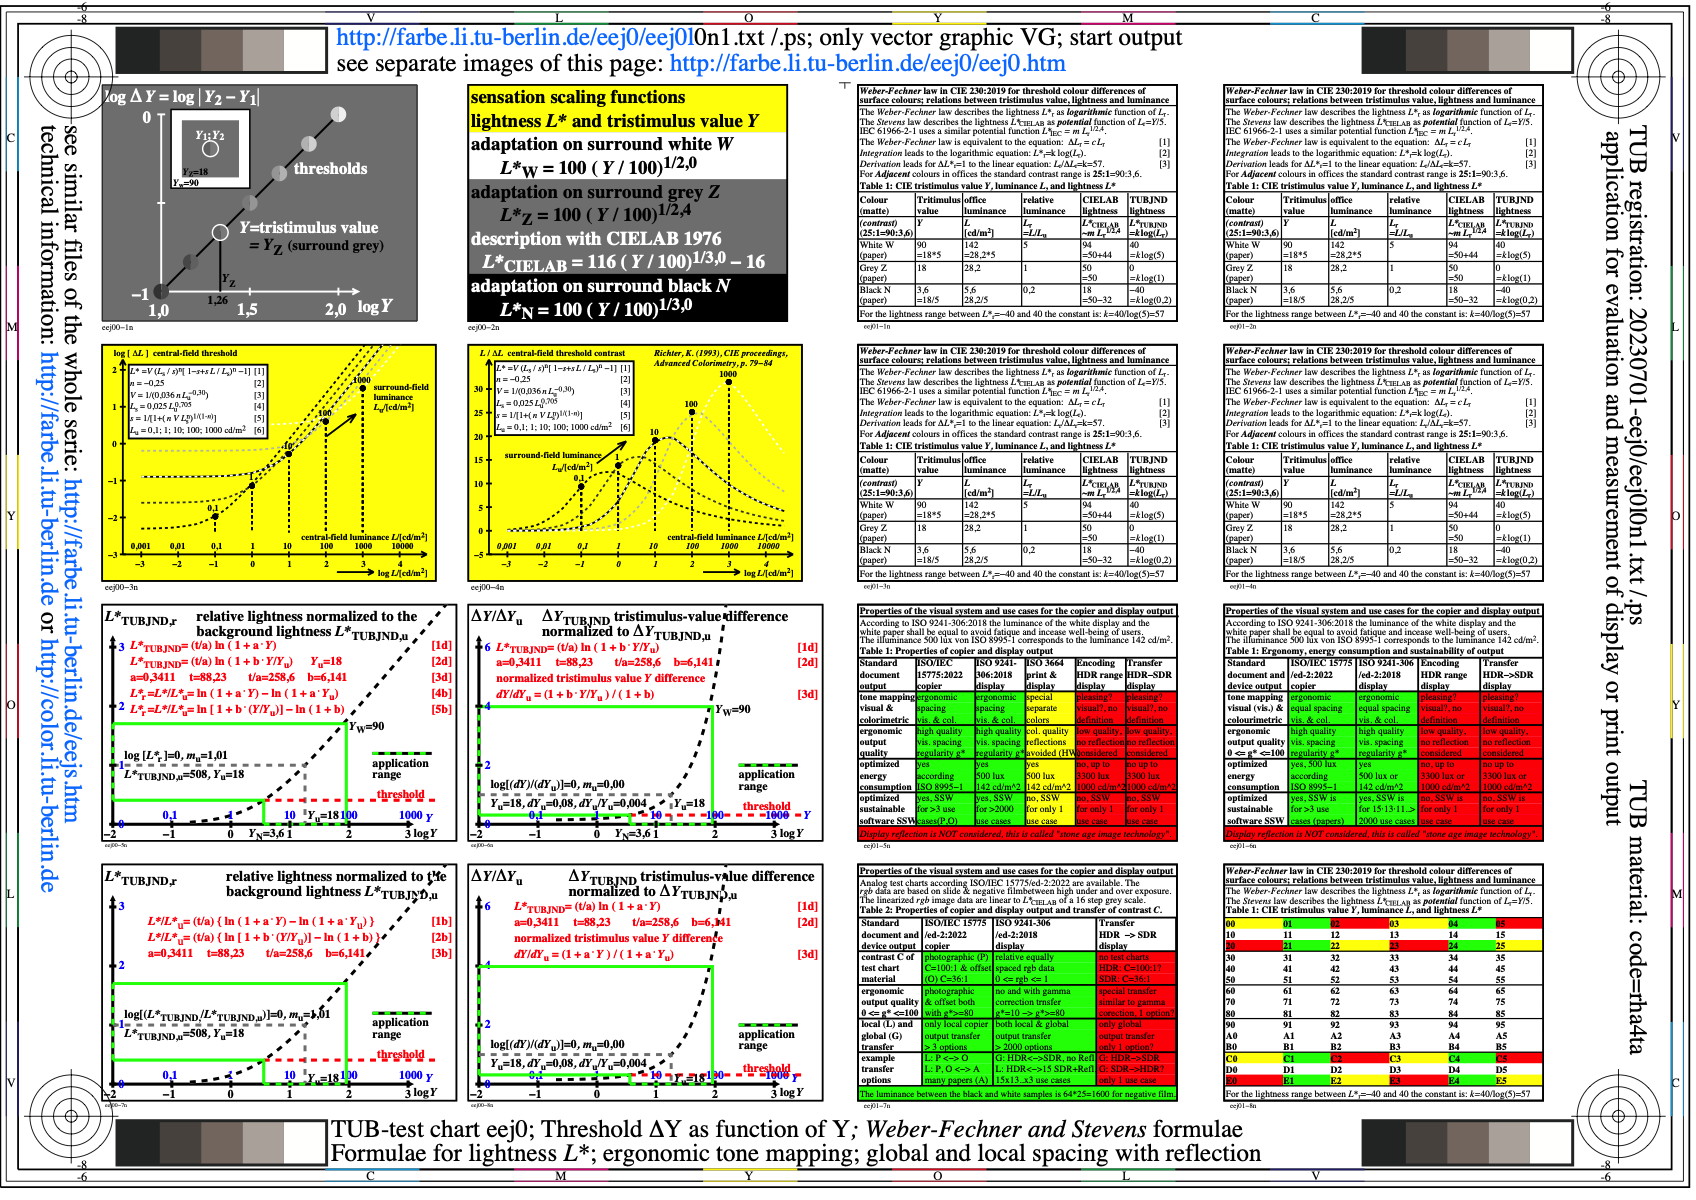
Image eej0l0n1.jpg: Output in format A6 of the file
eej0l0np.pdf, see
eej0l0n1.
PS /
TXT /
PDF /
jpg
eej0: TUB-test chart eej0; Thresholds delta_Y as function of Y
Weber-Fechner and Stevens-formulae for colour differences
HDR and SDR displays, global and local colour management
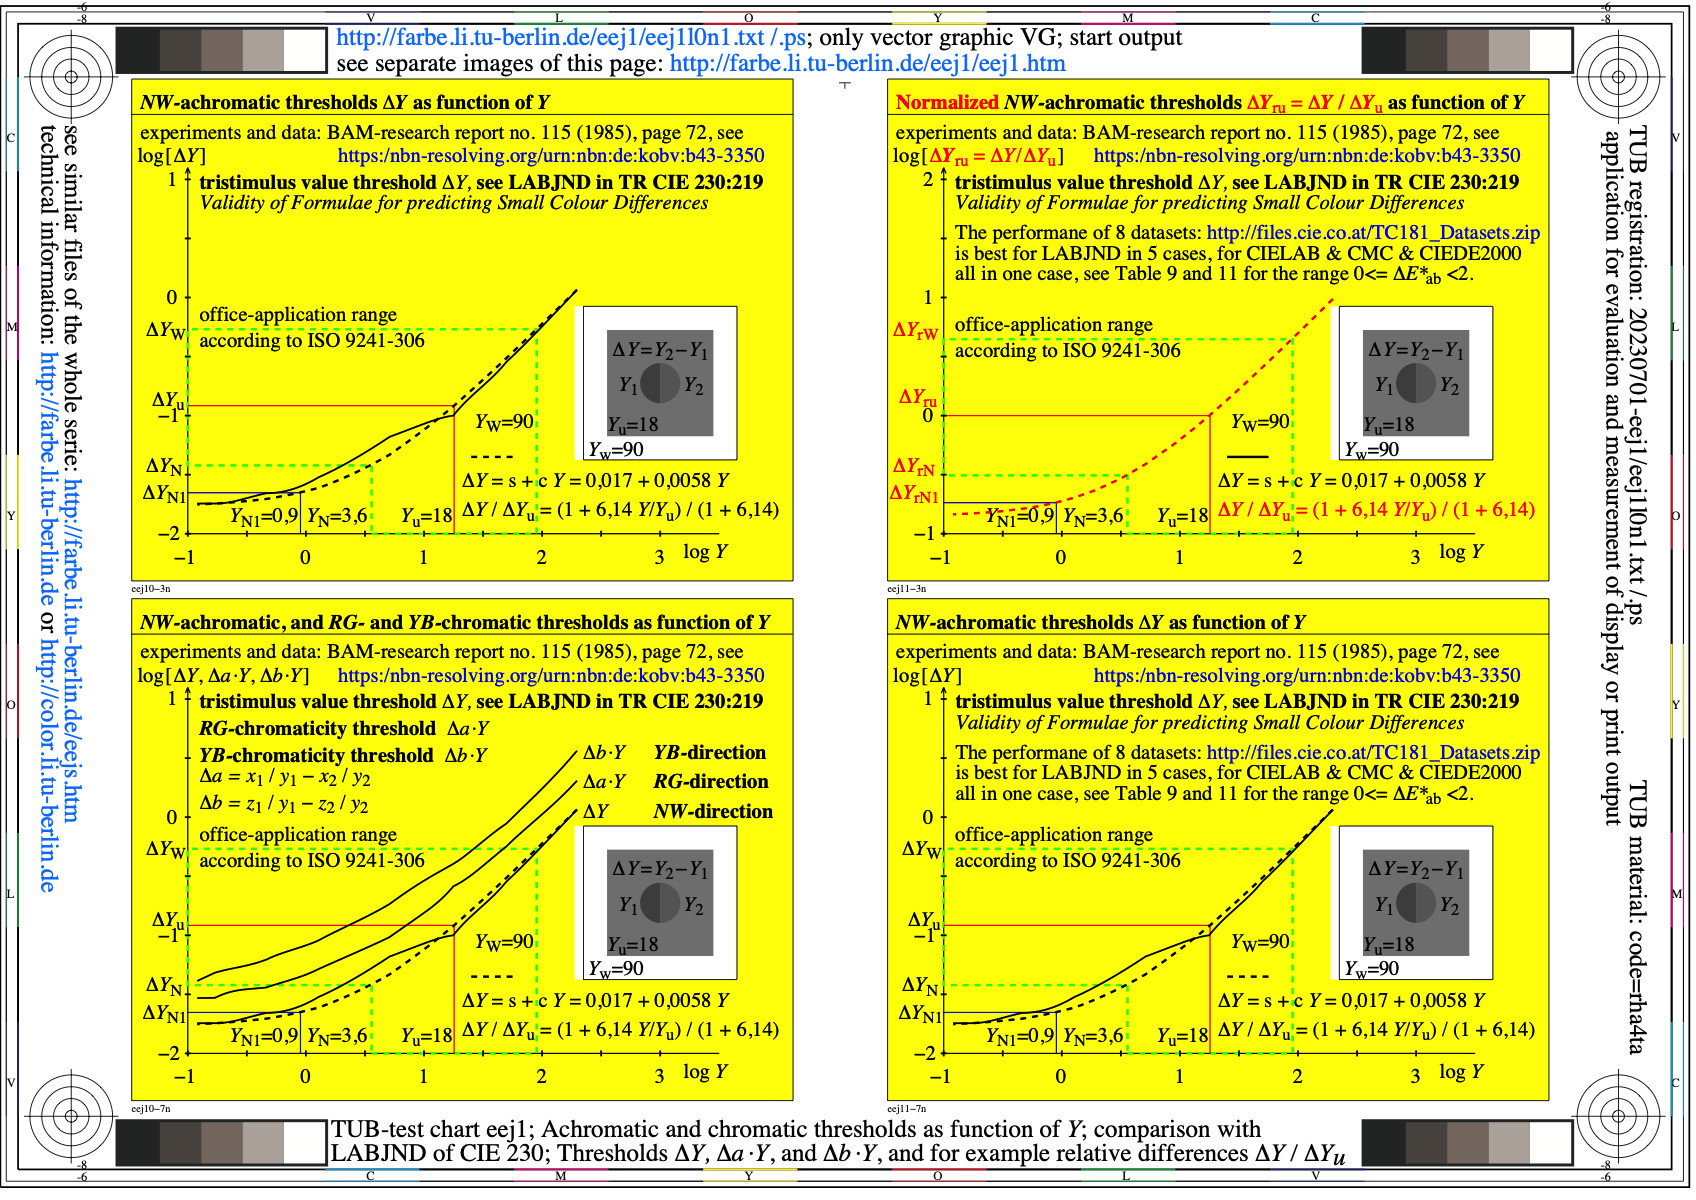
Image eej1l0n1.jpg: Output in format A6 of the file
eej1l0np.pdf, see
eej1l0n1.
PS /
TXT /
PDF /
jpg
eej1: TUB-test chart eej1; Achromatic and chromatic thresholds
Aplication in CIE 230:2019; Threshold delta_Y
and relative differences delta_Y/delta_Yu as function of Y
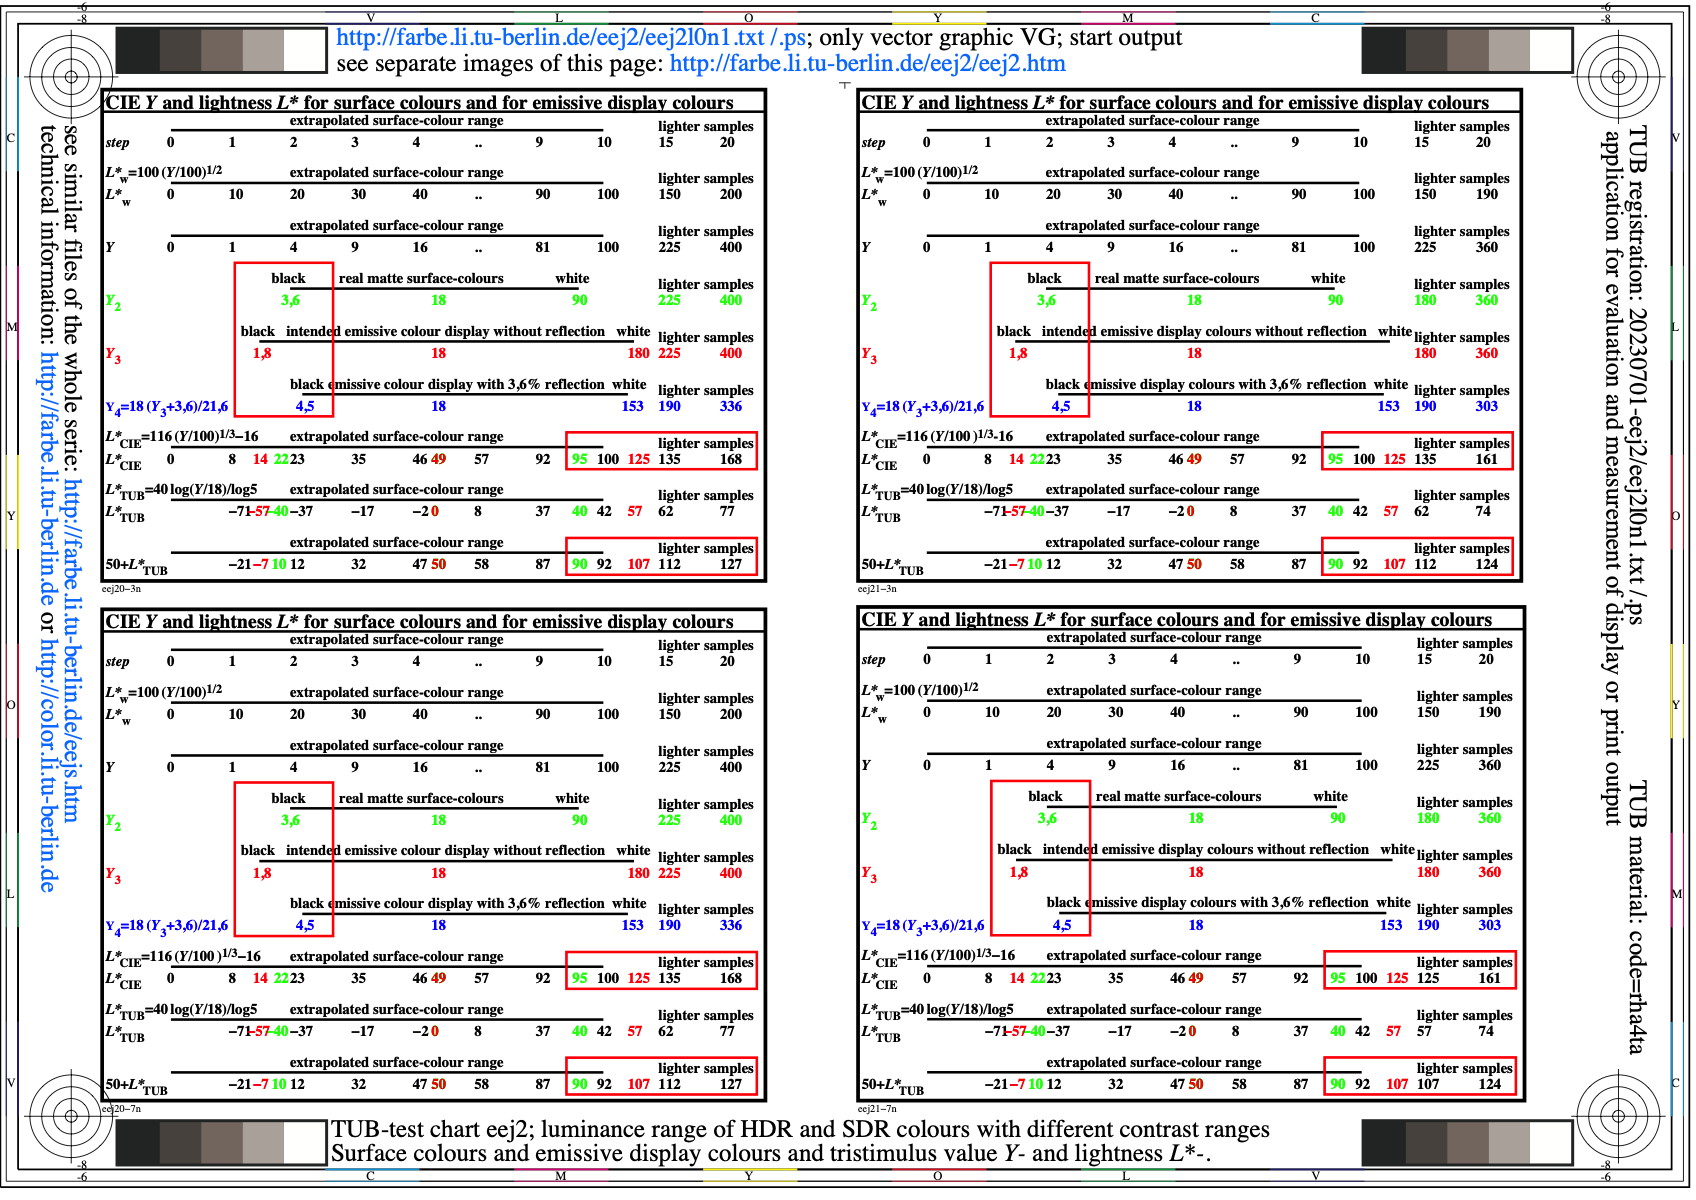
Image eej2l0n1.jpg: Output in format A6 of the file
eej2l0np.pdf, see
eej2l0n1.
PS /
TXT /
PDF /
jpg
eej2: TUB-test chart eej2; luminance range of HDR and SDR displays
TITLJ2B
für Körperfarben und emissive Displays
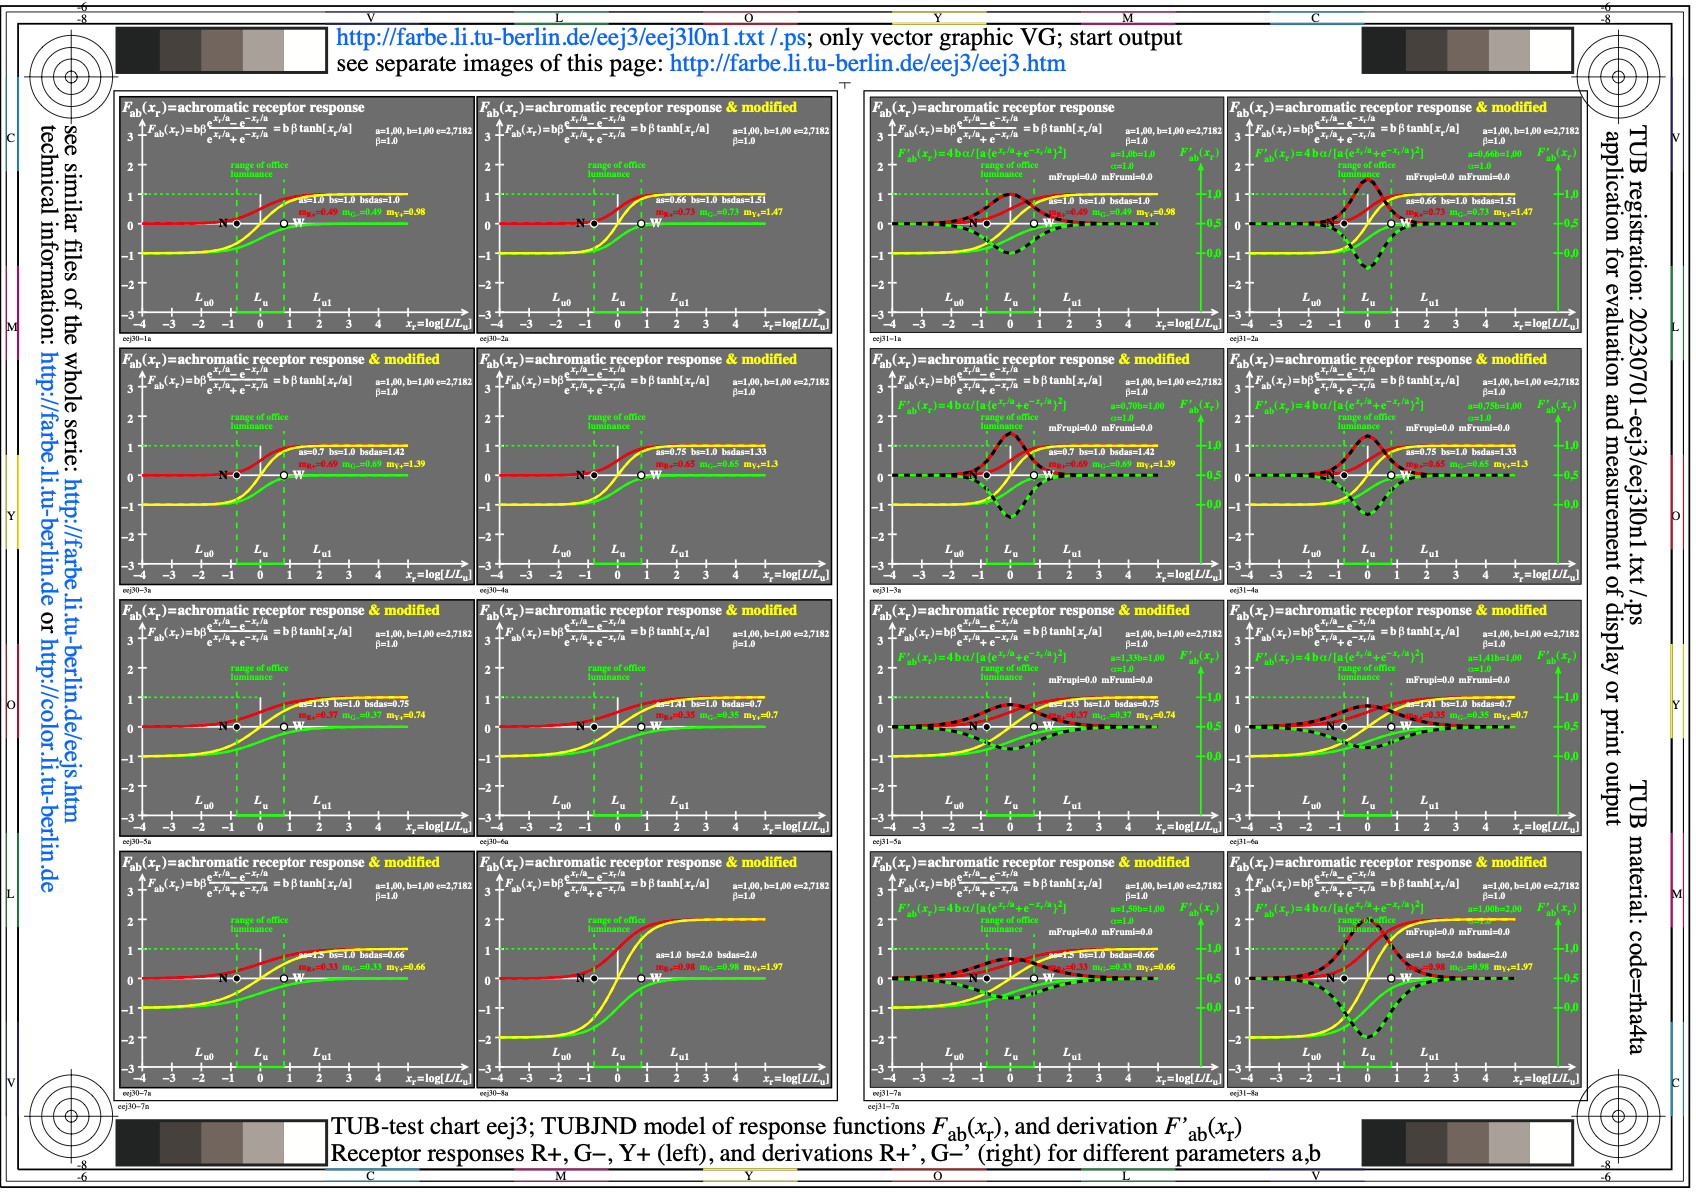
Image eej3l0n1.jpg: Output in format A6 of the file
eej3l0np.pdf, see
eej3l0n1.
PS /
TXT /
PDF /
jpg
eej3: TUB-test chart eej3; TUBJND model with functions Fab, F'ab
Receptor responses R+, G-, Y+ (left & right), and derivations
R+', G-' (right) for diferent parameters a,b
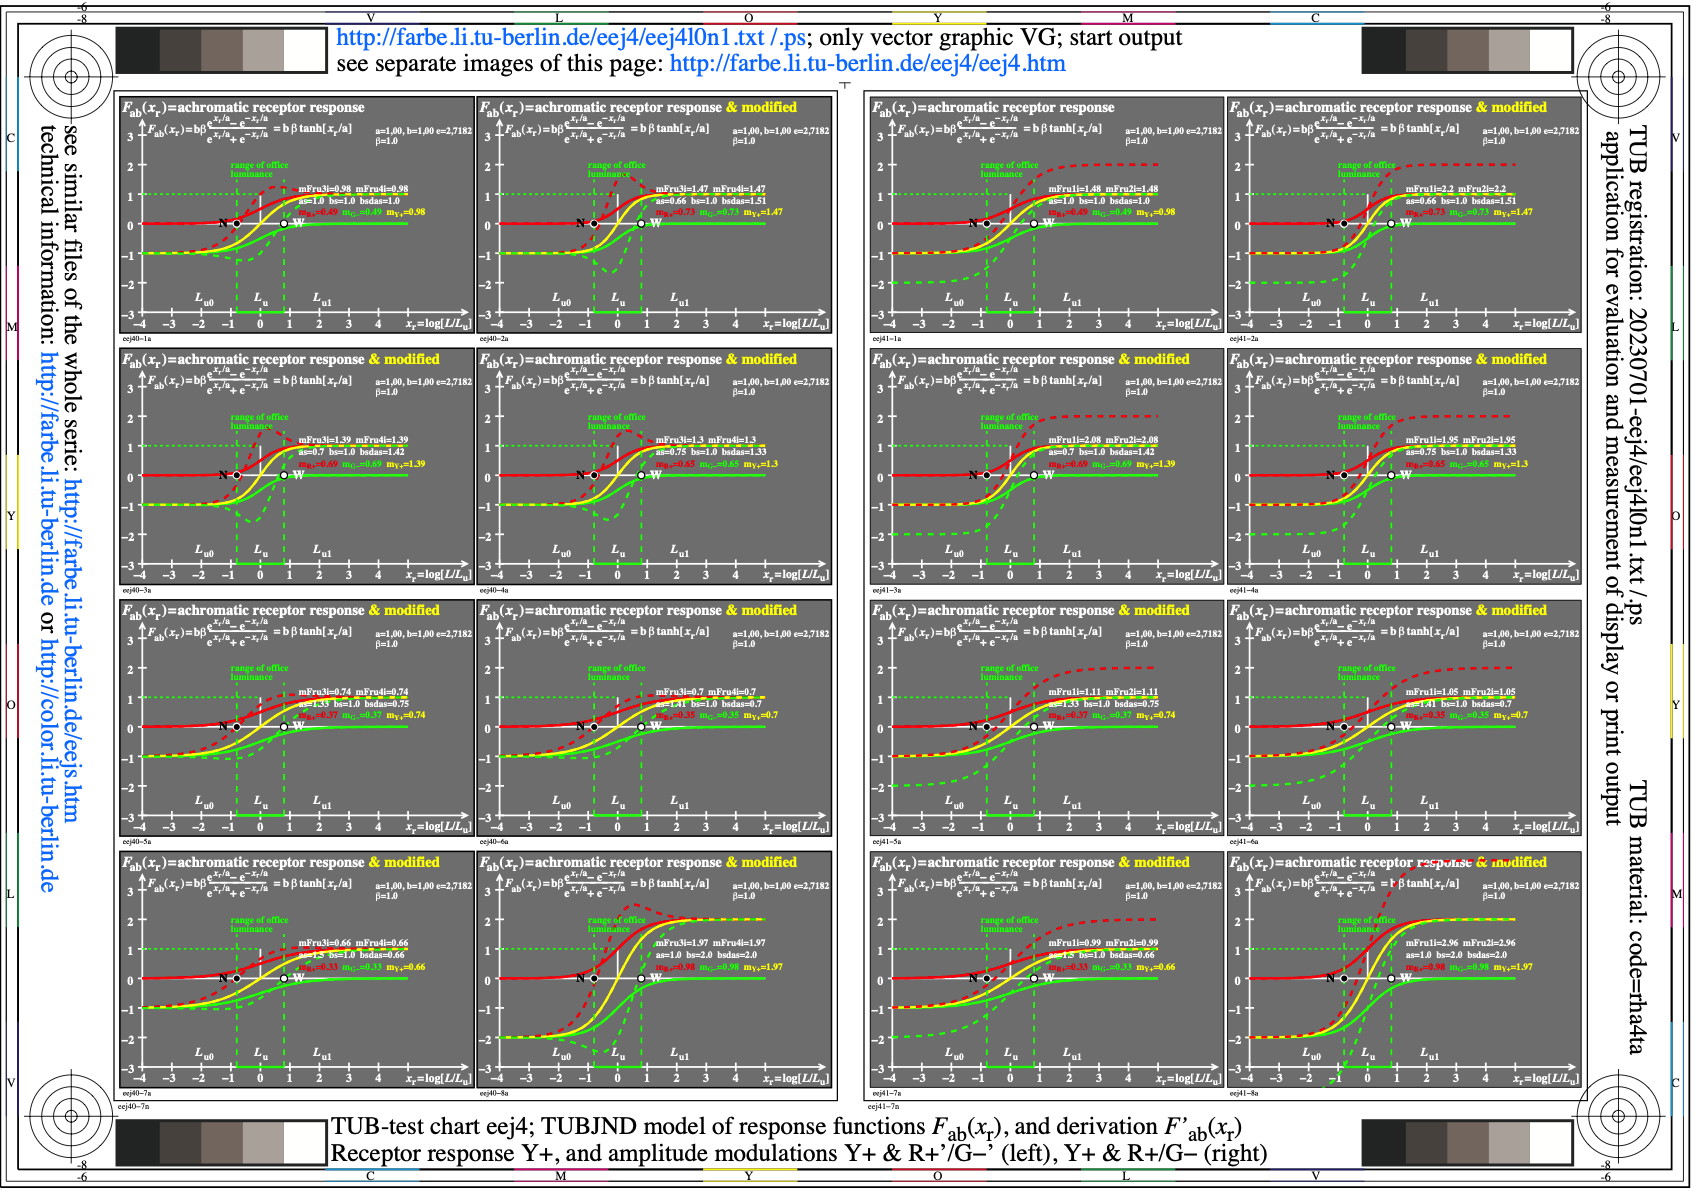
Image eej4l0n1.jpg: Output in format A6 of the file
eej4l0np.pdf, see
eej4l0n1.
PS /
TXT /
PDF /
jpg
eej4: TUB-test chart eej4; TUBJND model with functions Fab, F'ab
Receptor responses R+, G-, Y+ (left & right) and amplitude
modulations Y+ & R+'/G-' (left), Y+ & R+/G- (right) for a,b
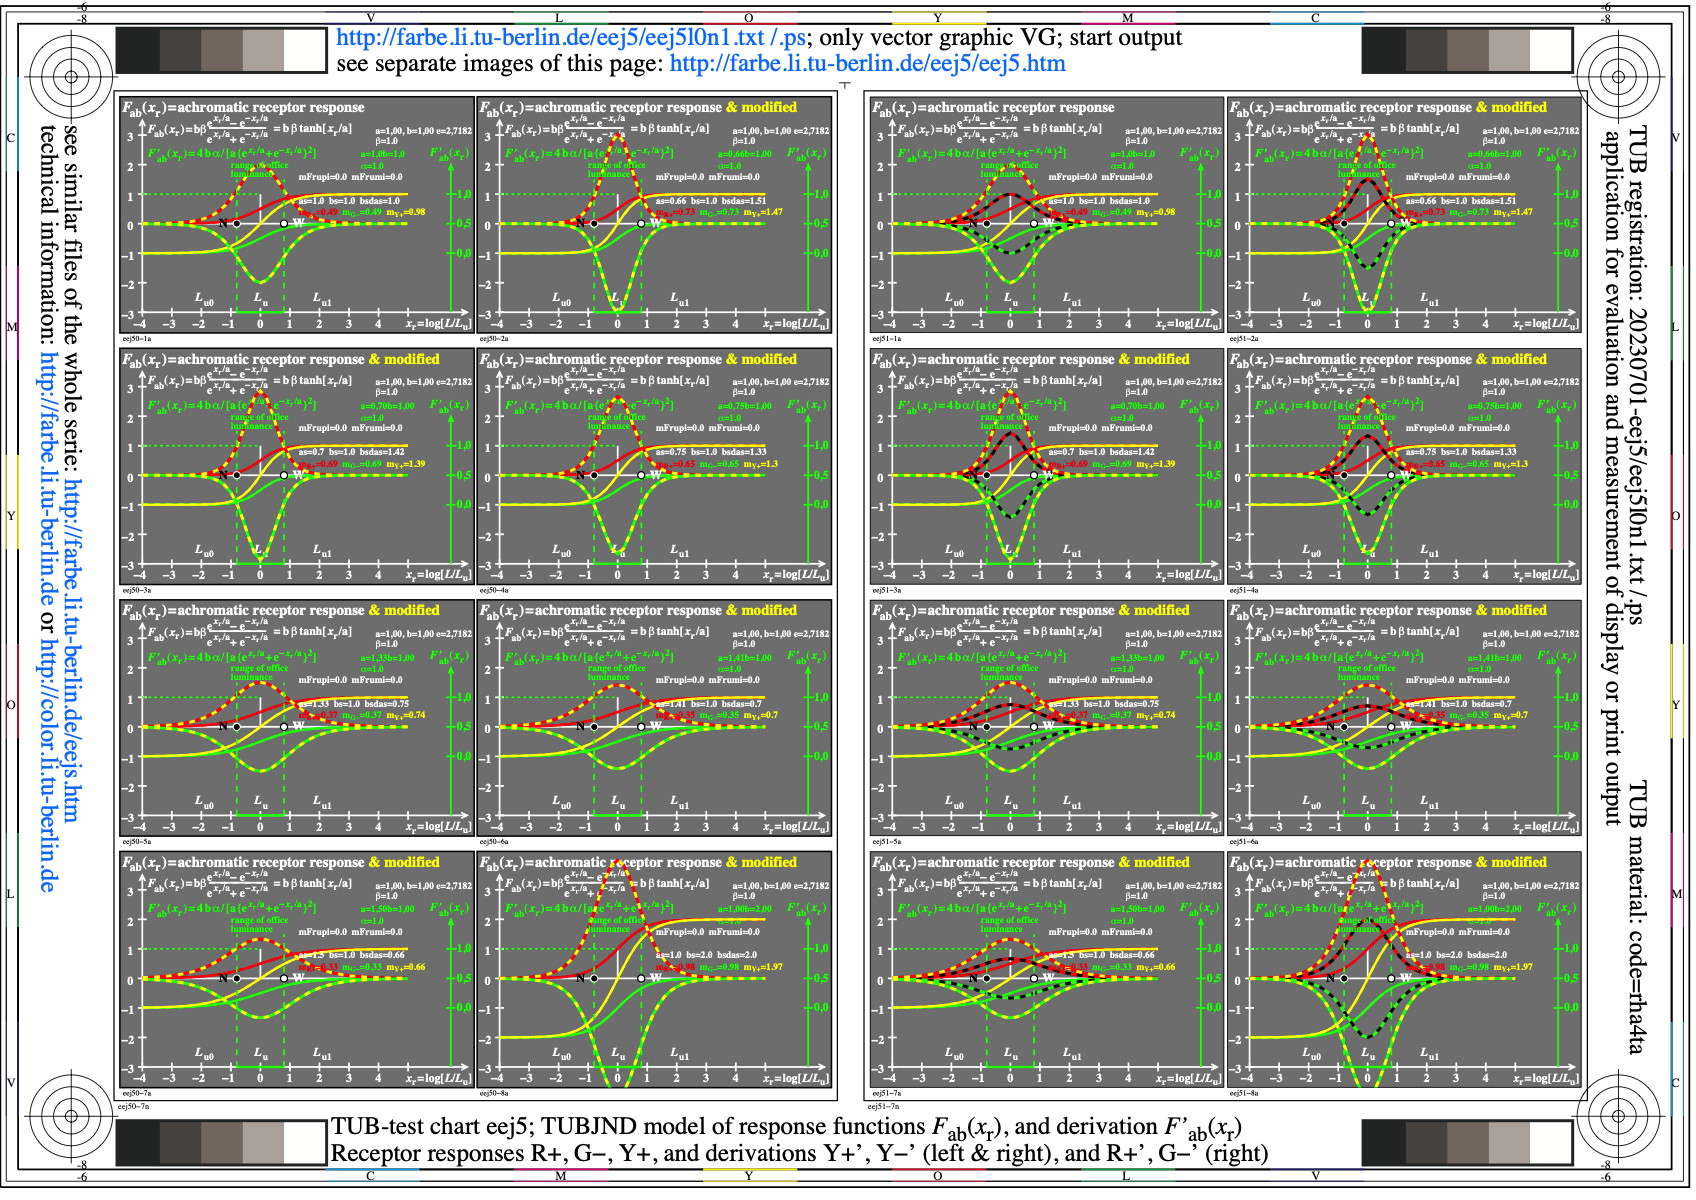
Image eej5l0n1.jpg: Output in format A6 of the file
eej5l0np.pdf, see
eej5l0n1.
PS /
TXT /
PDF /
jpg
eej5: TUB-test chart eej5; TUBJND model with functions Fab, F'ab
Receptor responses R+, G-, Y+ (left & right), and derivations
Y+', Y-' (left & right), and R+'/G-' (right) for a,b
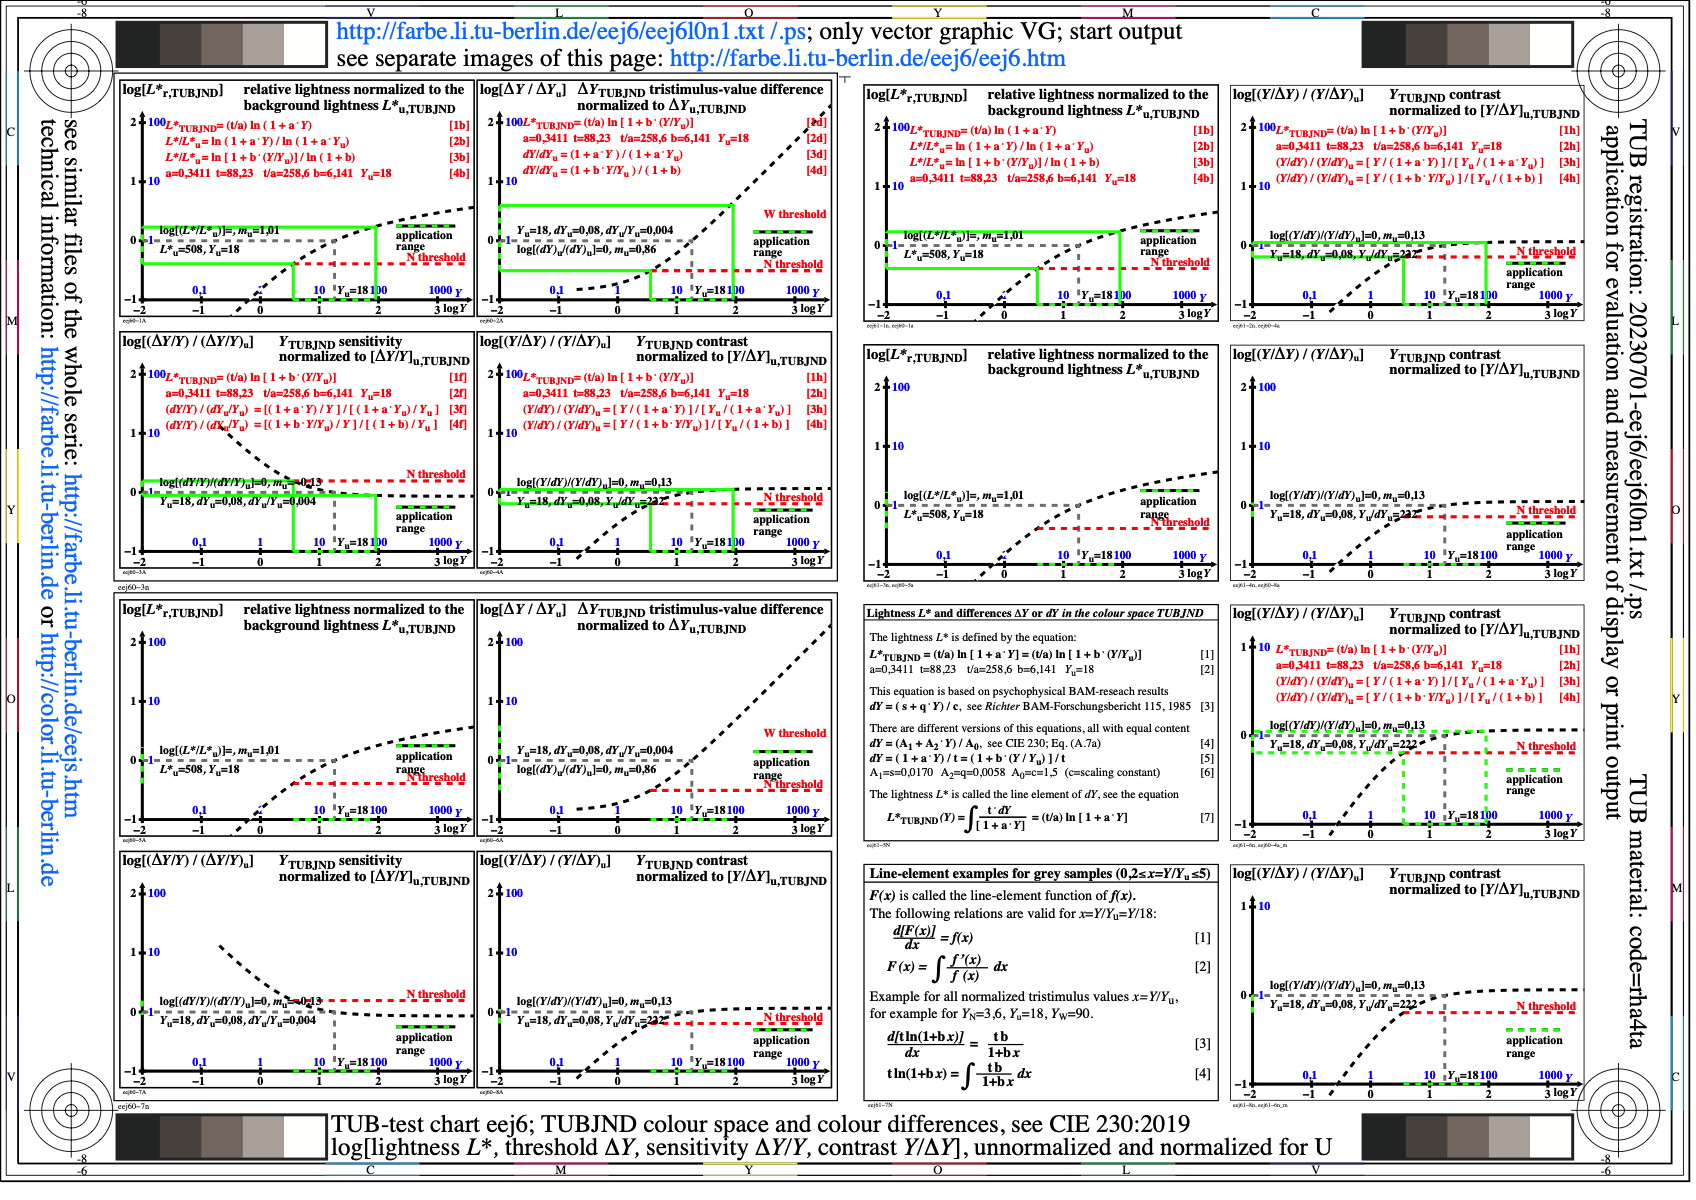
Image eej6l0n1.jpg: Output in format A6 of the file
eej6l0np.pdf, see
eej6l0n1.
PS /
TXT /
PDF /
jpg
eej6: TUB-test chart eej6; TUBJNDr-colour space & differences
log[lightness L*, threshold delta Y, sensitivity
(delta Y)/Y & contrast Y/(delta Y)]=f[log(Y)]
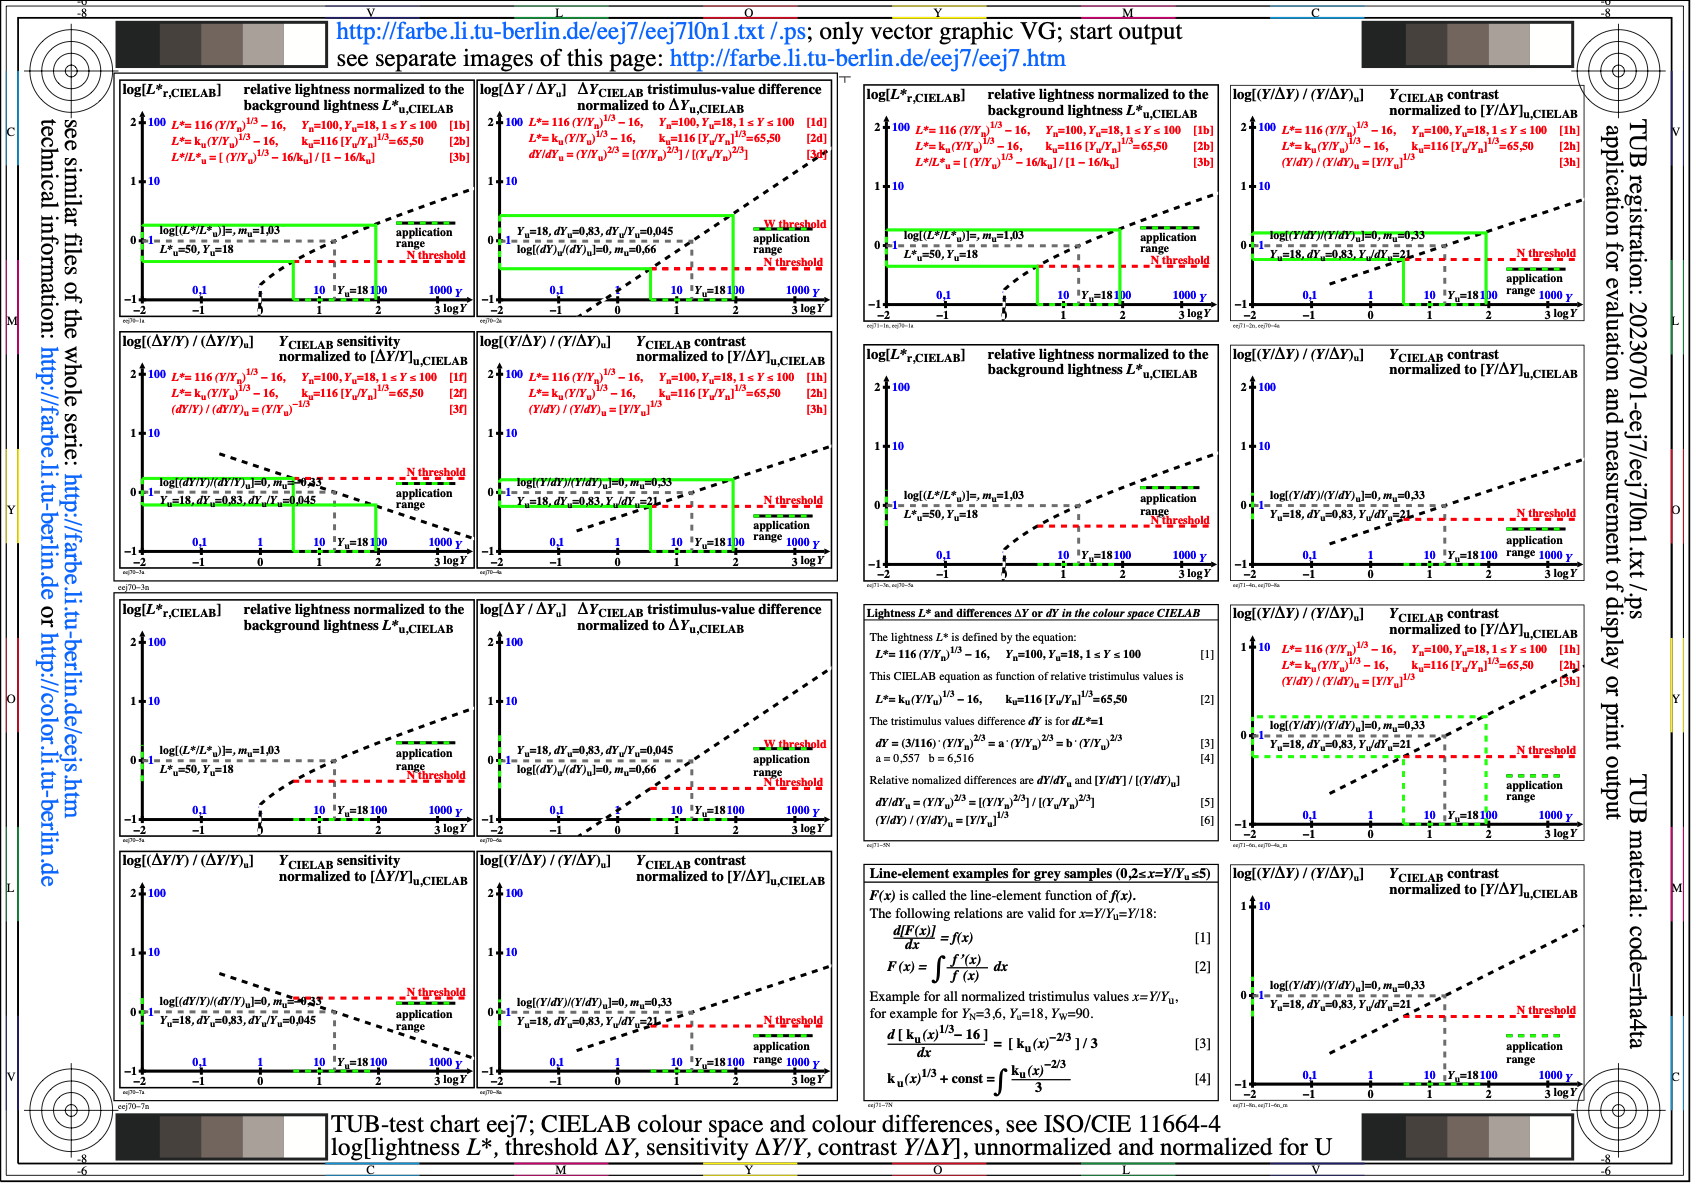
Image eej7l0n1.jpg: Output in format A6 of the file
eej7l0np.pdf, see
eej7l0n1.
PS /
TXT /
PDF /
jpg
eej7: TUB-test chart eej7; CIELABr-colour space & differences
log[lightness L*, threshold delta Y, sensitivity
(delta Y)/Y & contrast Y/(delta Y)]=f[log(Y)]
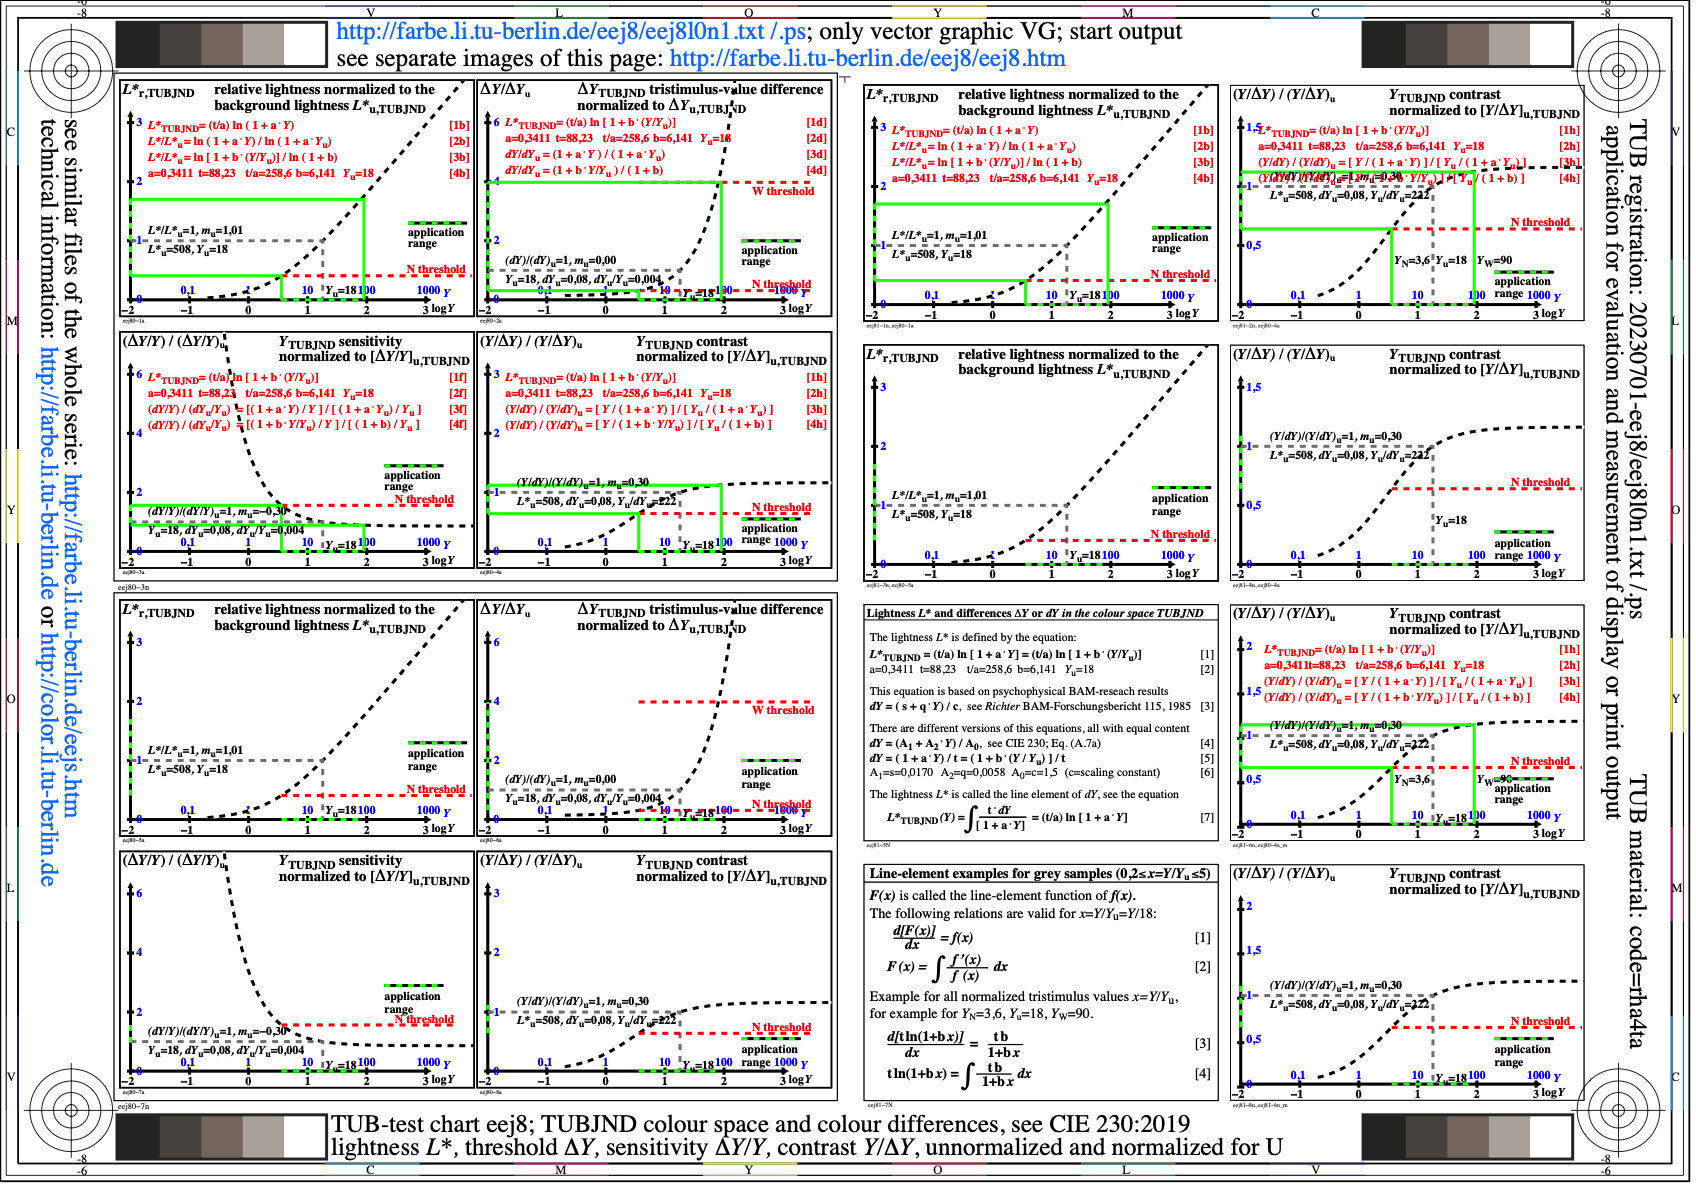
Image eej8l0n1.jpg: Output in format A6 of the file
eej8l0np.pdf, see
eej8l0n1.
PS /
TXT /
PDF /
jpg
eej8: TUB-test chart eej8; TUBJNDr-colour space & differences
lightness L*, threshold delta Y, sensitivity
(delta Y)/Y & contrast Y/(delta Y)=f[log(Y)]
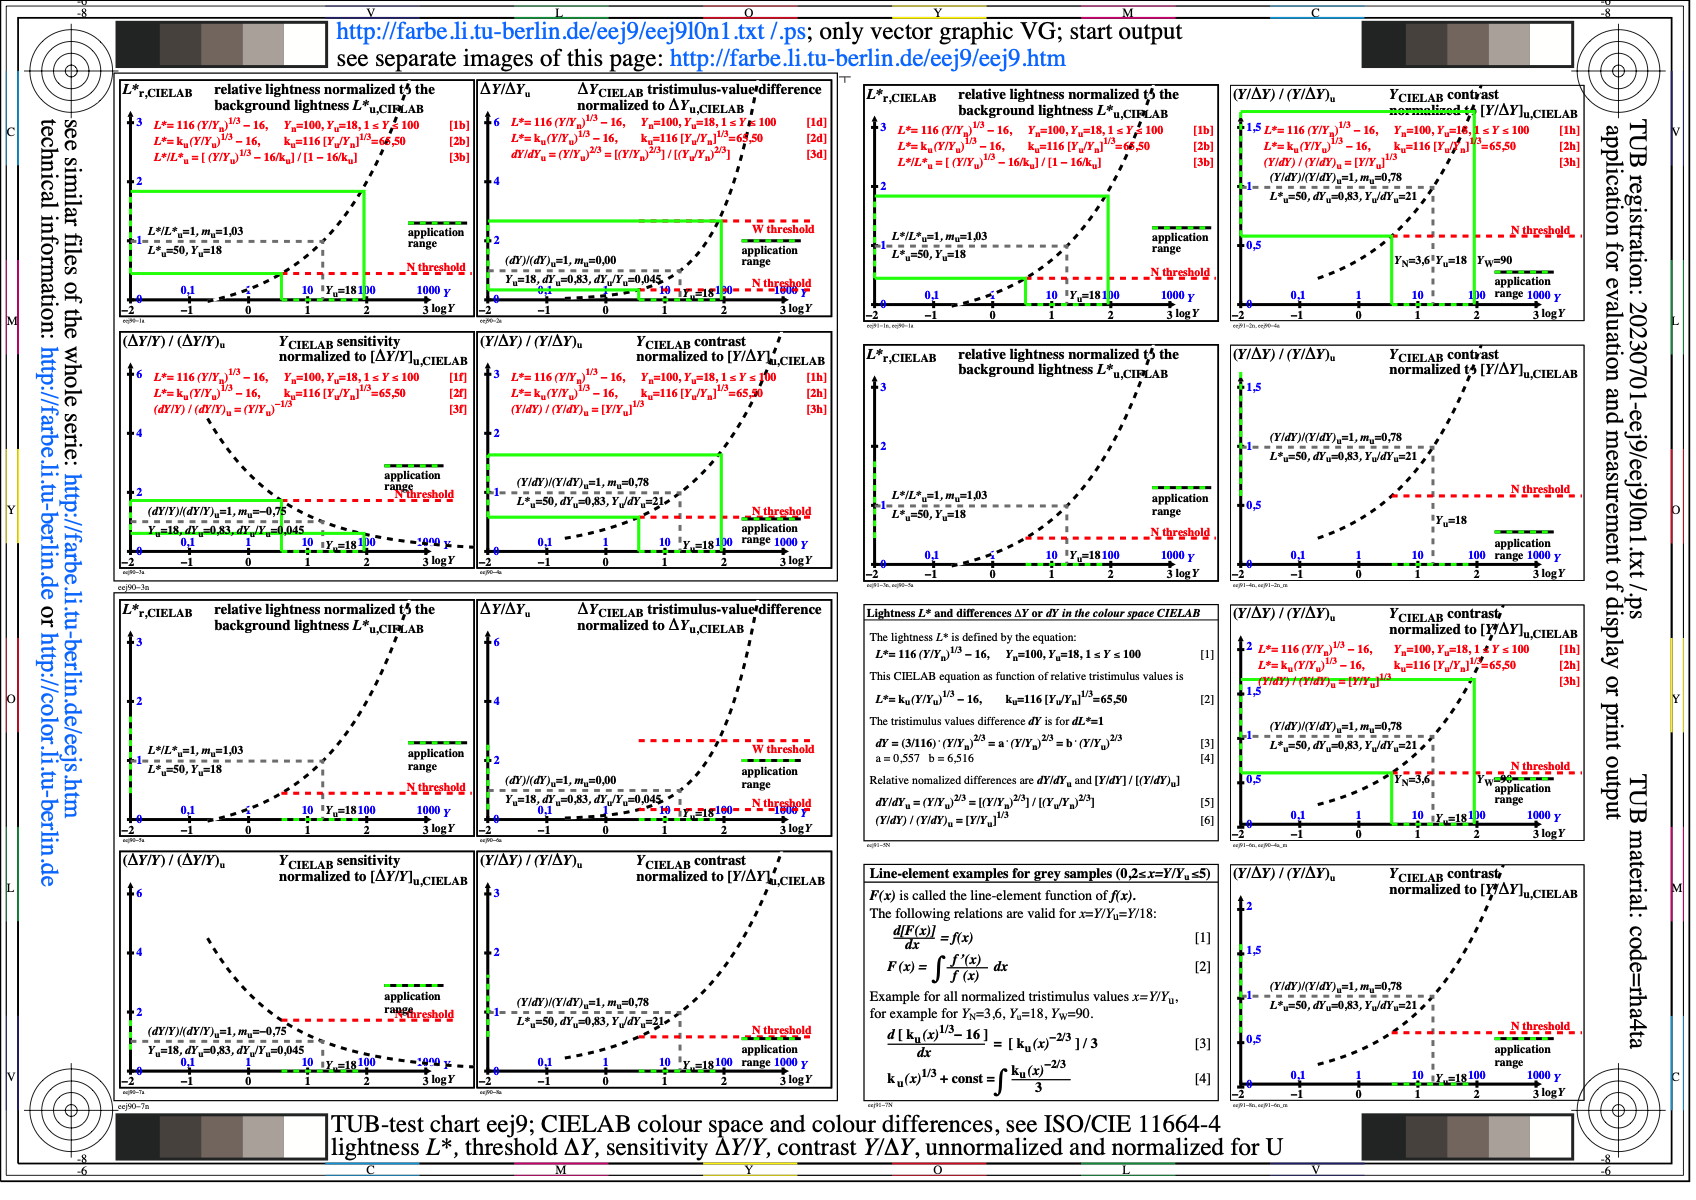
Image eej9l0n1.jpg: Output in format A6 of the file
eej9l0np.pdf, see
eej9l0n1.
PS /
TXT /
PDF /
jpg
eej9: TUB-test chart eej9; CIELABr-colour space & differences
lightness L*, threshold delta Y, sensitivity
(delta Y)/Y & contrast Y/(delta Y)=f[log(Y)]

Image eek0l0n1.jpg: Output in format A6 of the file
eek0l0np.pdf, see
eek0l0n1.
PS /
TXT /
PDF /
jpg
eek0: TUB-test chart eek0; CIELAB spaced 9 step grey scales
for four display reflections Yref=3,6, 0,9, 1,8, 90
L*N=22,3 or YN=3,6 and L*W=96 or YW=90, normalisation: white W
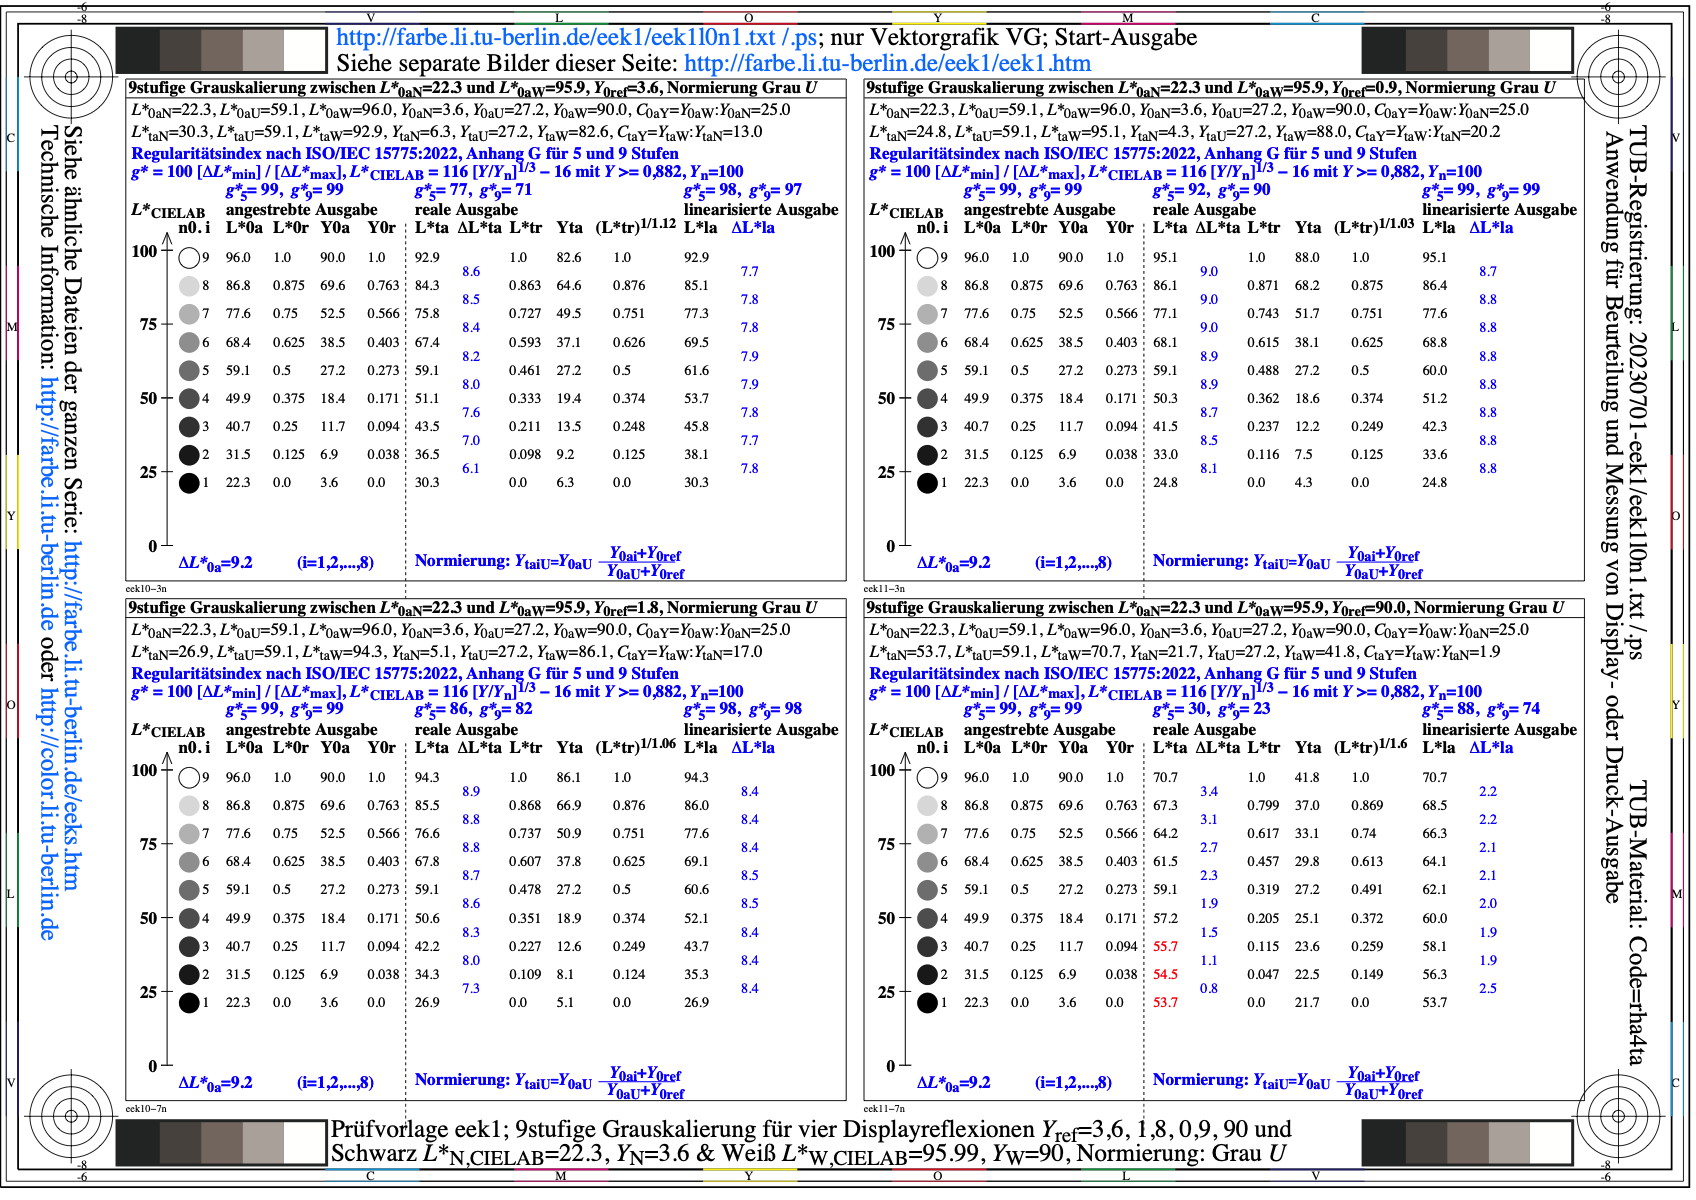
Image eek1l0n1.jpg: Output in format A6 of the file
eek1l0np.pdf, see
eek1l0n1.
PS /
TXT /
PDF /
jpg
eek1: TUB-test chart eek1; CIELAB spaced 9 step grey scales
for four display reflections Yref=3,6, 0,9, 1,8, 90
L*N=22,3 or YN=3,6 and L*W=96 or YW=90, normalisation: grey U
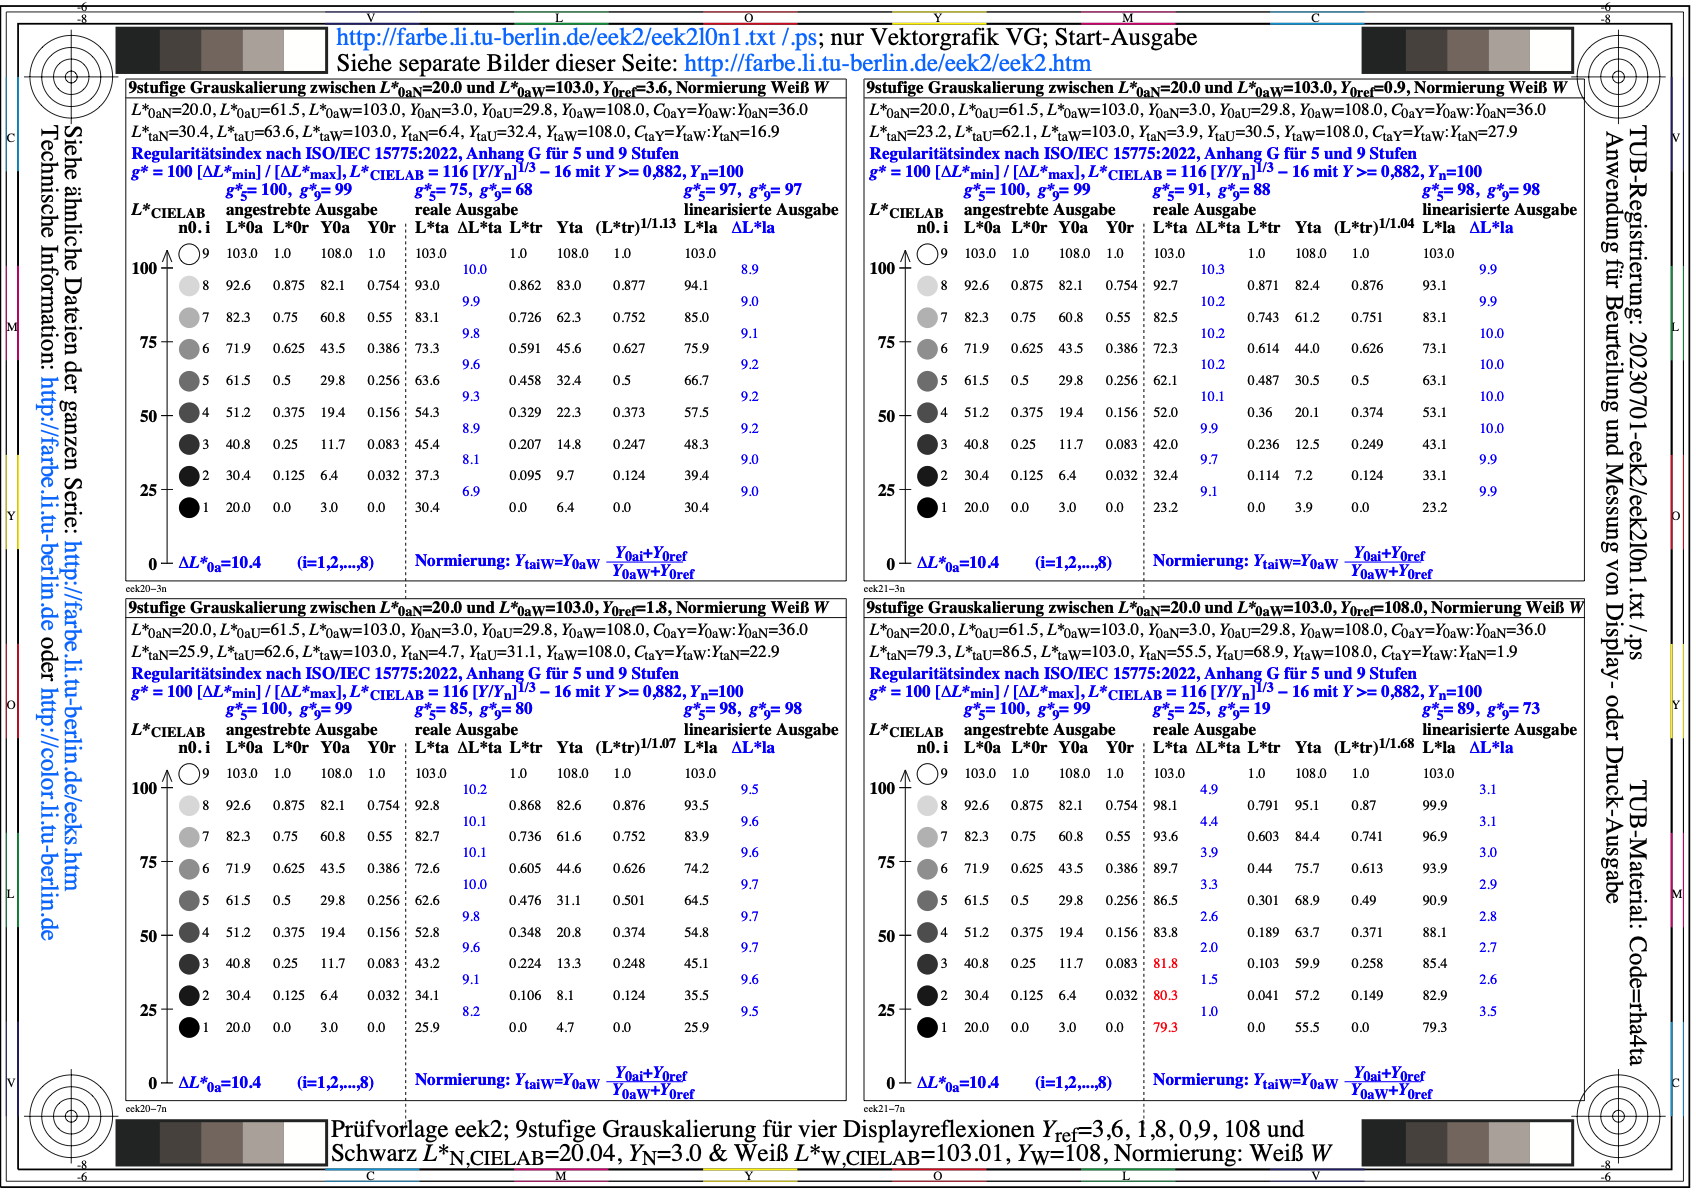
Image eek2l0n1.jpg: Output in format A6 of the file
eek2l0np.pdf, see
eek2l0n1.
PS /
TXT /
PDF /
jpg
eek2: TUB-test chart eek2; CIELAB spaced 9 step grey scales
for four display reflections Yref=3,6, 0,9, 1,8, 108
L*N=20 or YN=3 and L*W=103 or YW=108, normalisation: white W
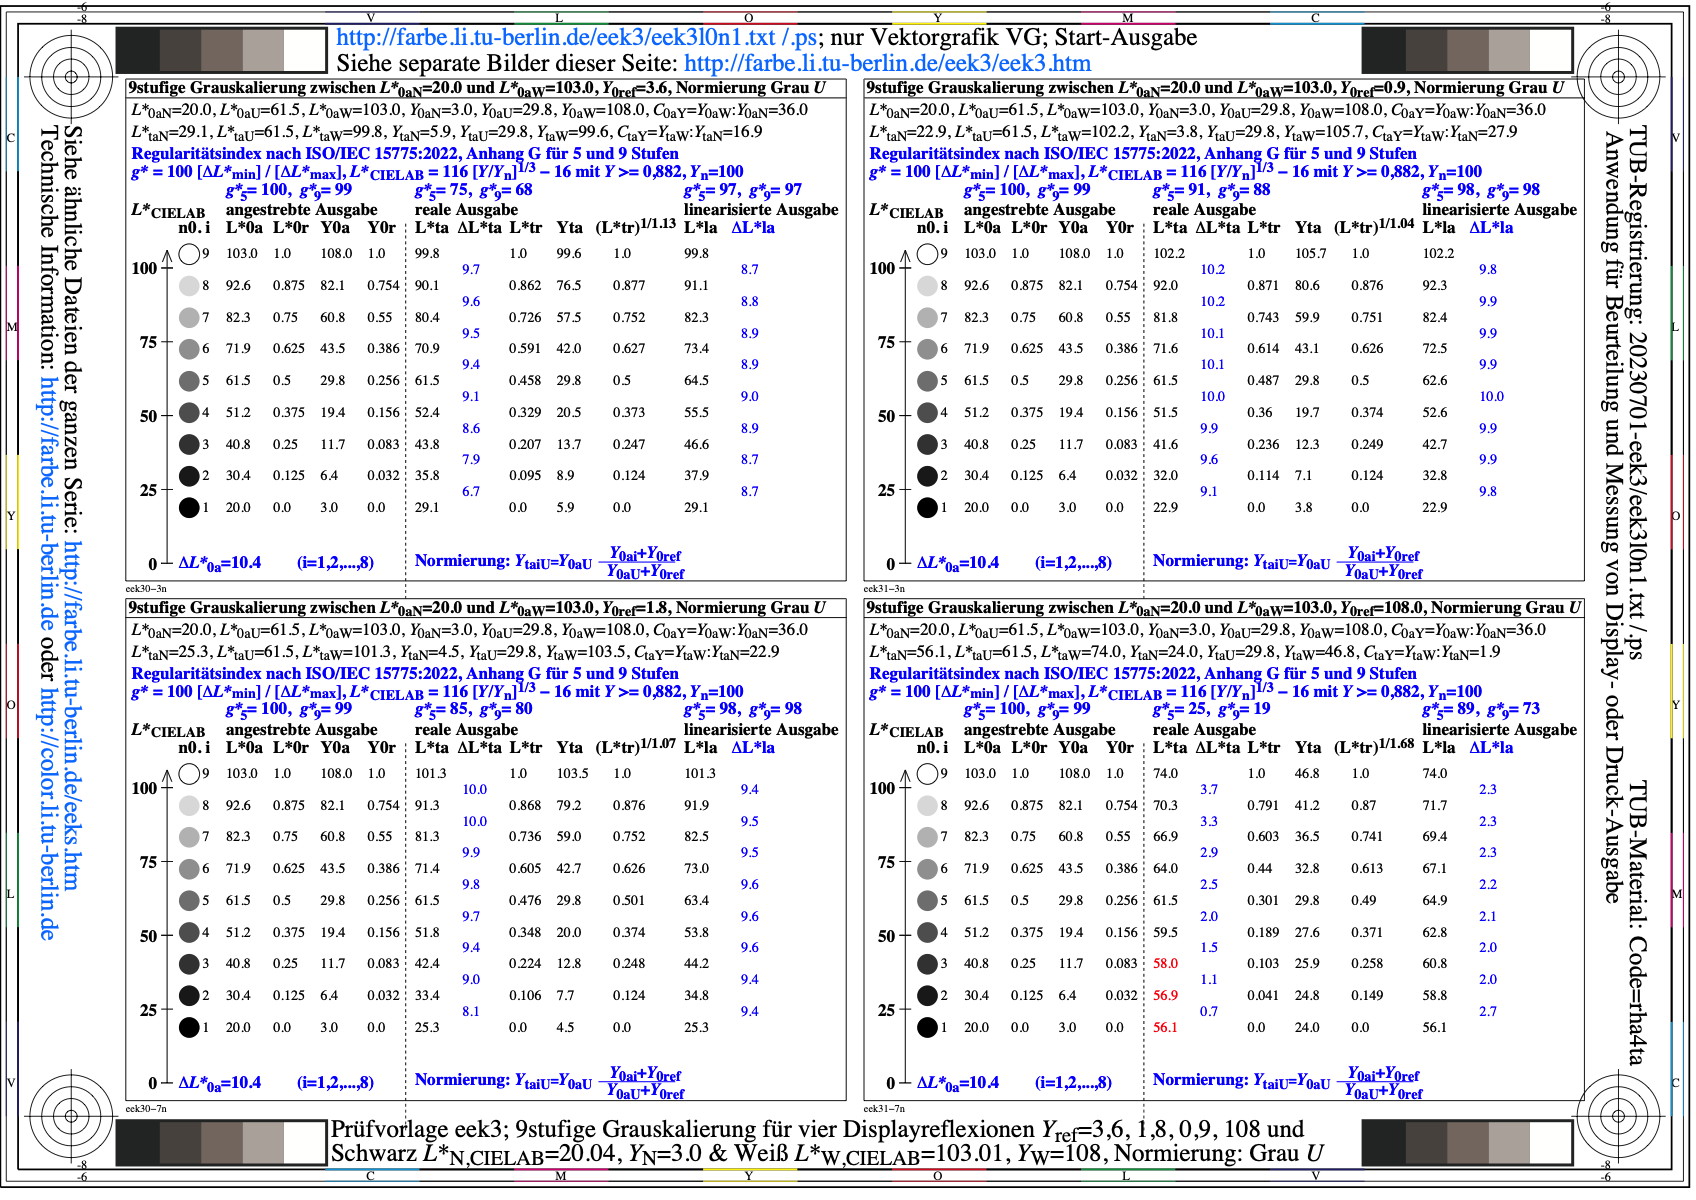
Image eek3l0n1.jpg: Output in format A6 of the file
eek3l0np.pdf, see
eek3l0n1.
PS /
TXT /
PDF /
jpg
eek3: TUB-test chart eek3; CIELAB spaced 9 step grey scales
for four display reflections Yref=3,6, 0,9, 1,8, 108
L*N=20 or YN=3 and L*W=103 or YW=108, normalisation: grey U
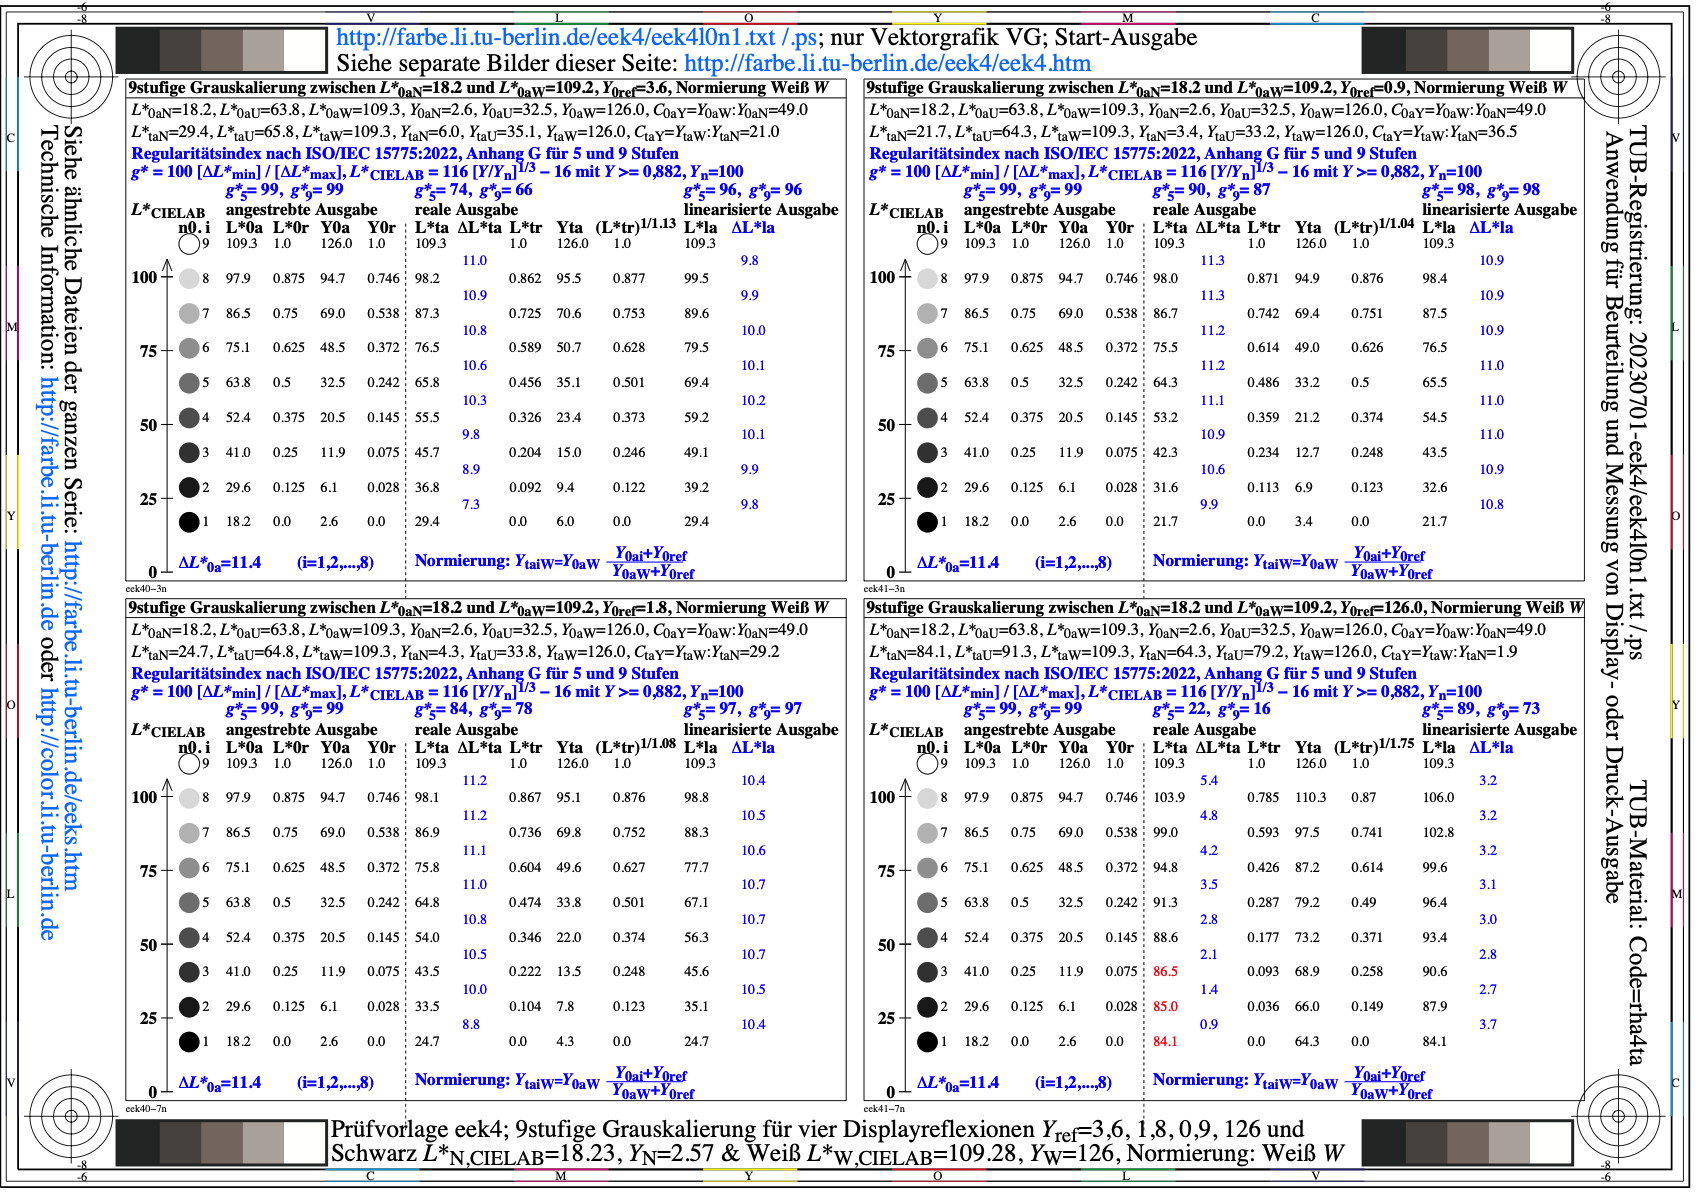
Image eek4l0n1.jpg: Output in format A6 of the file
eek4l0np.pdf, see
eek4l0n1.
PS /
TXT /
PDF /
jpg
eek4: TUB-test chart eek4; CIELAB spaced 9 step grey scales
for four display reflections Yref=3,6, 0,9, 1,8, 126
L*N=18,2 or YN=2,6 and L*W=109 or YW=126, normalisation: white W
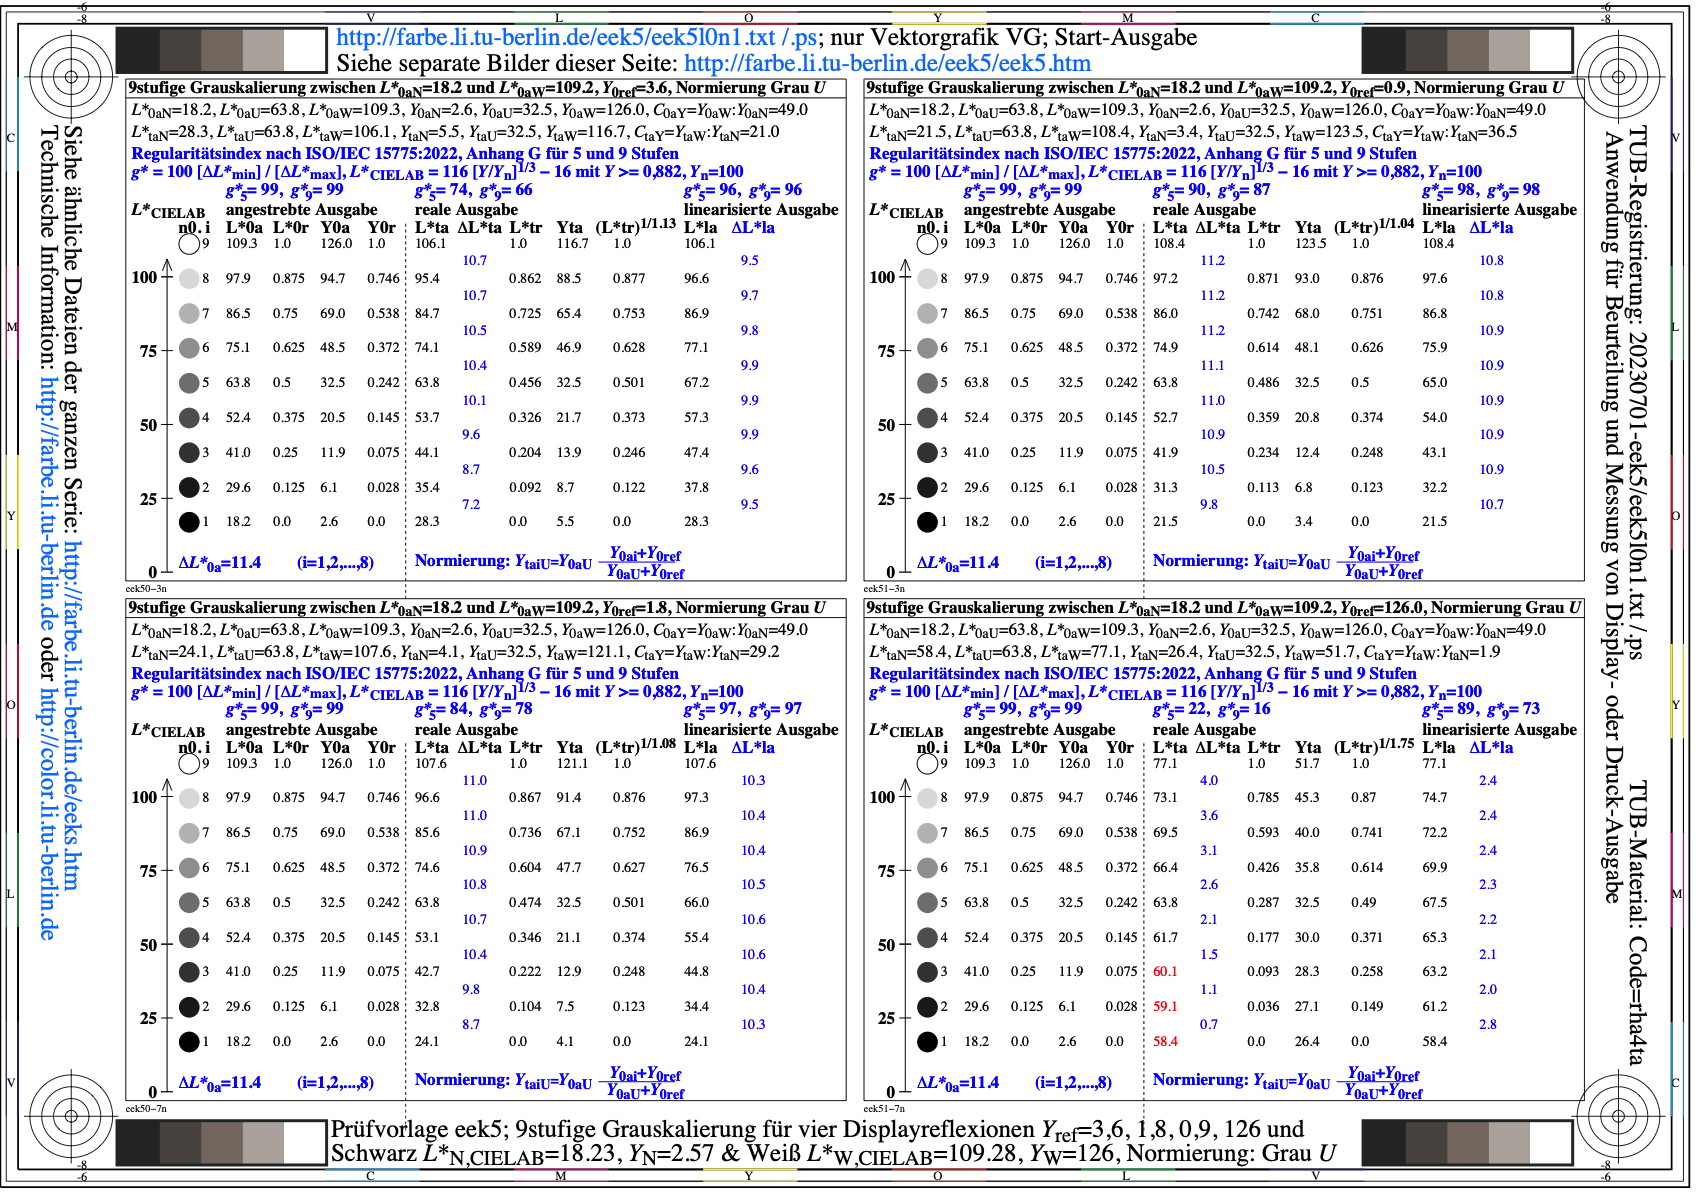
Image eek5l0n1.jpg: Output in format A6 of the file
eek5l0np.pdf, see
eek5l0n1.
PS /
TXT /
PDF /
jpg
eek5: TUB-test chart eek5; CIELAB spaced 9 step grey scales
for four display reflections Yref=3,6, 0,9, 1,8, 126
L*N=18,2 or YN=2,6 and L*W=109 or YW=126, normalisation: grey U
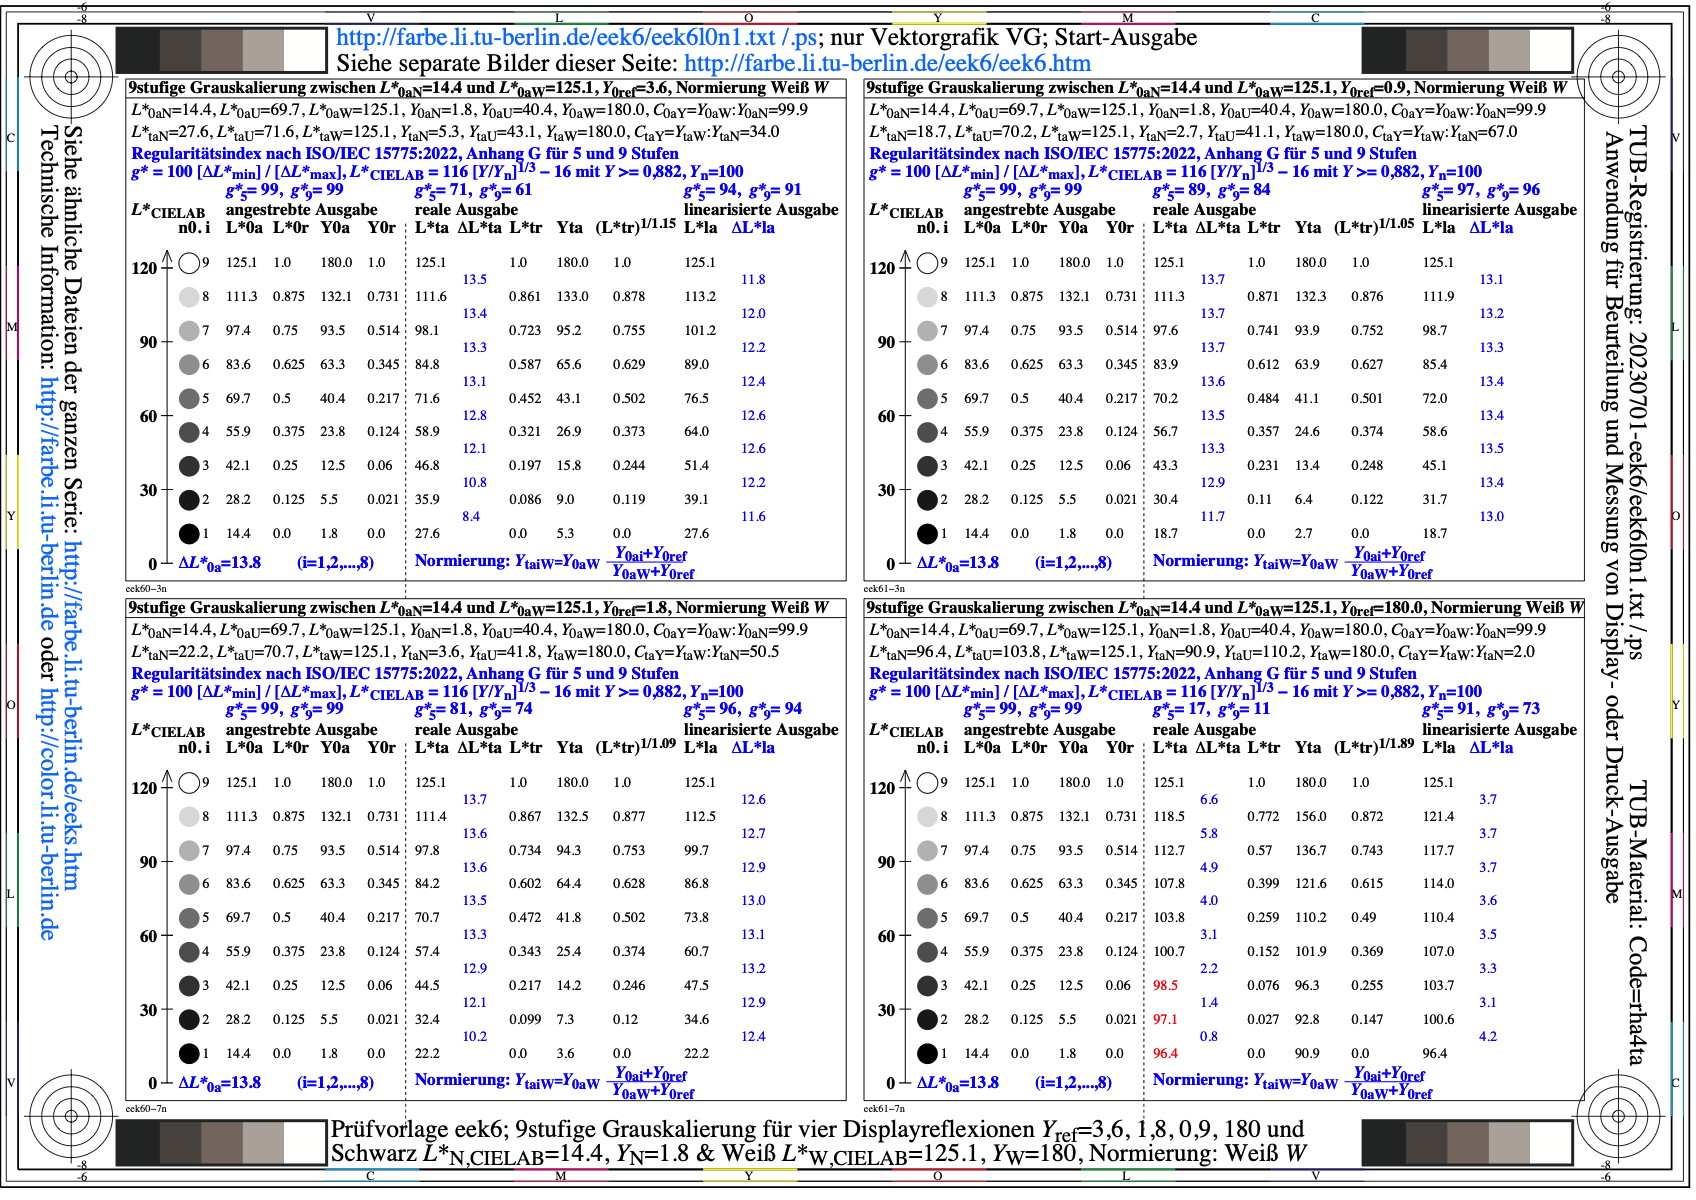
Image eek6l0n1.jpg: Output in format A6 of the file
eek6l0np.pdf, see
eek6l0n1.
PS /
TXT /
PDF /
jpg
eek6: TUB-test chart eek6; CIELAB spaced 9 step grey scales
for four display reflections Yref=3,6, 0,9, 1,8, 180
L*N=14 or YN=1,8 and L*W=125,1 or YW=180, normalisation: white W
Image eek7l0n1.jpg: Output in format A6 of the file
eek7l0np.pdf, see
eek7l0n1.
PS /
TXT /
PDF /
jpg
eek7: TUB-test chart eek7; CIELAB spaced 9 step grey scales
for four display reflections Yref=3,6, 0,9, 1,8, 180
L*N=14 or YN=1,8 and L*W=125,1 or YW=180, normalisation: grey U

Image eek8l0n1.jpg: Output in format A6 of the file
eek8l0np.pdf, see
eek8l0n1.
PS /
TXT /
PDF /
jpg
eek8: TUB-test chart eek8; CIELAB spaced 9 step grey scales
for four display reflections Yref=3,6, 0,9, 1,8, 54
L*N=29,4 or YN=6 and L*W=78,5 or YW=54, normalisation: white W

Image eek9l0n1.jpg: Output in format A6 of the file
eek9l0np.pdf, see
eek9l0n1.
PS /
TXT /
PDF /
jpg
eek9: TUB-test chart eek9; CIELAB spaced 9 step grey scales
for four display reflections Yref=3,6, 0,9, 1,8, 54
L*N=29,4 or YN=6 and L*W=78,5 or YW=54, normalisation: grey U
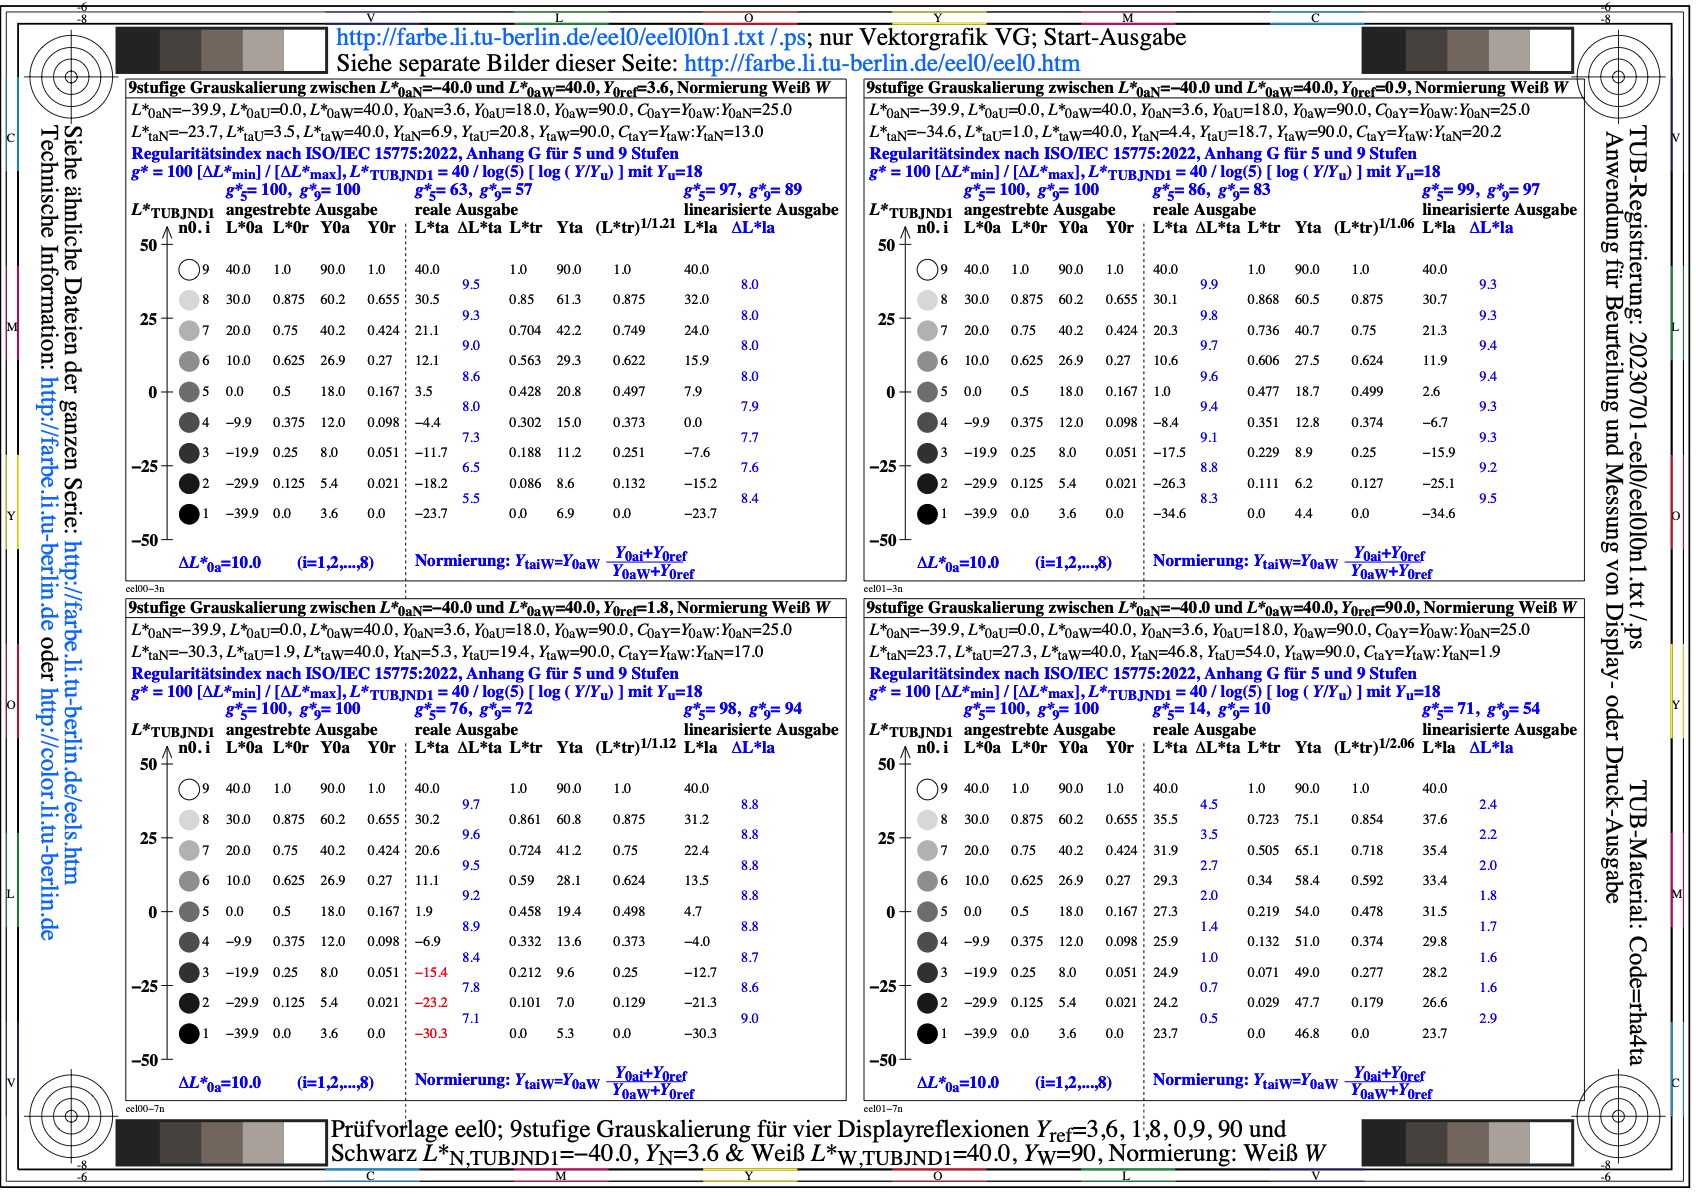
Image eel0l0n1.jpg: Output in format A6 of the file
eel0l0np.pdf, see
eel0l0n1.
PS /
TXT /
PDF /
jpg
eel0: TUB-test chart eel0; TUBJND1 spaced 9 step grey scales
for four display reflections Yref=3,6, 0,9, 1,8, 90
L*N=22,3 or YN=3,6 and L*W=96 or YW=90, normalisation: white W
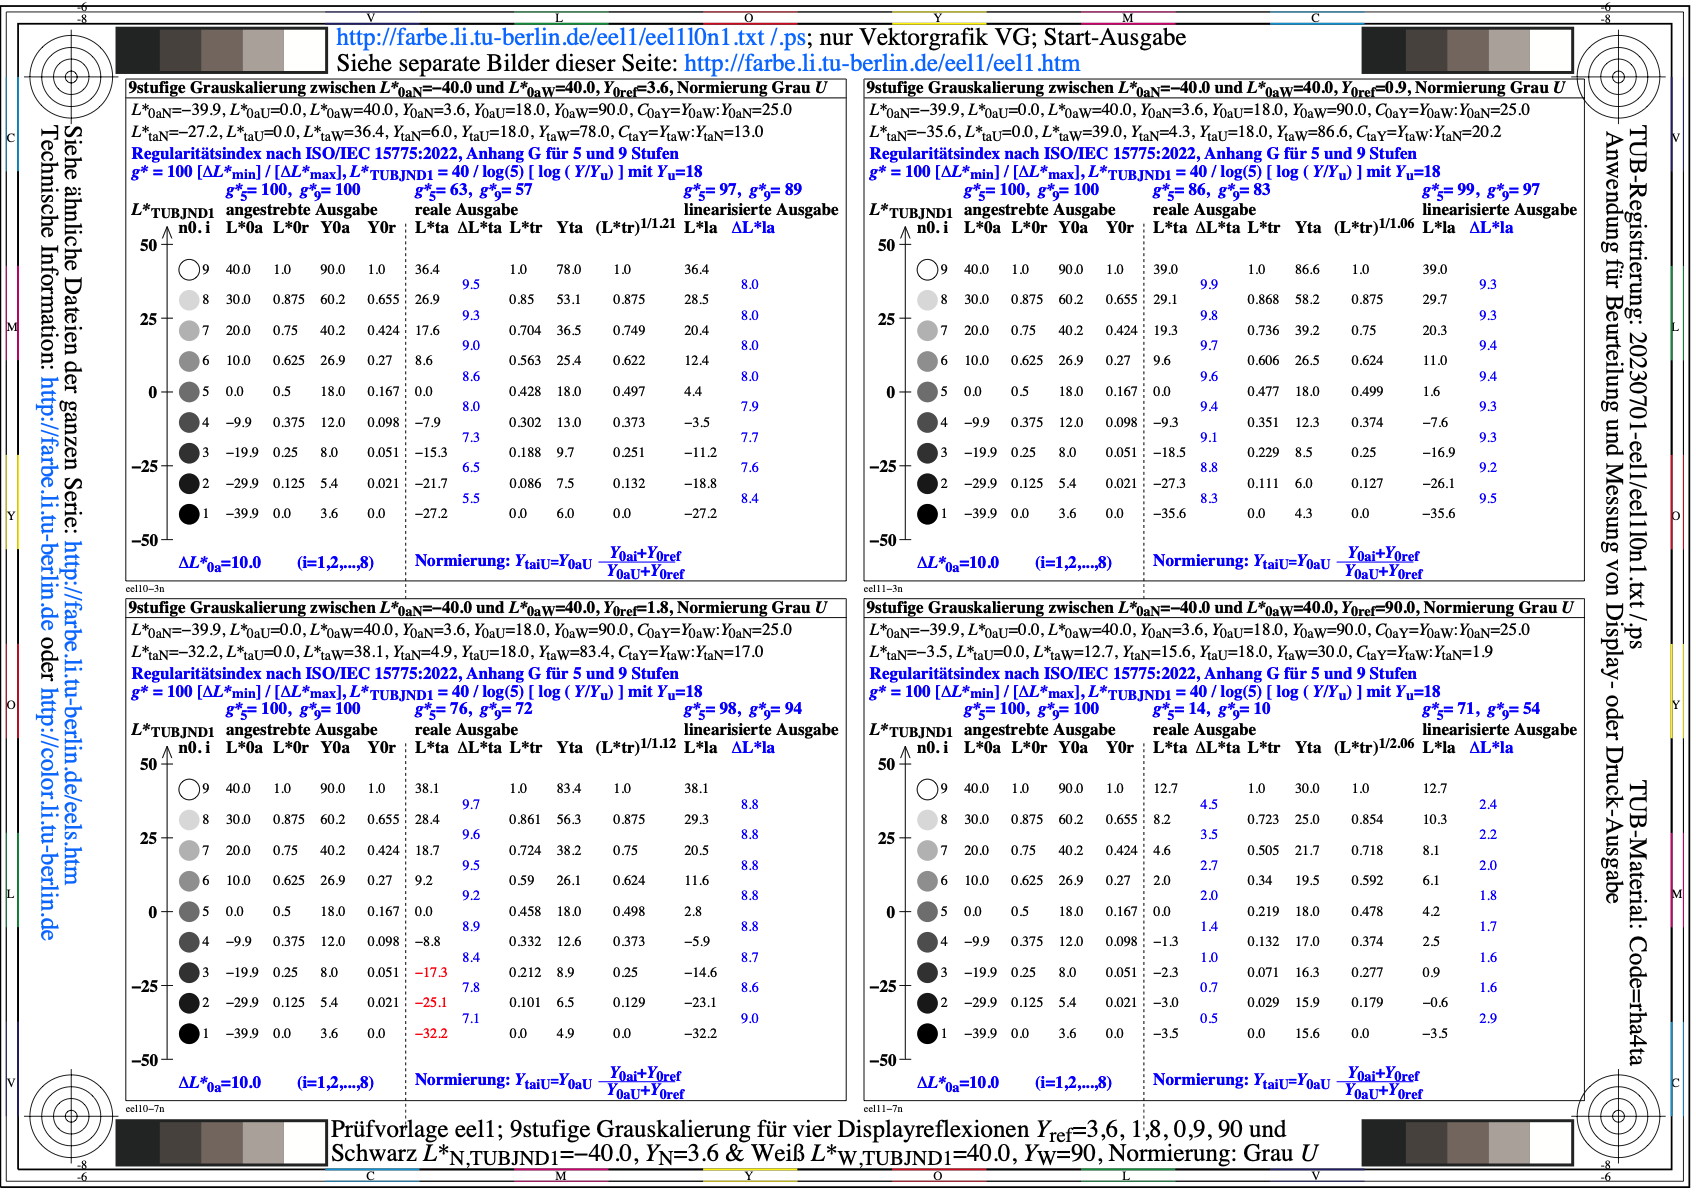
Image eel1l0n1.jpg: Output in format A6 of the file
eel1l0np.pdf, see
eel1l0n1.
PS /
TXT /
PDF /
jpg
eel1: TUB-test chart eel1; TUBJND1 spaced 9 step grey scales
for four display reflections Yref=3,6, 0,9, 1,8, 90
L*N=22,3 or YN=3,6 and L*W=96 or YW=90, normalisation: grey U

Image eel2l0n1.jpg: Output in format A6 of the file
eel2l0np.pdf, see
eel2l0n1.
PS /
TXT /
PDF /
jpg
eel2: TUB-test chart eel2; TUBJND1 spaced 9 step grey scales
for four display reflections Yref=3,6, 0,9, 1,8, 90
L*N=20 or YN=3 and L*W=103 or YW=108, normalisation: white W

Image eel3l0n1.jpg: Output in format A6 of the file
eel3l0np.pdf, see
eel3l0n1.
PS /
TXT /
PDF /
jpg
eel3: TUB-test chart eel3; TUBJND1 spaced 9 step grey scales
for four display reflections Yref=3,6, 0,9, 1,8, 90
L*N=20 or YN=3 and L*W=103 or YW=108, normalisation: grey U
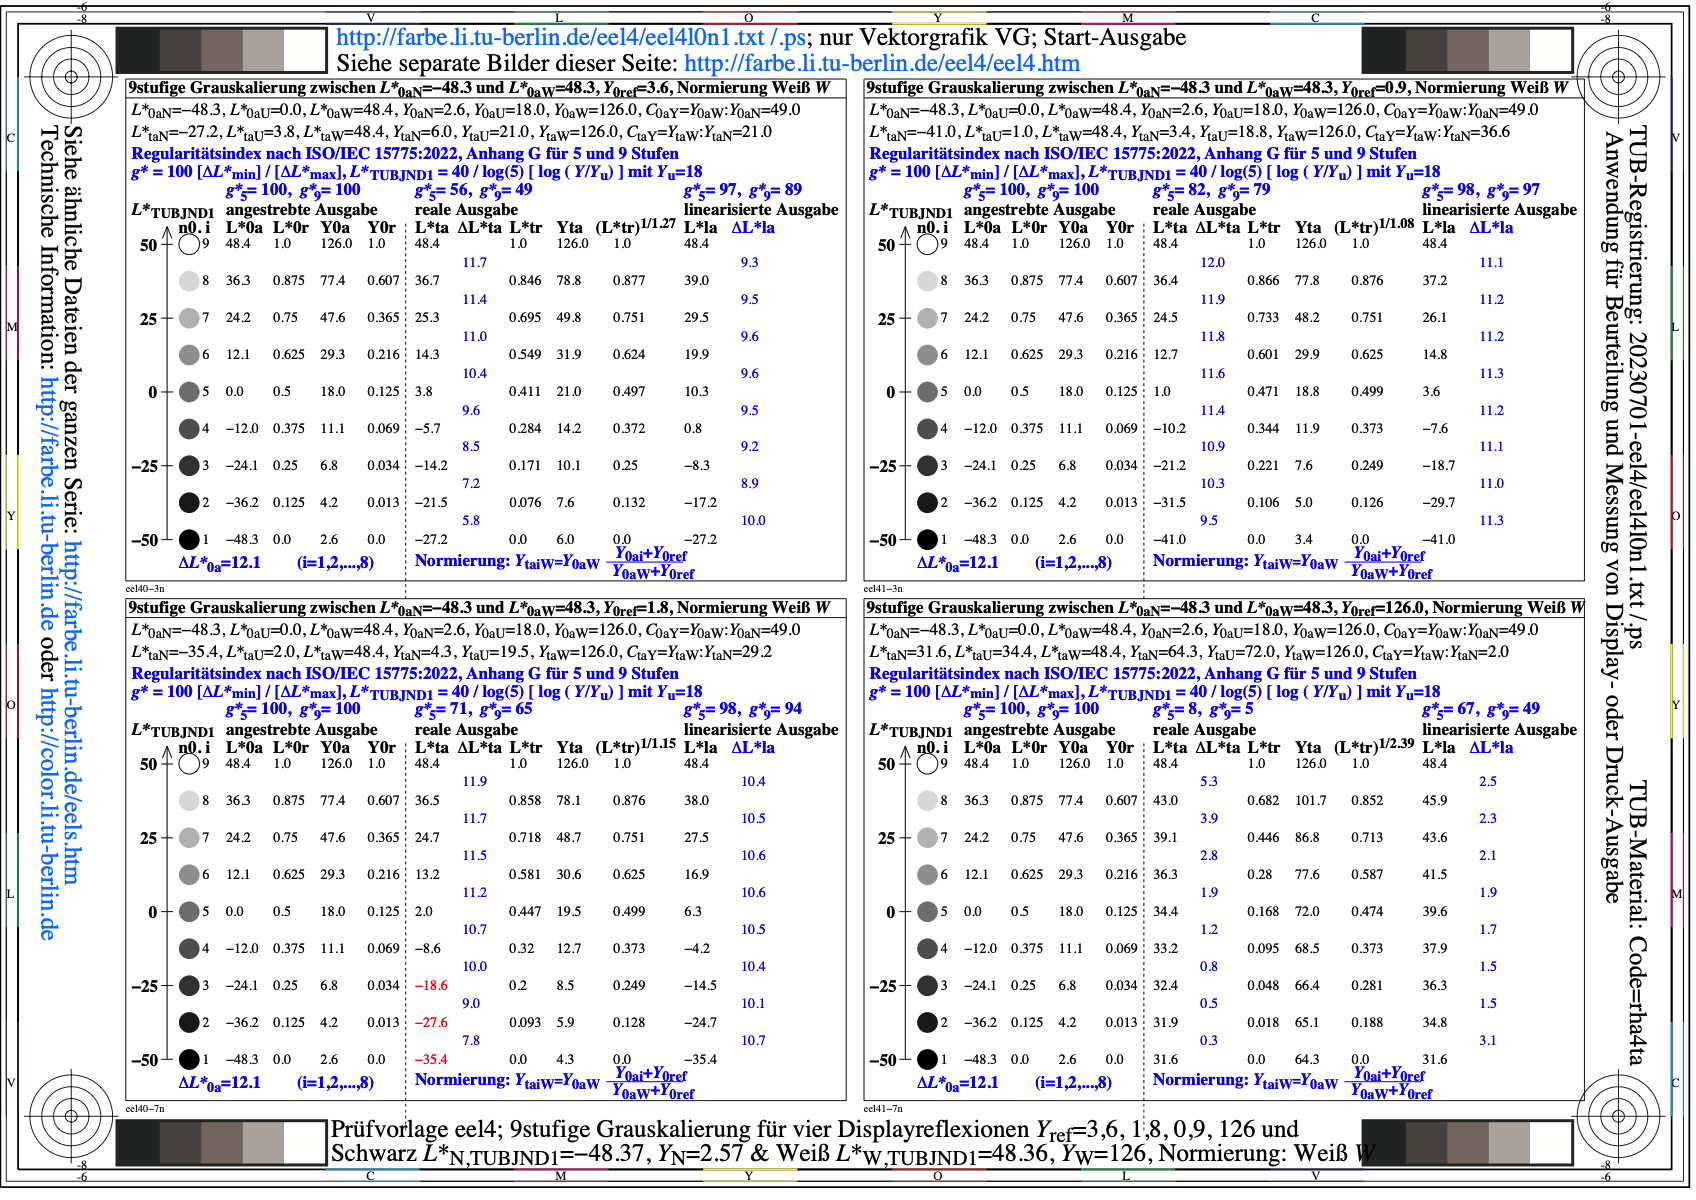
Image eel4l0n1.jpg: Output in format A6 of the file
eel4l0np.pdf, see
eel4l0n1.
PS /
TXT /
PDF /
jpg
eel4: TUB-test chart eel4; TUBJND1 spaced 9 step grey scales
for four display reflections Yref=3,6, 0,9, 1,8, 90
L*N=18,2 or YN=2,6 and L*W=109 or YW=126, normalisation: white W
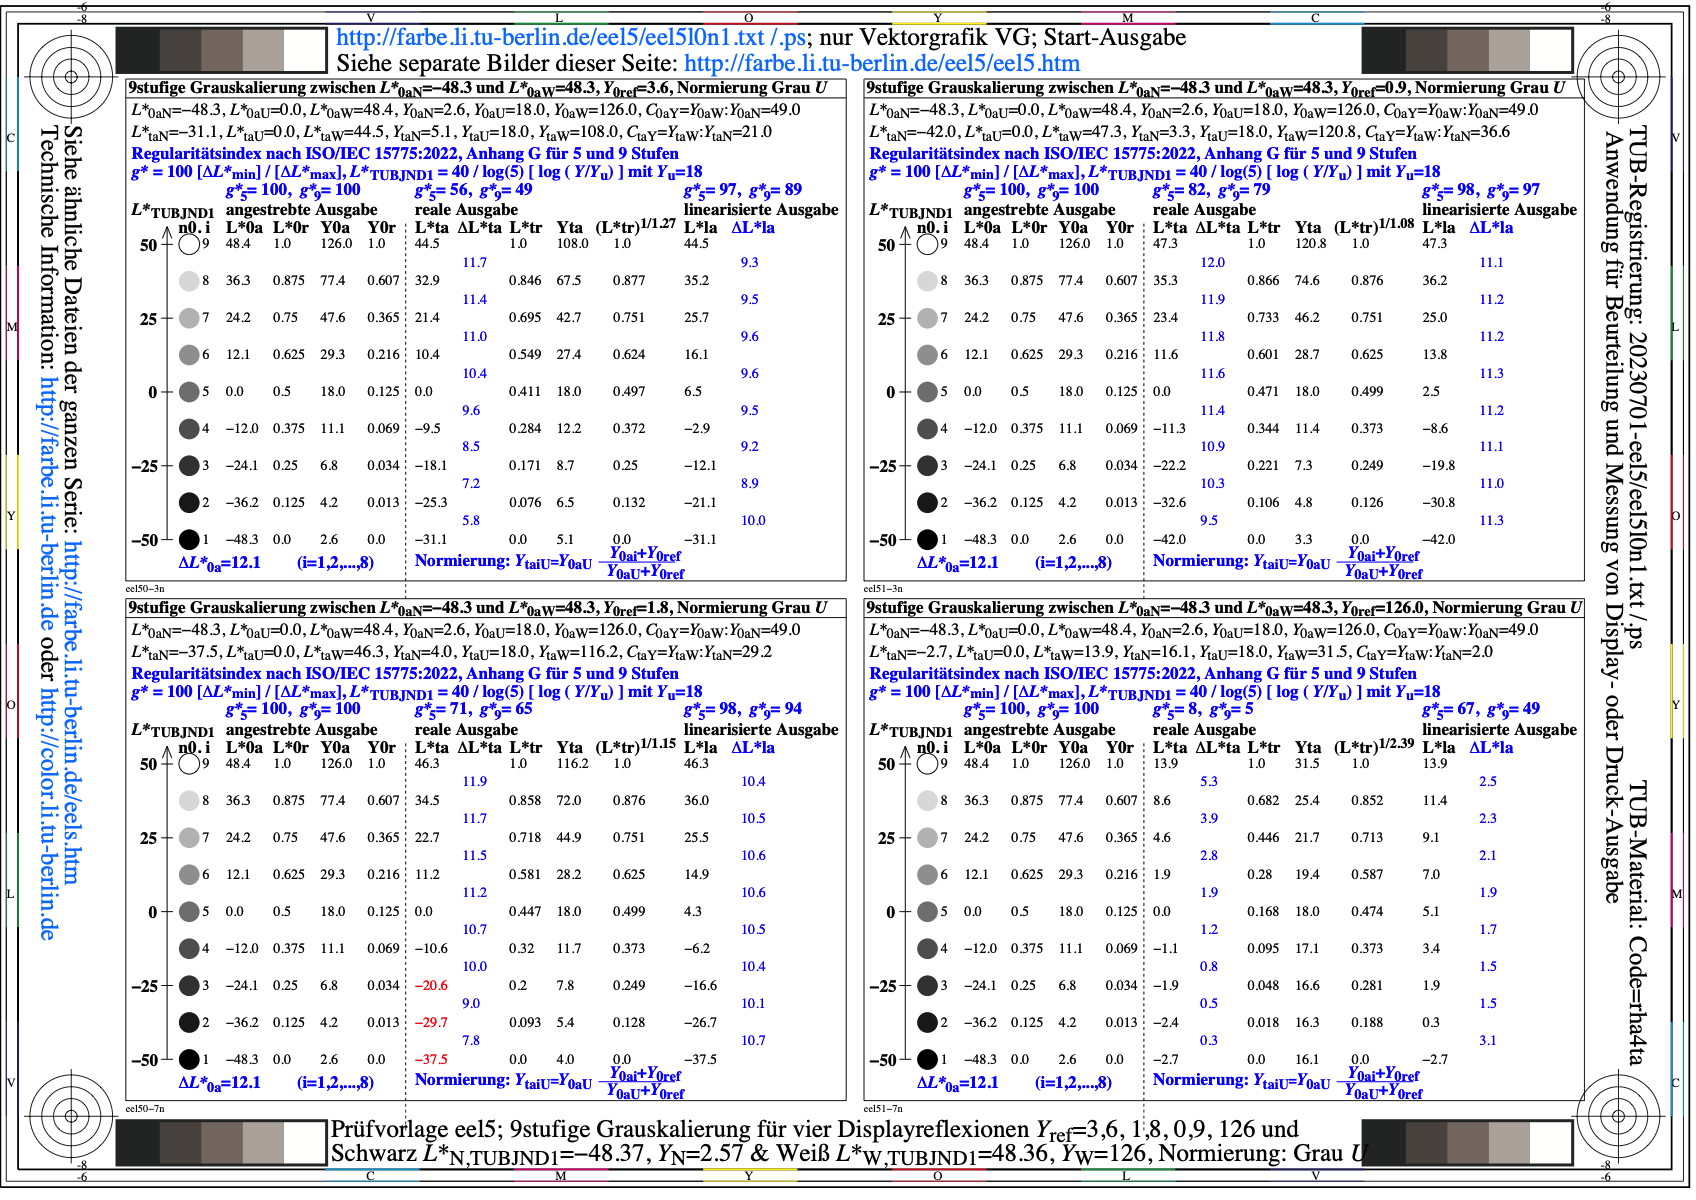
Image eel5l0n1.jpg: Output in format A6 of the file
eel5l0np.pdf, see
eel5l0n1.
PS /
TXT /
PDF /
jpg
eel5: TUB-test chart eel5; TUBJND1 spaced 9 step grey scales
for four display reflections Yref=3,6, 0,9, 1,8, 90
L*N=18,2 or YN=2,6 and L*W=109 or YW=126, normalisation: grey U
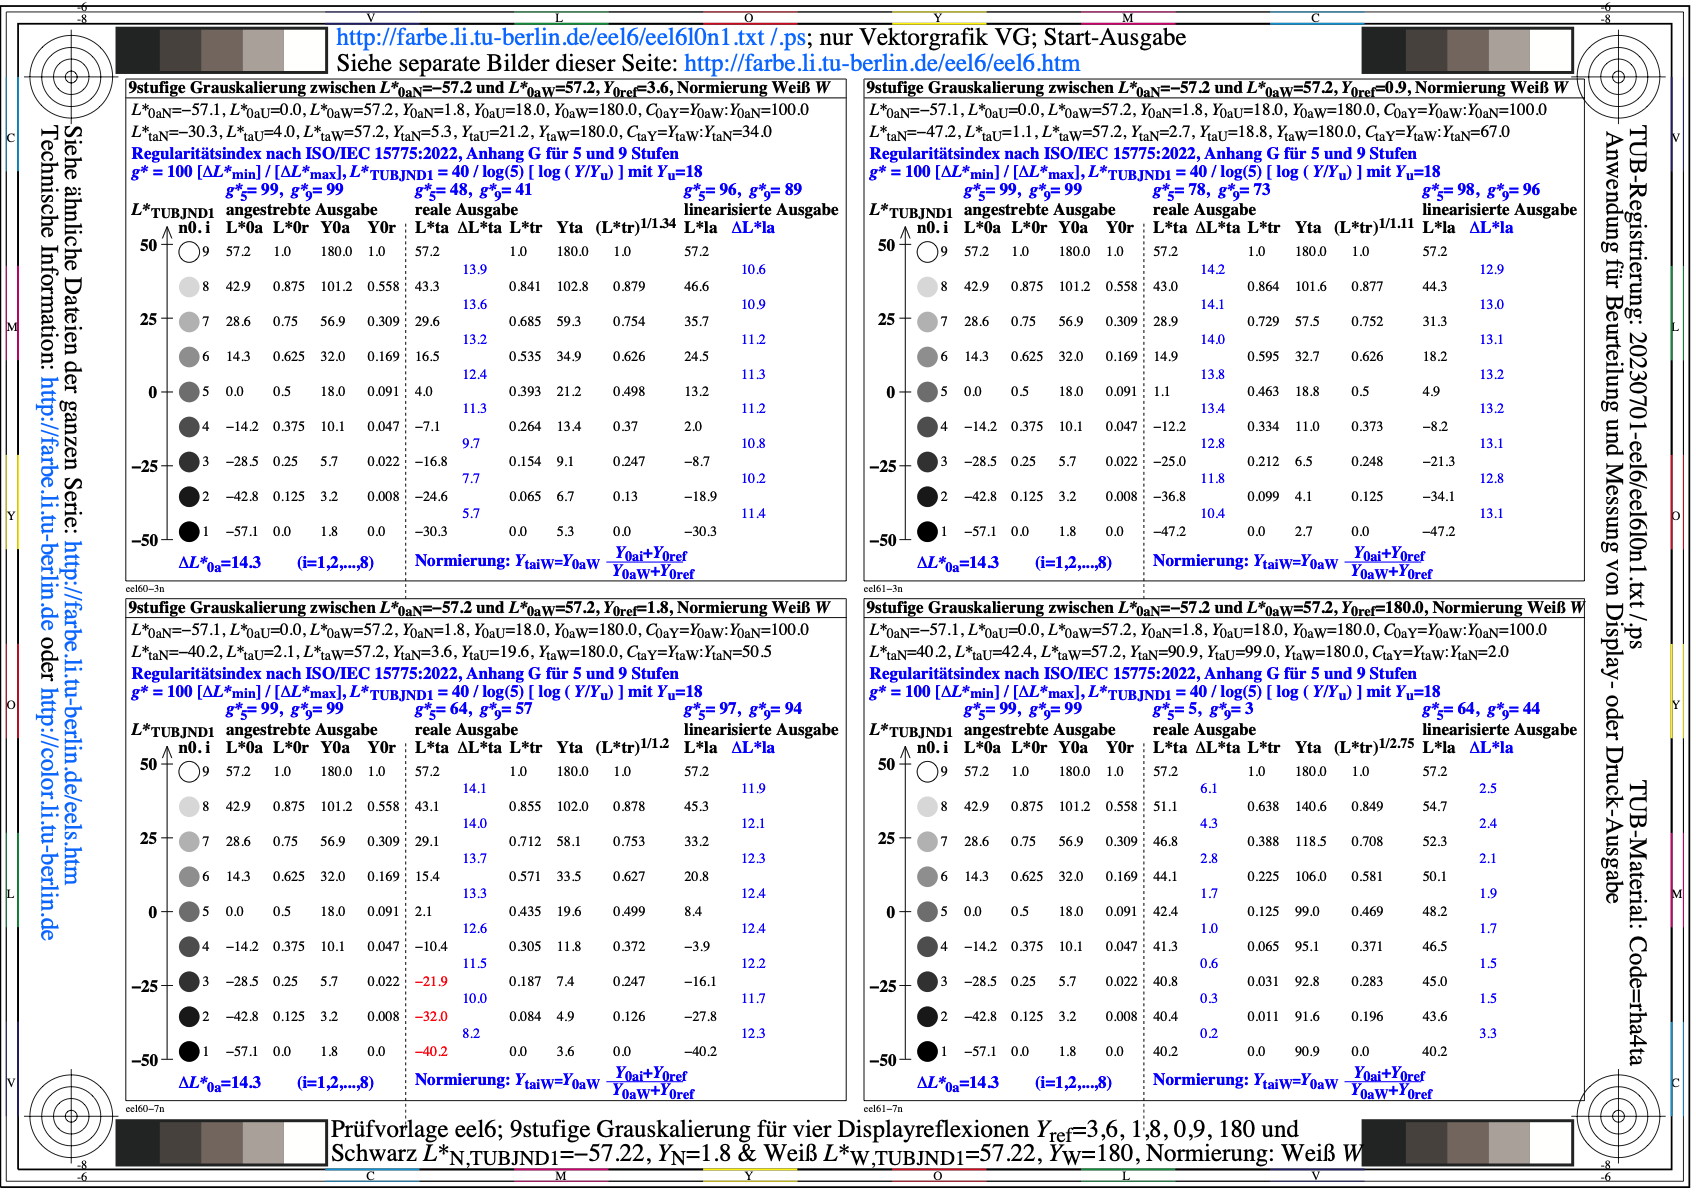
Image eel6l0n1.jpg: Output in format A6 of the file
eel6l0np.pdf, see
eel6l0n1.
PS /
TXT /
PDF /
jpg
eel6: TUB-test chart eel6; TUBJND1 spaced 9 step grey scales
for four display reflections Yref=3,6, 0,9, 1,8, 90
L*N=14 or YN=1,8 and L*W=125,1 or YW=180, normalisation: white W
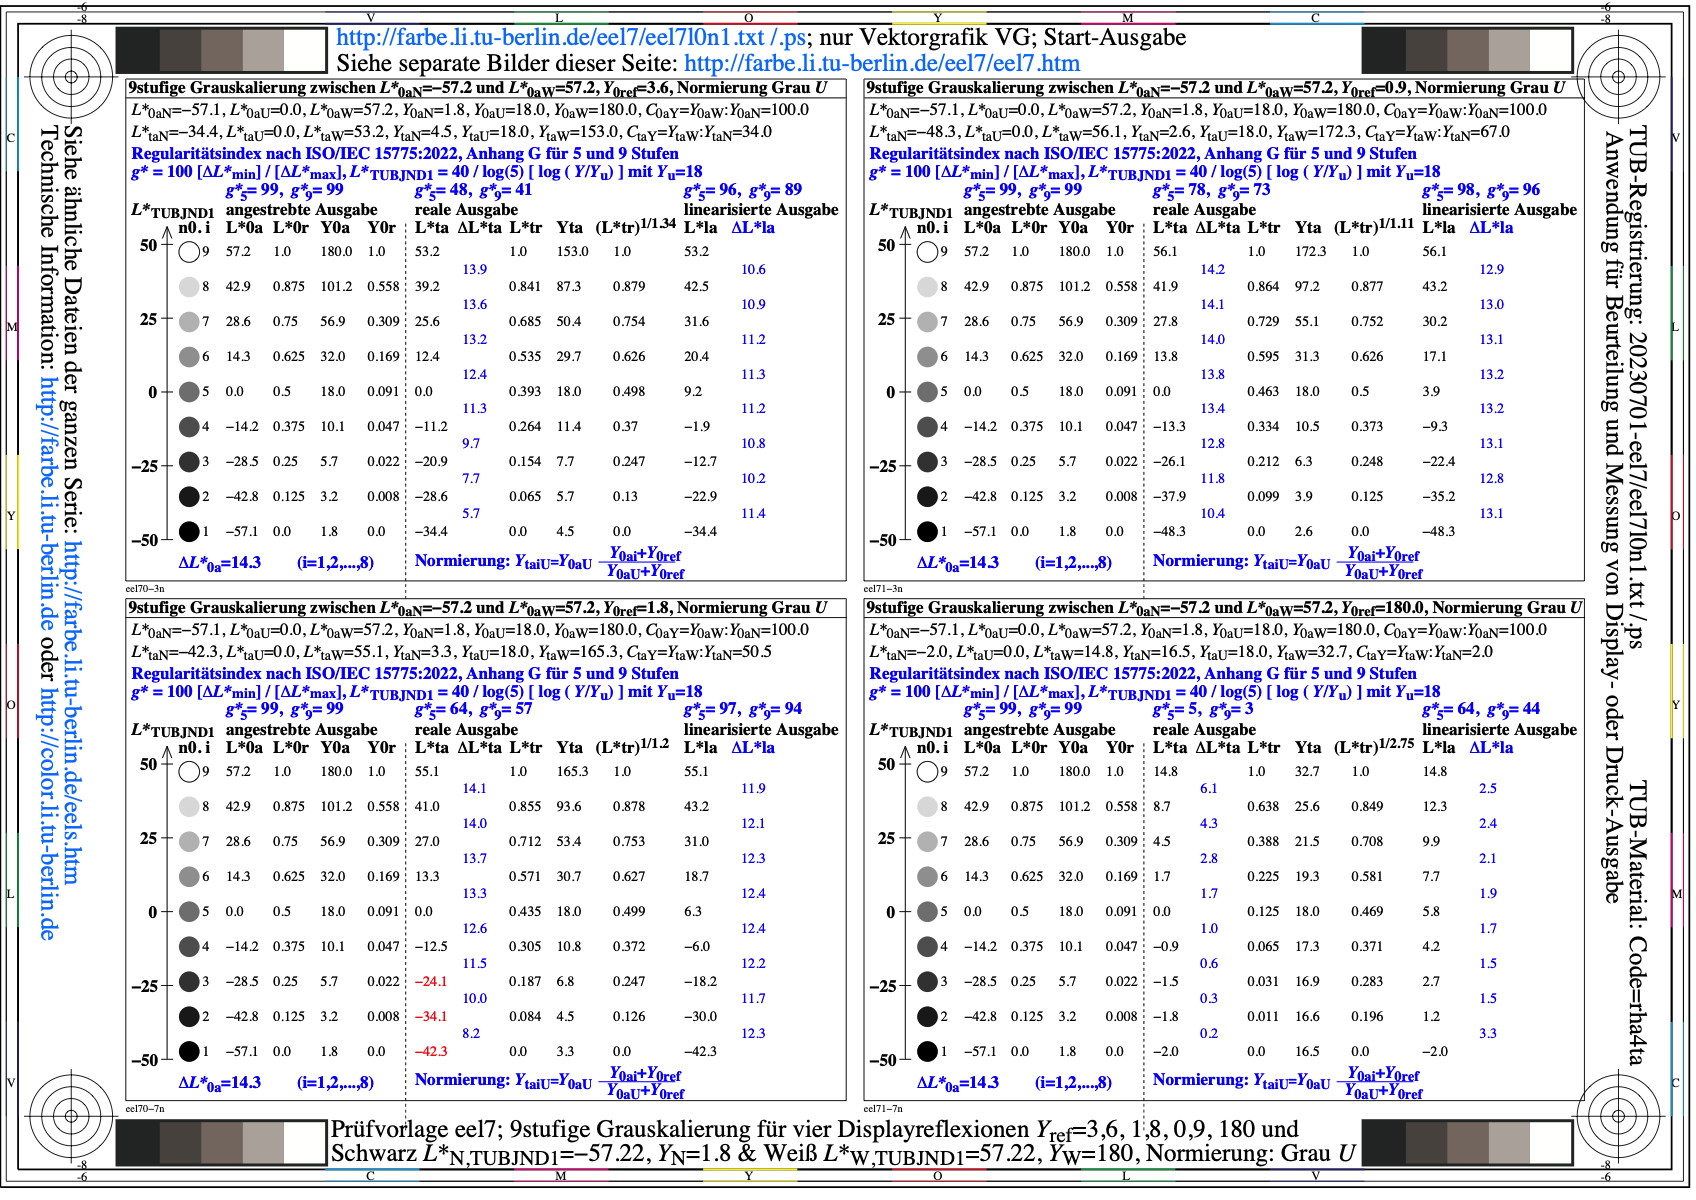
Image eel7l0n1.jpg: Output in format A6 of the file
eel7l0np.pdf, see
eel7l0n1.
PS /
TXT /
PDF /
jpg
eel7: TUB-test chart eel7; TUBJND1 spaced 9 step grey scales
for four display reflections Yref=3,6, 0,9, 1,8, 90
L*N=14 or YN=1,8 and L*W=125,1 or YW=180, normalisation: grey U

Image eel8l0n1.jpg: Output in format A6 of the file
eel8l0np.pdf, see
eel8l0n1.
PS /
TXT /
PDF /
jpg
eel8: TUB-test chart eel8; TUBJND1 spaced 9 step grey scales
for four display reflections Yref=3,6, 0,9, 1,8, 90
L*N=29,4 or YN=6 and L*W=78,5 or YW=54, normalisation: white W

Image eel9l0n1.jpg: Output in format A6 of the file
eel9l0np.pdf, see
eel9l0n1.
PS /
TXT /
PDF /
jpg
eel9: TUB-test chart eel9; TUBJND1 spaced 9 step grey scales
for four display reflections Yref=3,6, 0,9, 1,8, 90
L*N=29,4 or YN=6 and L*W=78,5 or YW=54, normalisation: grey U
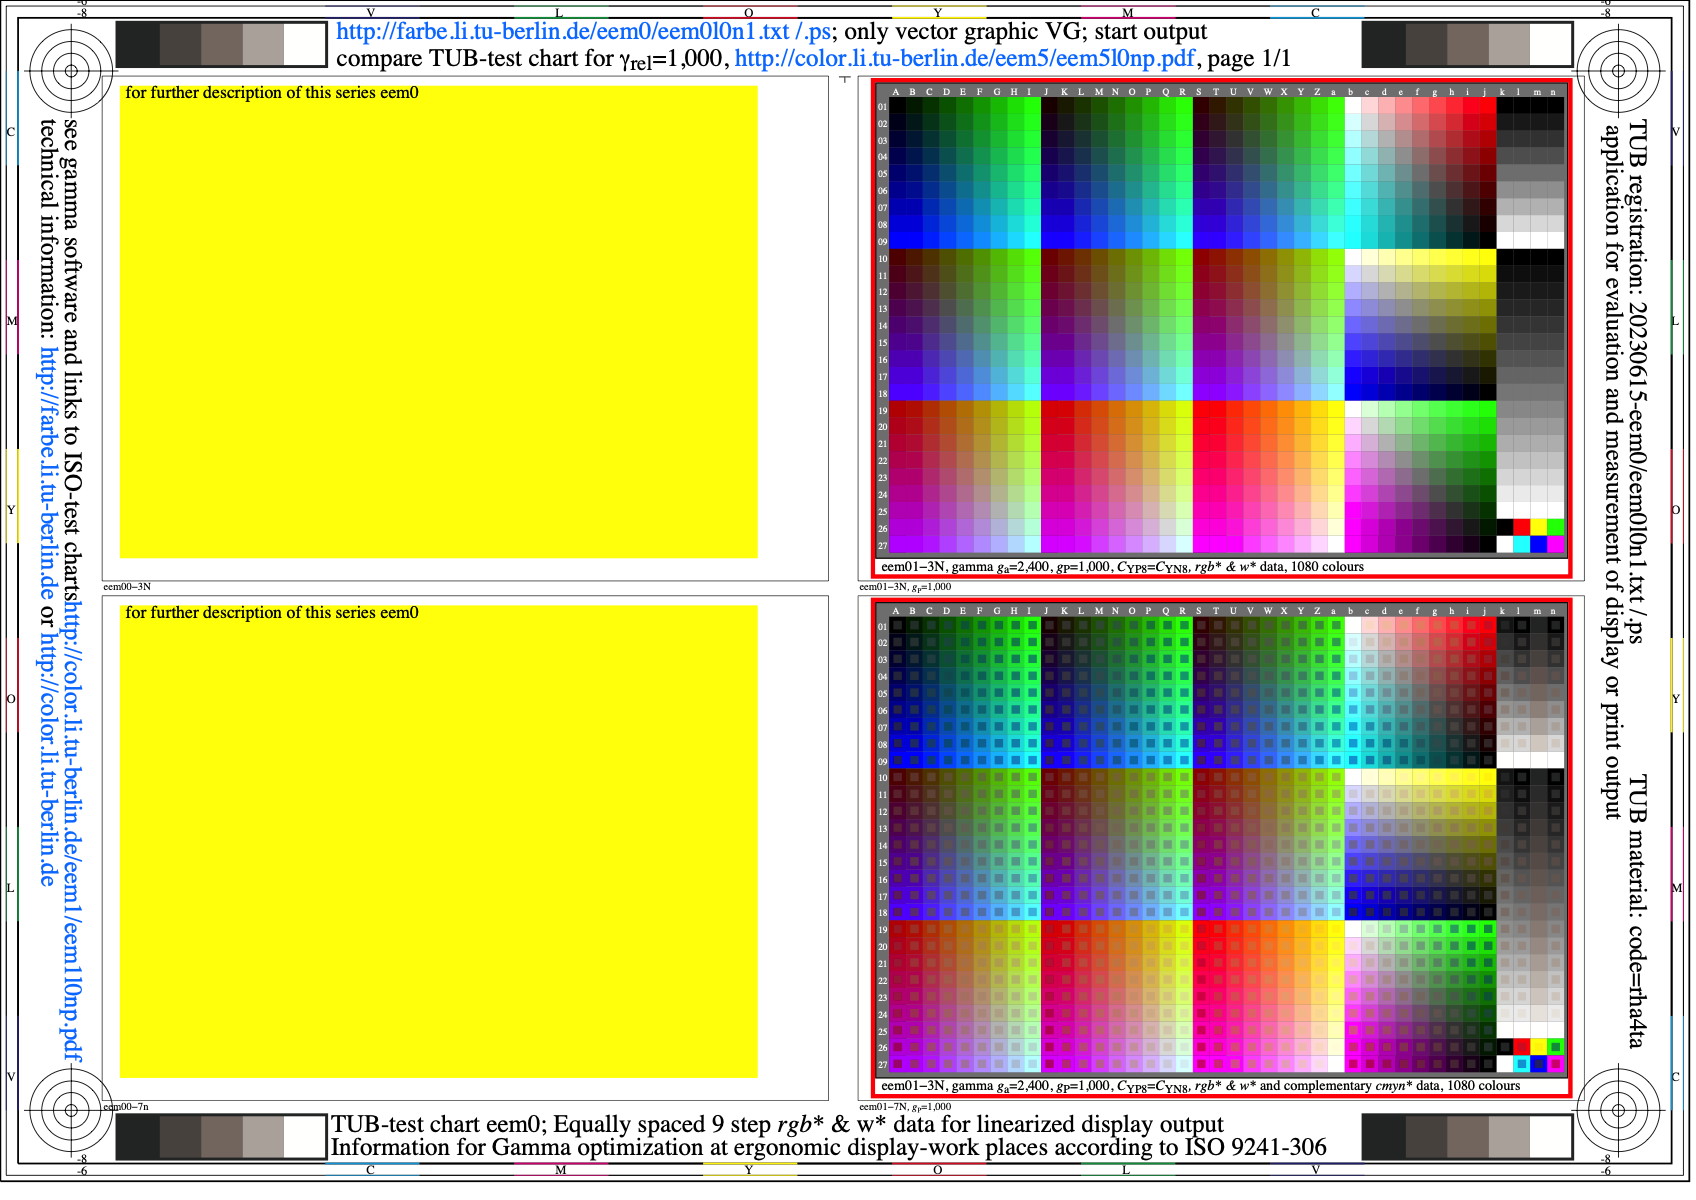
Image eem0l0n1.jpg: Output in format A6 of the file
eem0l0np.pdf, see
eem0l0n1.
PS /
TXT /
PDF /
jpg
eem0: TUB-test chart eem0; Equally spaced 9 step rgb* data
Optimization for 15 display reflections & contrasts according to
ISO 9241-306:2018 and ISO/IEC 15775:2022; gamma_rel=1,000
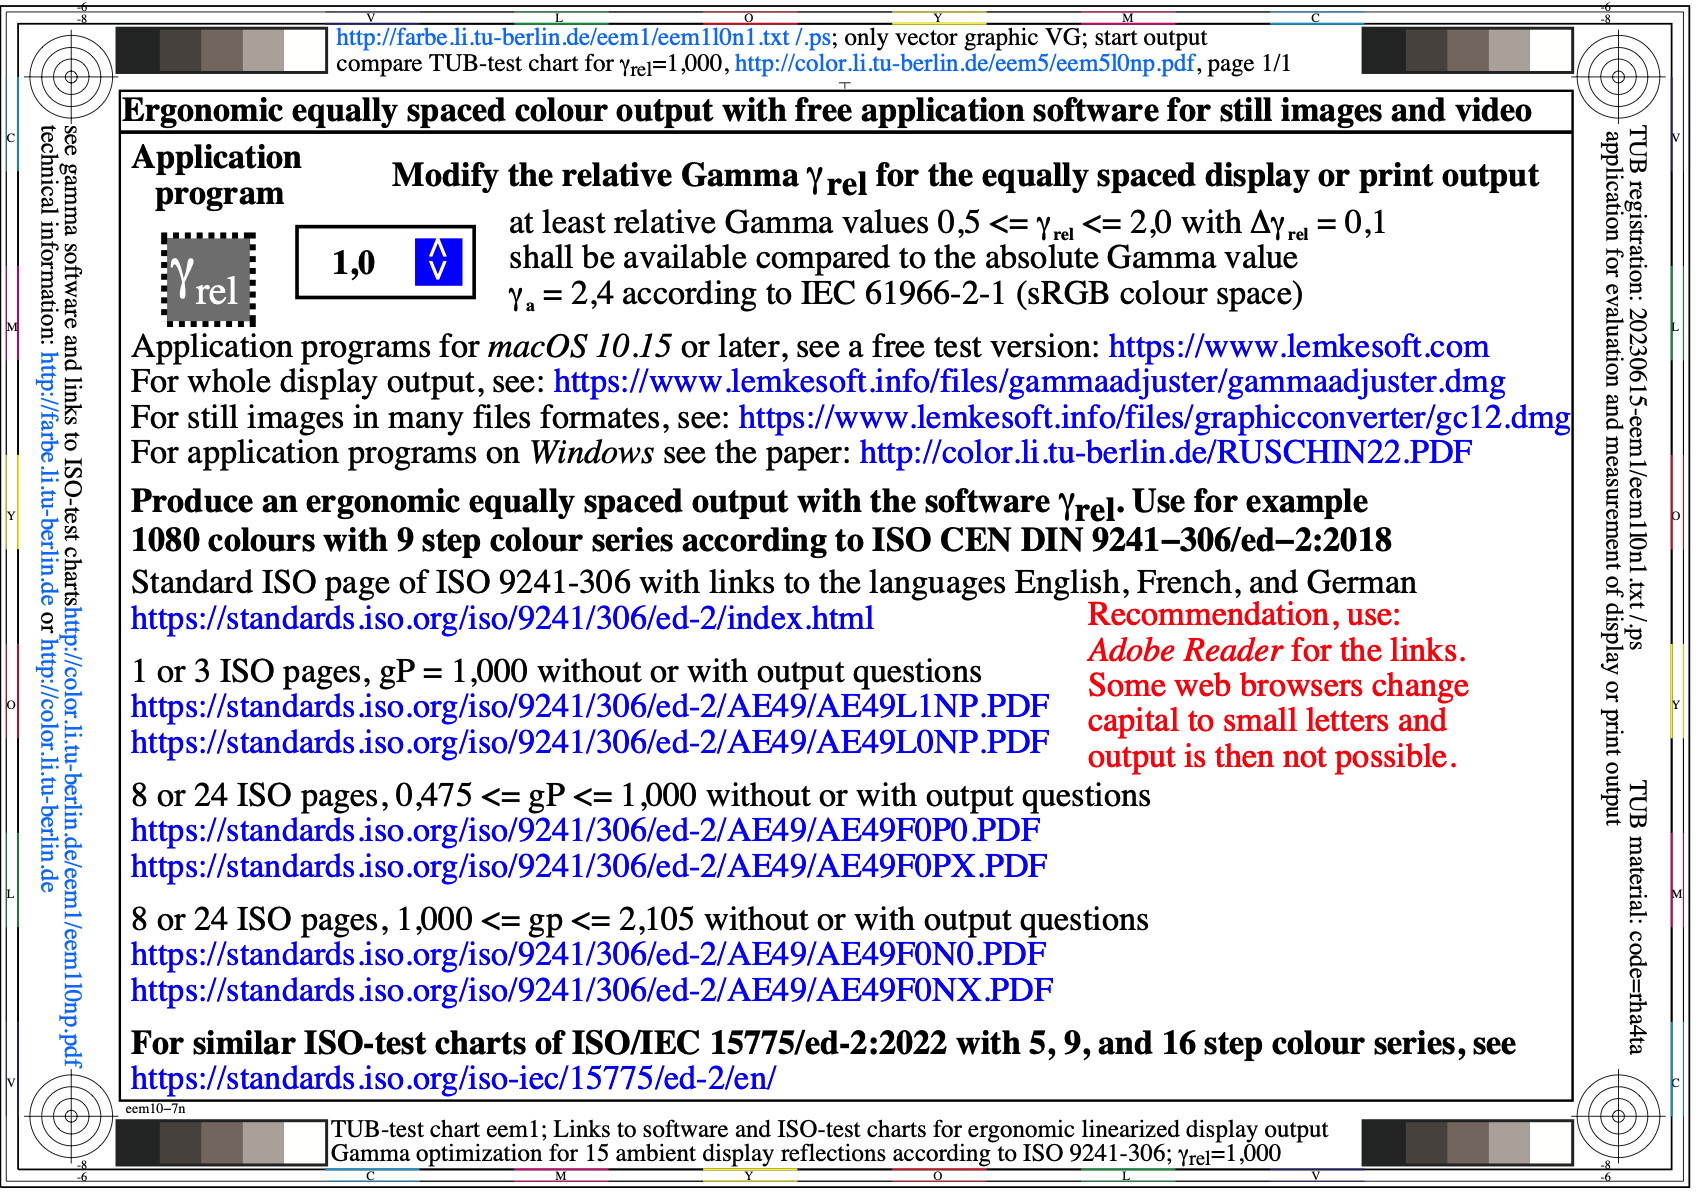
Image eem1l0n1.jpg: Output in format A6 of the file
eem1l0np.pdf, see
eem1l0n1.
PS /
TXT /
PDF /
jpg
eem1: TUB-test chart eem1; Links to software and ISO-test charts
with equally spaced 9 step rgb*- & w*-colour data
for the intended ergonomic linearized display output
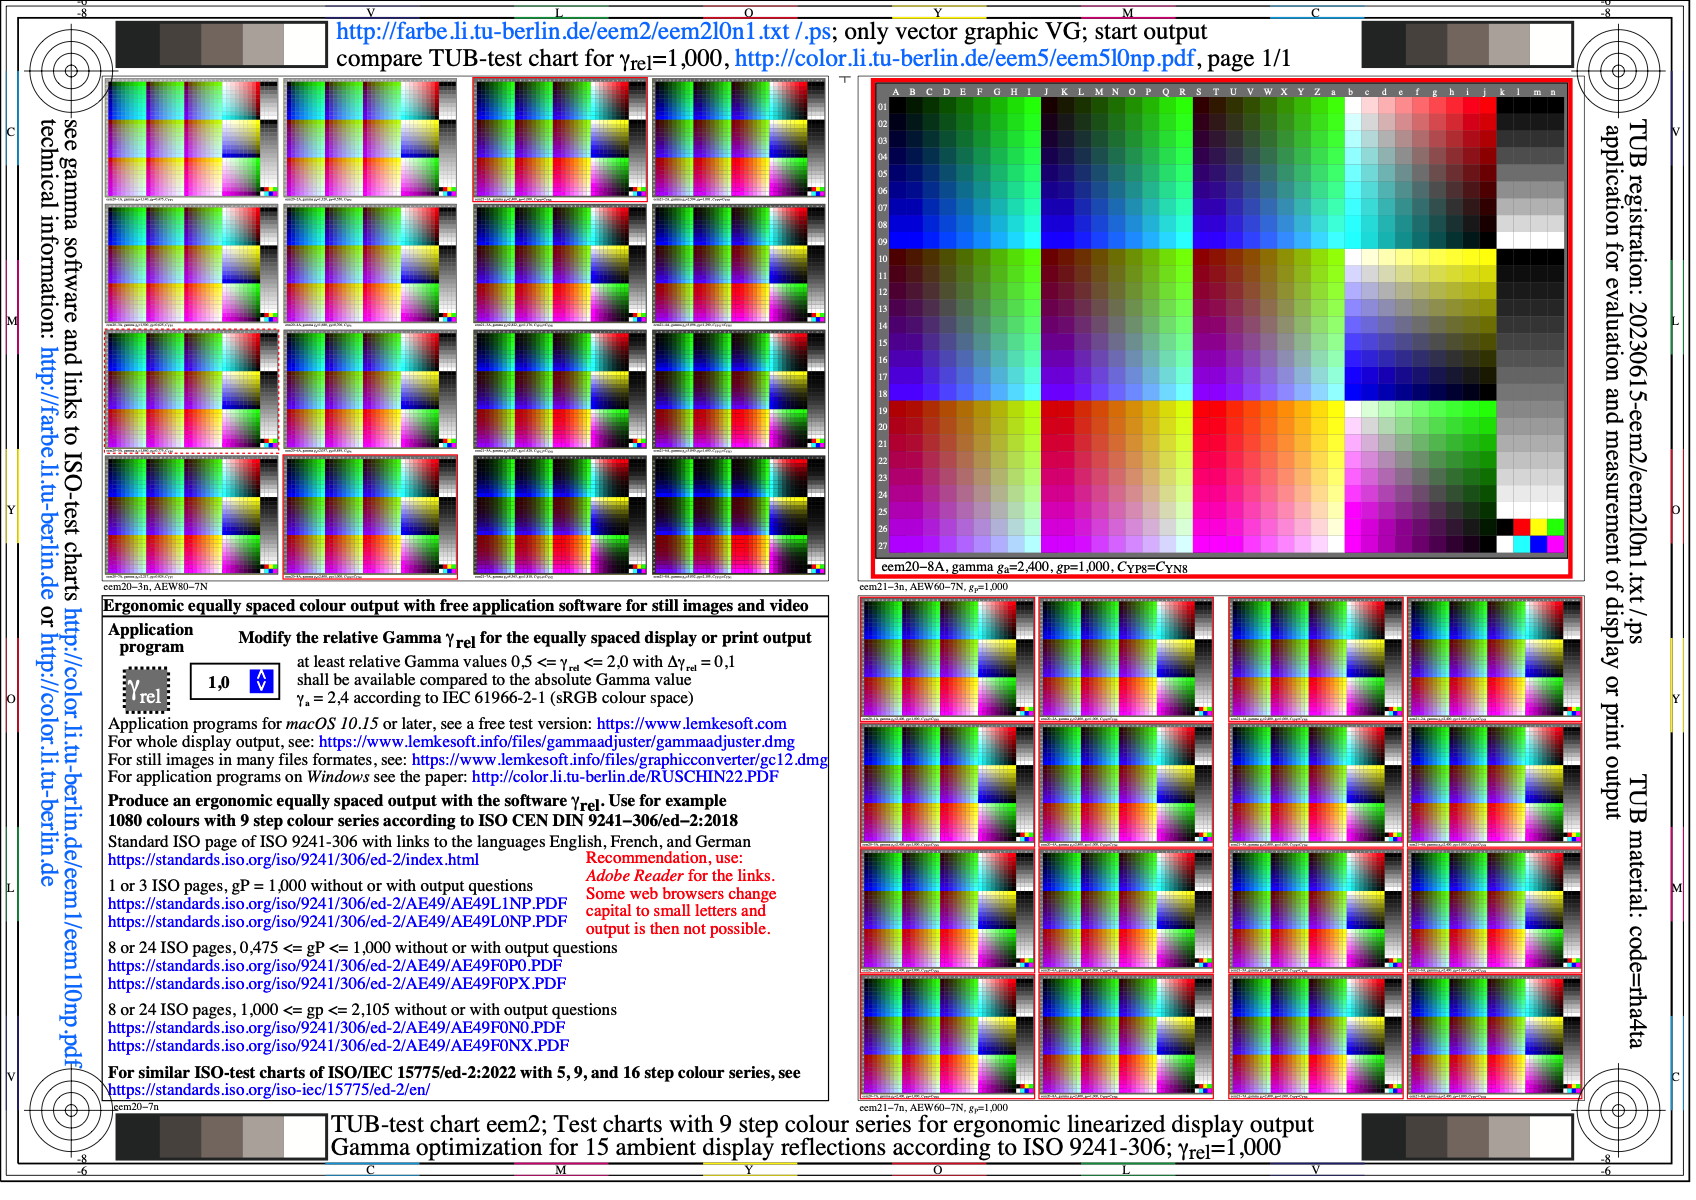
Image eem2l0n1.jpg: Output in format A6 of the file
eem2l0np.pdf, see
eem2l0n1.
PS /
TXT /
PDF /
jpg
eem2: TUB-test chart eem2; 9 step colour series for gamma
optimization for 15 display reflections & contrasts according to
ISO 9241-306:2018 and ISO/IEC 15775:2022; gamma_rel=1,000
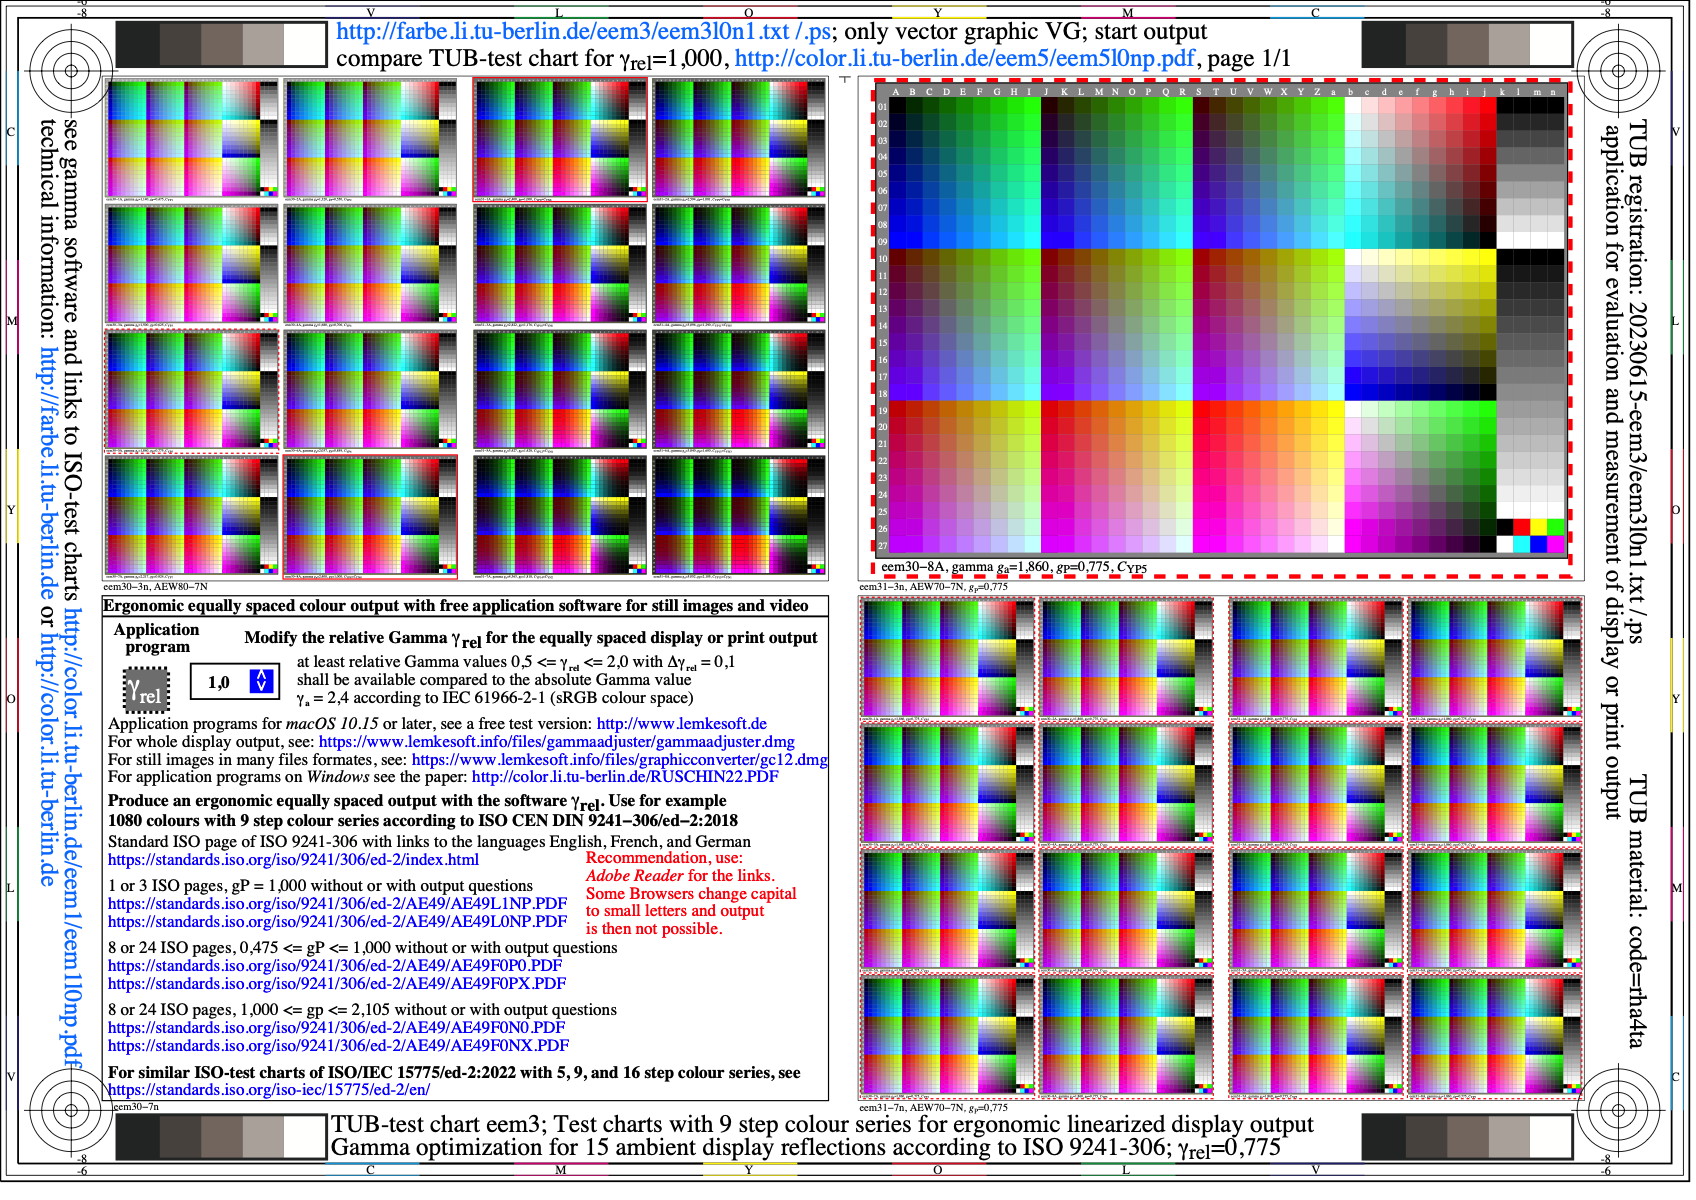
Image eem3l0n1.jpg: Output in format A6 of the file
eem3l0np.pdf, see
eem3l0n1.
PS /
TXT /
PDF /
jpg
eem3: TUB-test chart eem3; 9 step colour series for gamma
optimization for 15 display reflections & contrasts according to
ISO 9241-306:2018 and ISO/IEC 15775:2022; gamma_rel=0,775

Image eem4l0n1.jpg: Output in format A6 of the file
eem4l0np.pdf, see
eem4l0n1.
PS /
TXT /
PDF /
jpg
eem4: TUB-test chart eem4; 9 step colour series for gamma
optimization for 15 display reflections & contrasts according to
ISO 9241-306:2018 and ISO/IEC 15775:2022; 15 gamma_rel
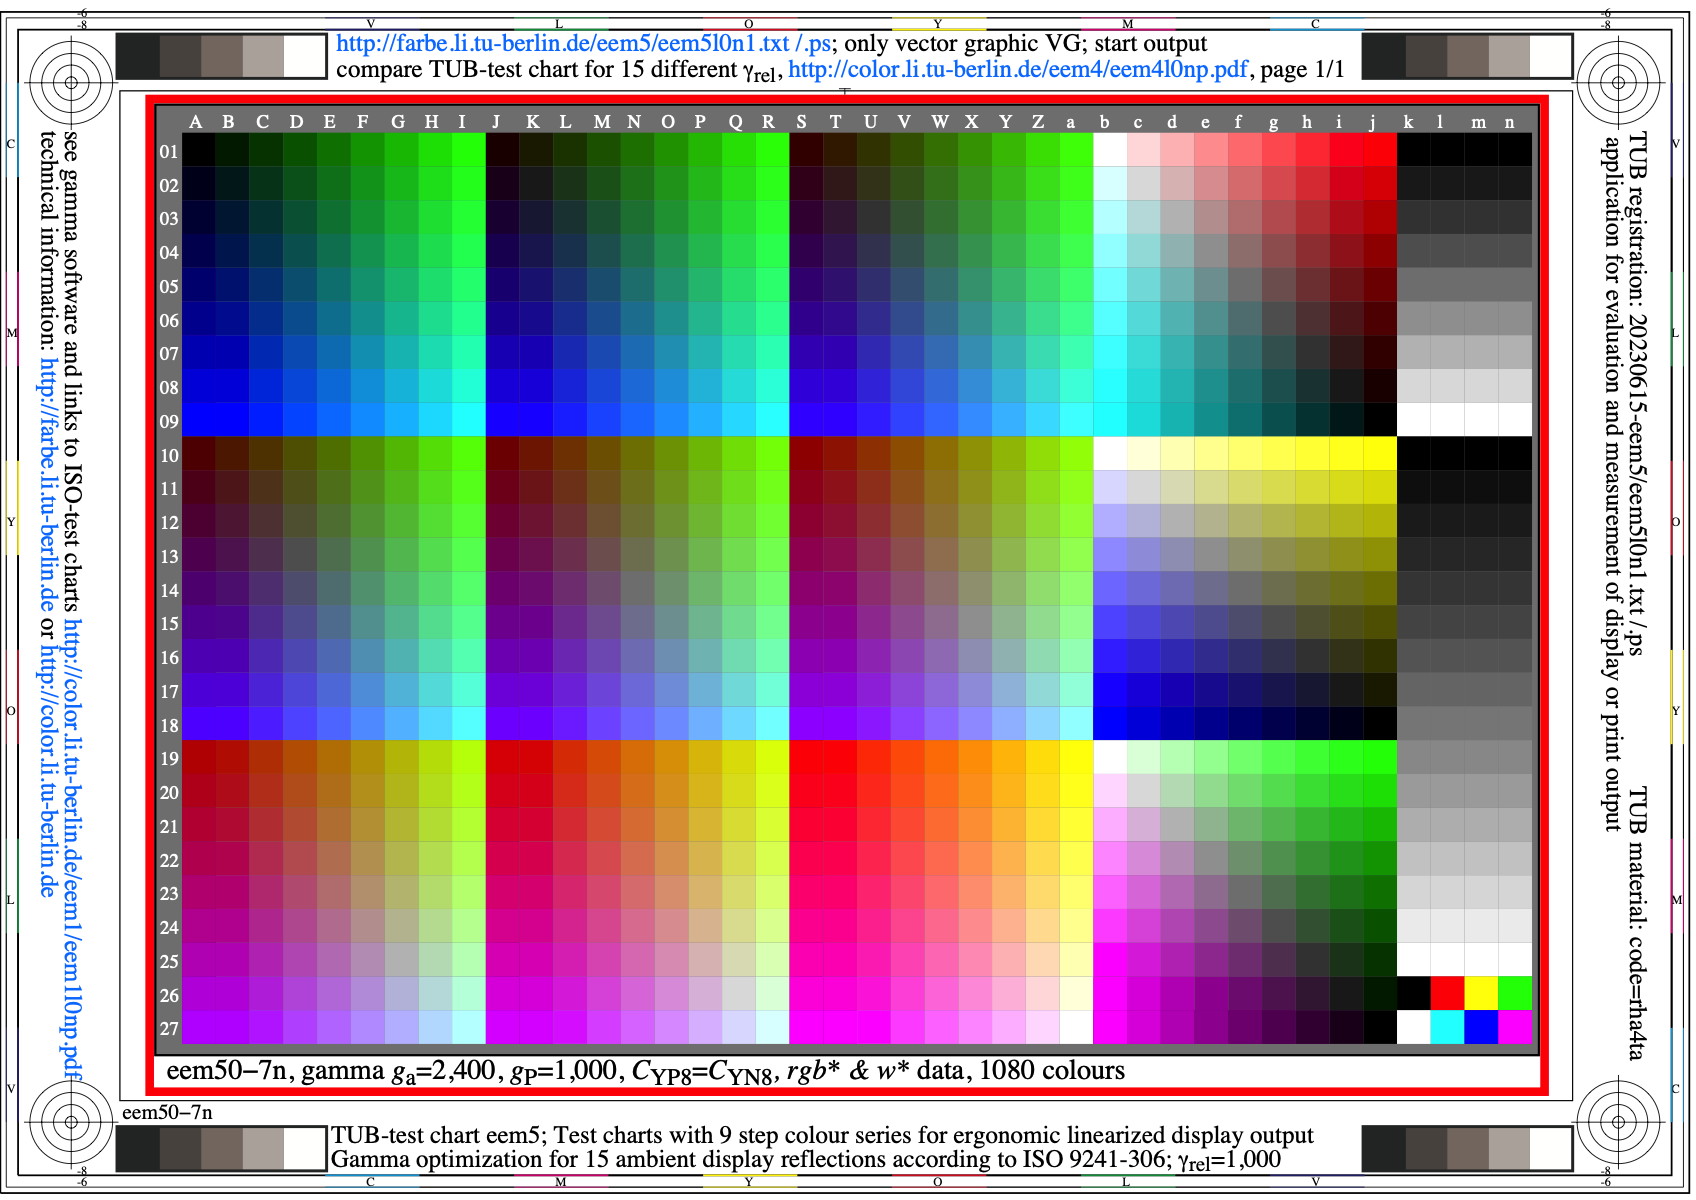
Image eem5l0n1.jpg: Output in format A6 of the file
eem5l0np.pdf, see
eem5l0n1.
PS /
TXT /
PDF /
jpg
eem5: TUB-test chart eem5; 9 step colour series for gamma
optimization for 15 display reflections & contrasts according to
ISO 9241-306:2018 and ISO/IEC 15775:2022; gamma_rel=1,000
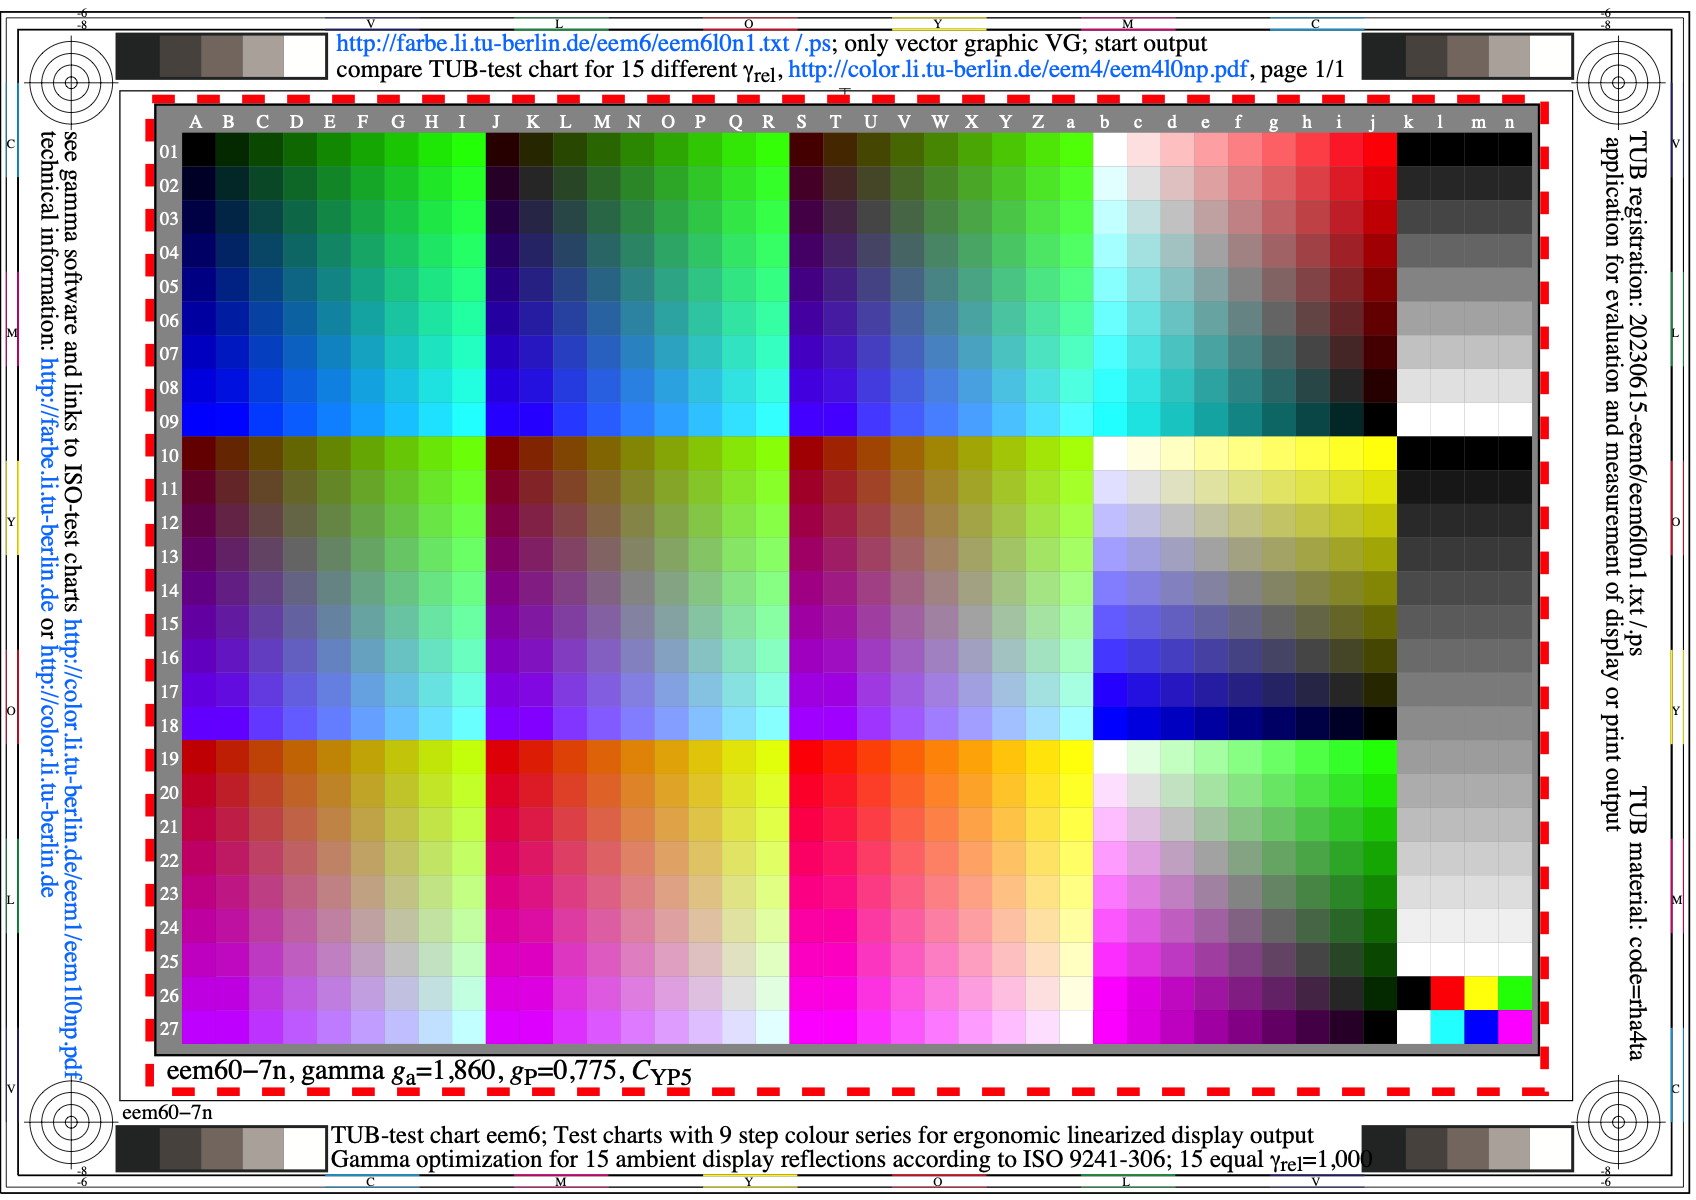
Image eem6l0n1.jpg: Output in format A6 of the file
eem6l0np.pdf, see
eem6l0n1.
PS /
TXT /
PDF /
jpg
eem6: TUB-test chart eem6; 9 step colour series for gamma
optimization for 15 display reflections & contrasts according to
ISO 9241-306:2018 and ISO/IEC 15775:2022; gamma_rel=0,775
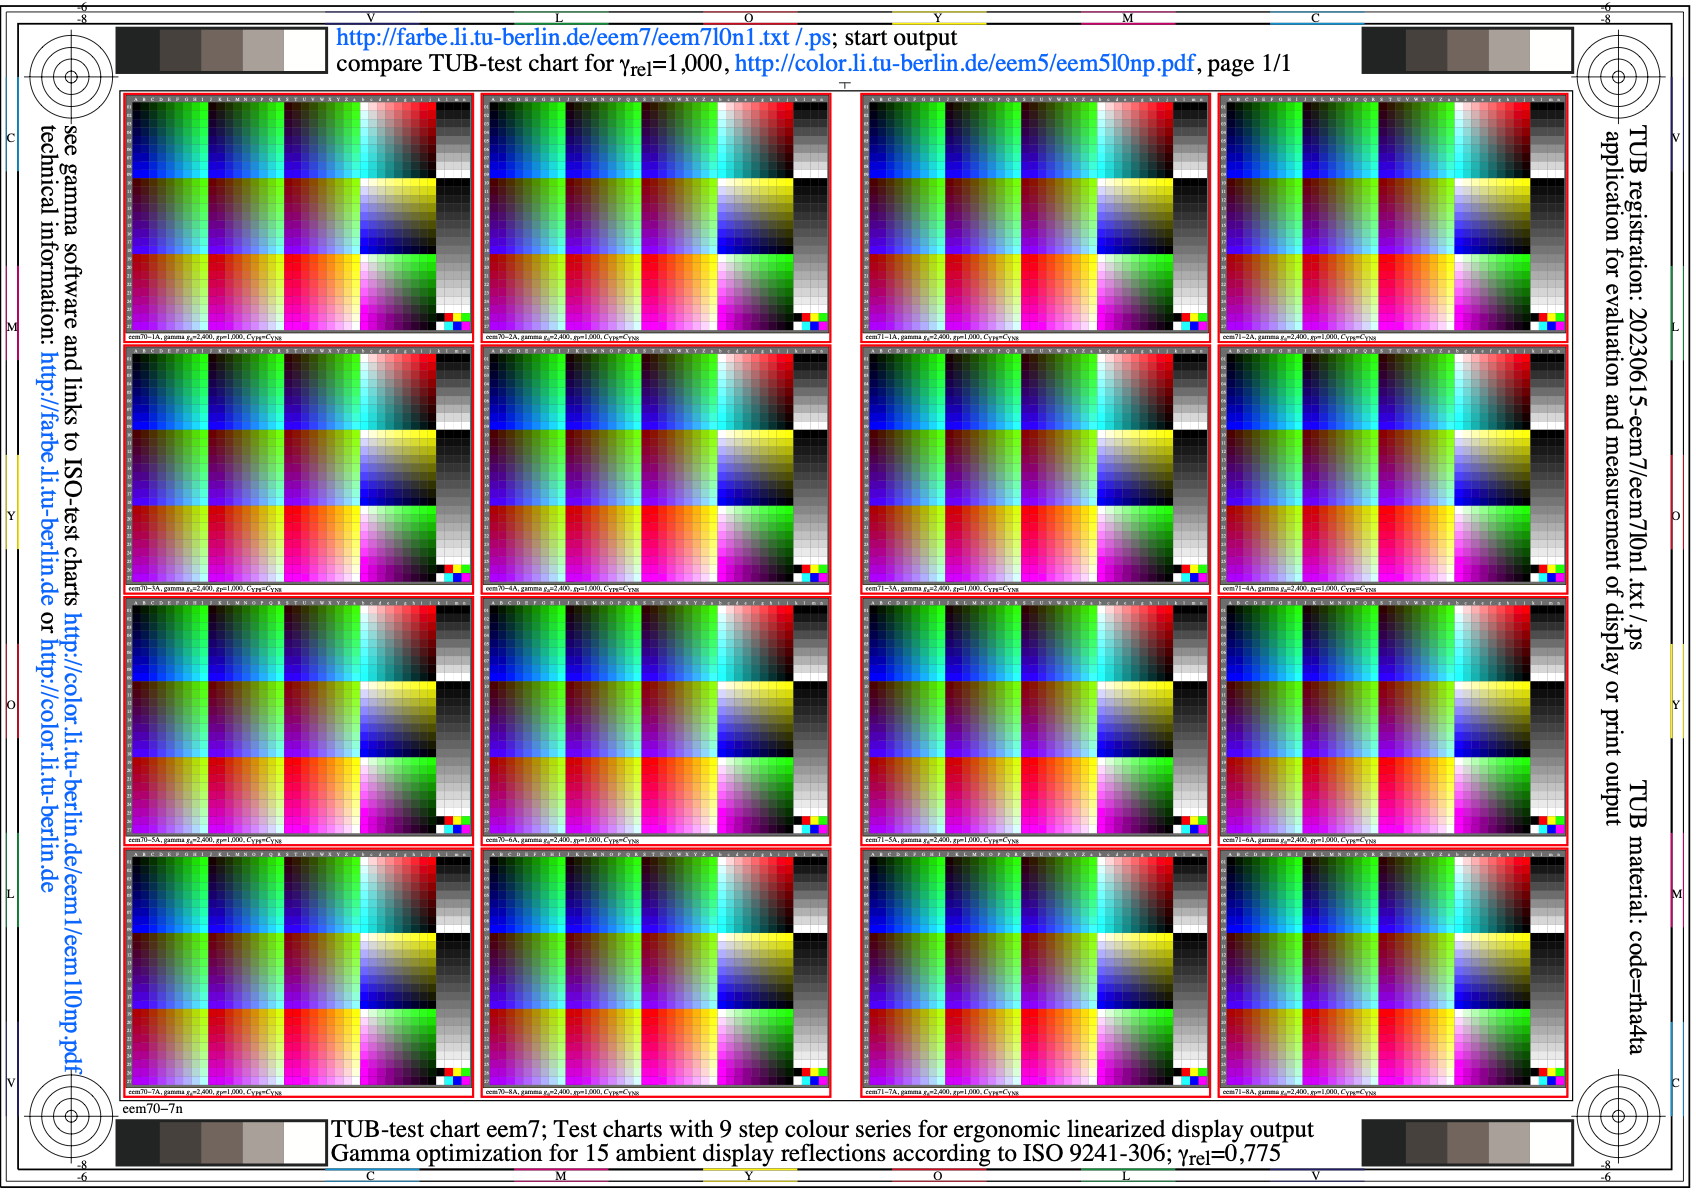
Image eem7l0n1.jpg: Output in format A6 of the file
eem7l0np.pdf, see
eem7l0n1.
PS /
TXT /
PDF /
jpg
eem7: TUB-test chart eem7; 9 step colour series for gamma
optimization for 15 display reflections & contrasts according to
ISO 9241-306 and ISO/IEC 15775; 15 equal gamma_rel=1,000
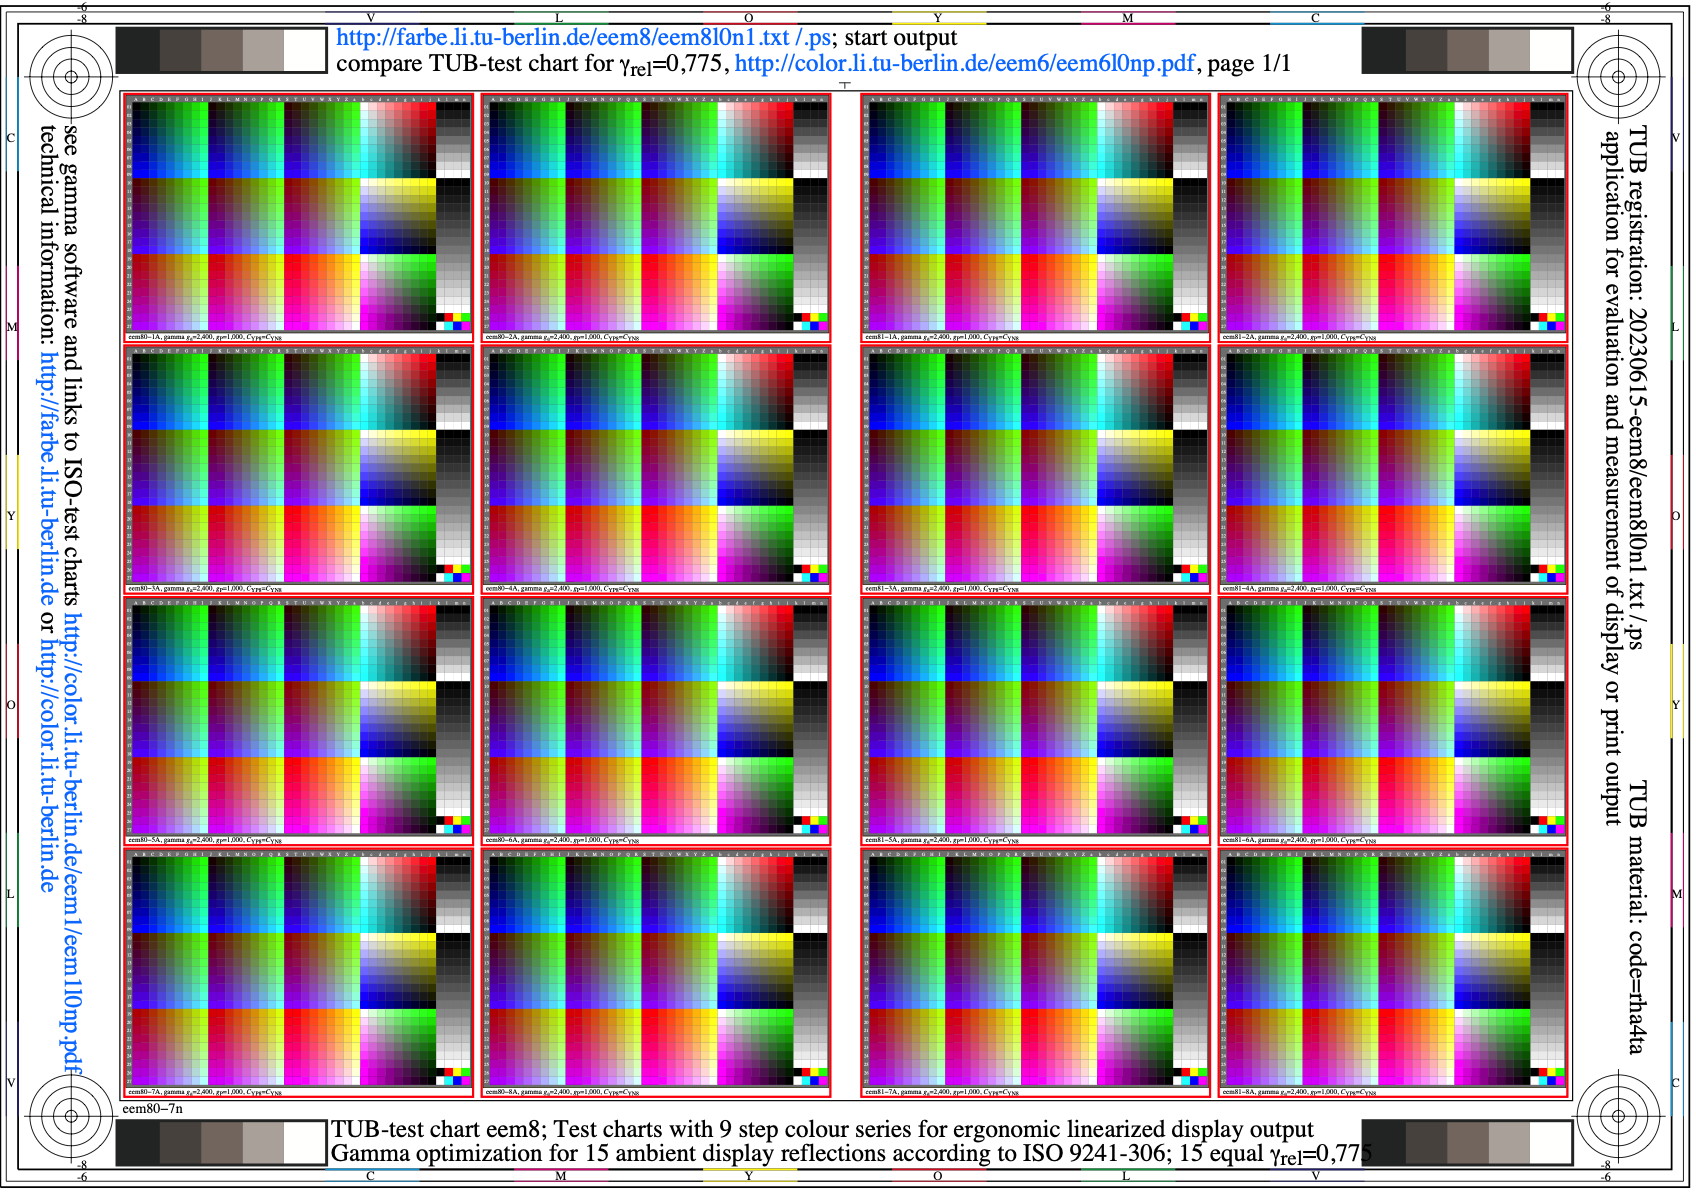
Image eem8l0n1.jpg: Output in format A6 of the file
eem8l0np.pdf, see
eem8l0n1.
PS /
TXT /
PDF /
jpg
eem8: TUB-test chart eem8; 9 step colour series for gamma
optimization for 15 display reflections & contrasts according to
ISO 9241-306 and ISO/IEC 15775; 15 equal gamma_rel=0,775
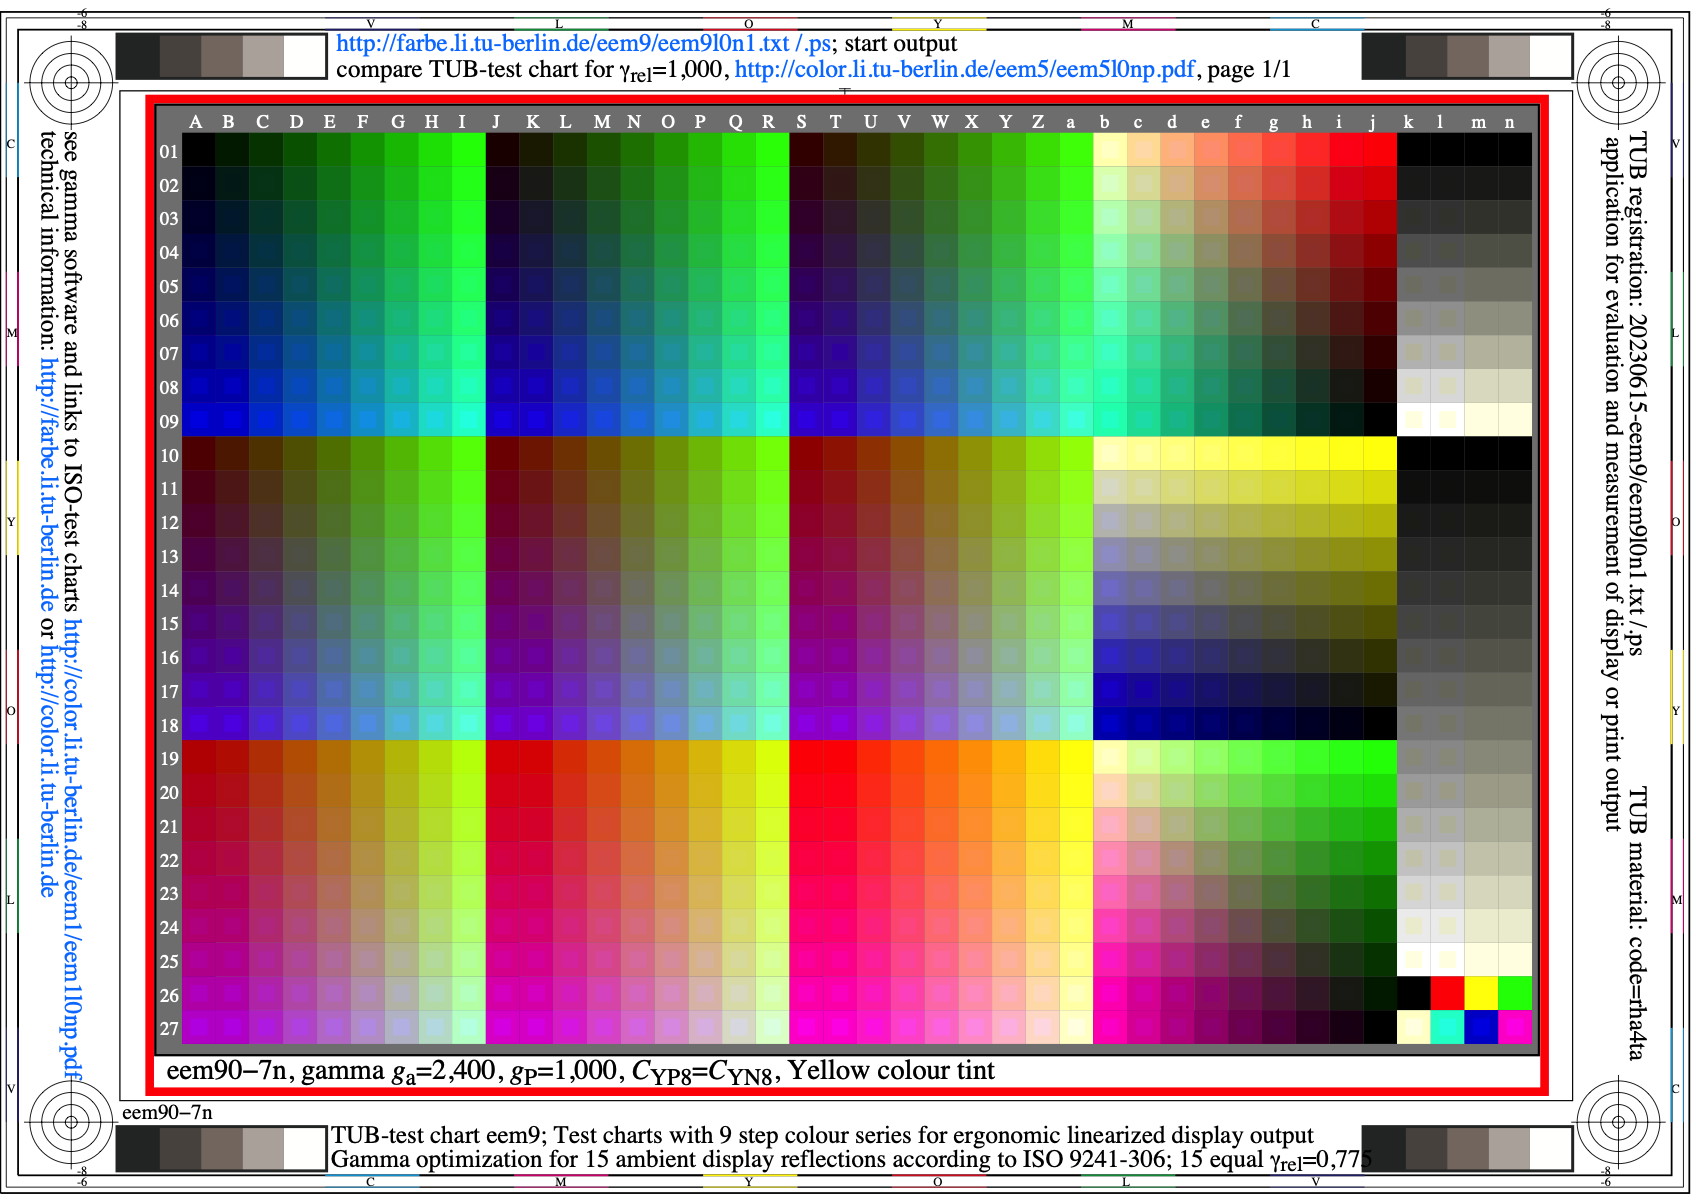
Image eem9l0n1.jpg: Output in format A6 of the file
eem9l0np.pdf, see
eem9l0n1.
PS /
TXT /
PDF /
jpg
eem9: TUB-test chart eem9; 9 step colour series for gamma
optimization for 15 display reflections & contrasts according to
ISO 9241-306 and ISO/IEC 15775; gamma_rel=1,000, yellow tint
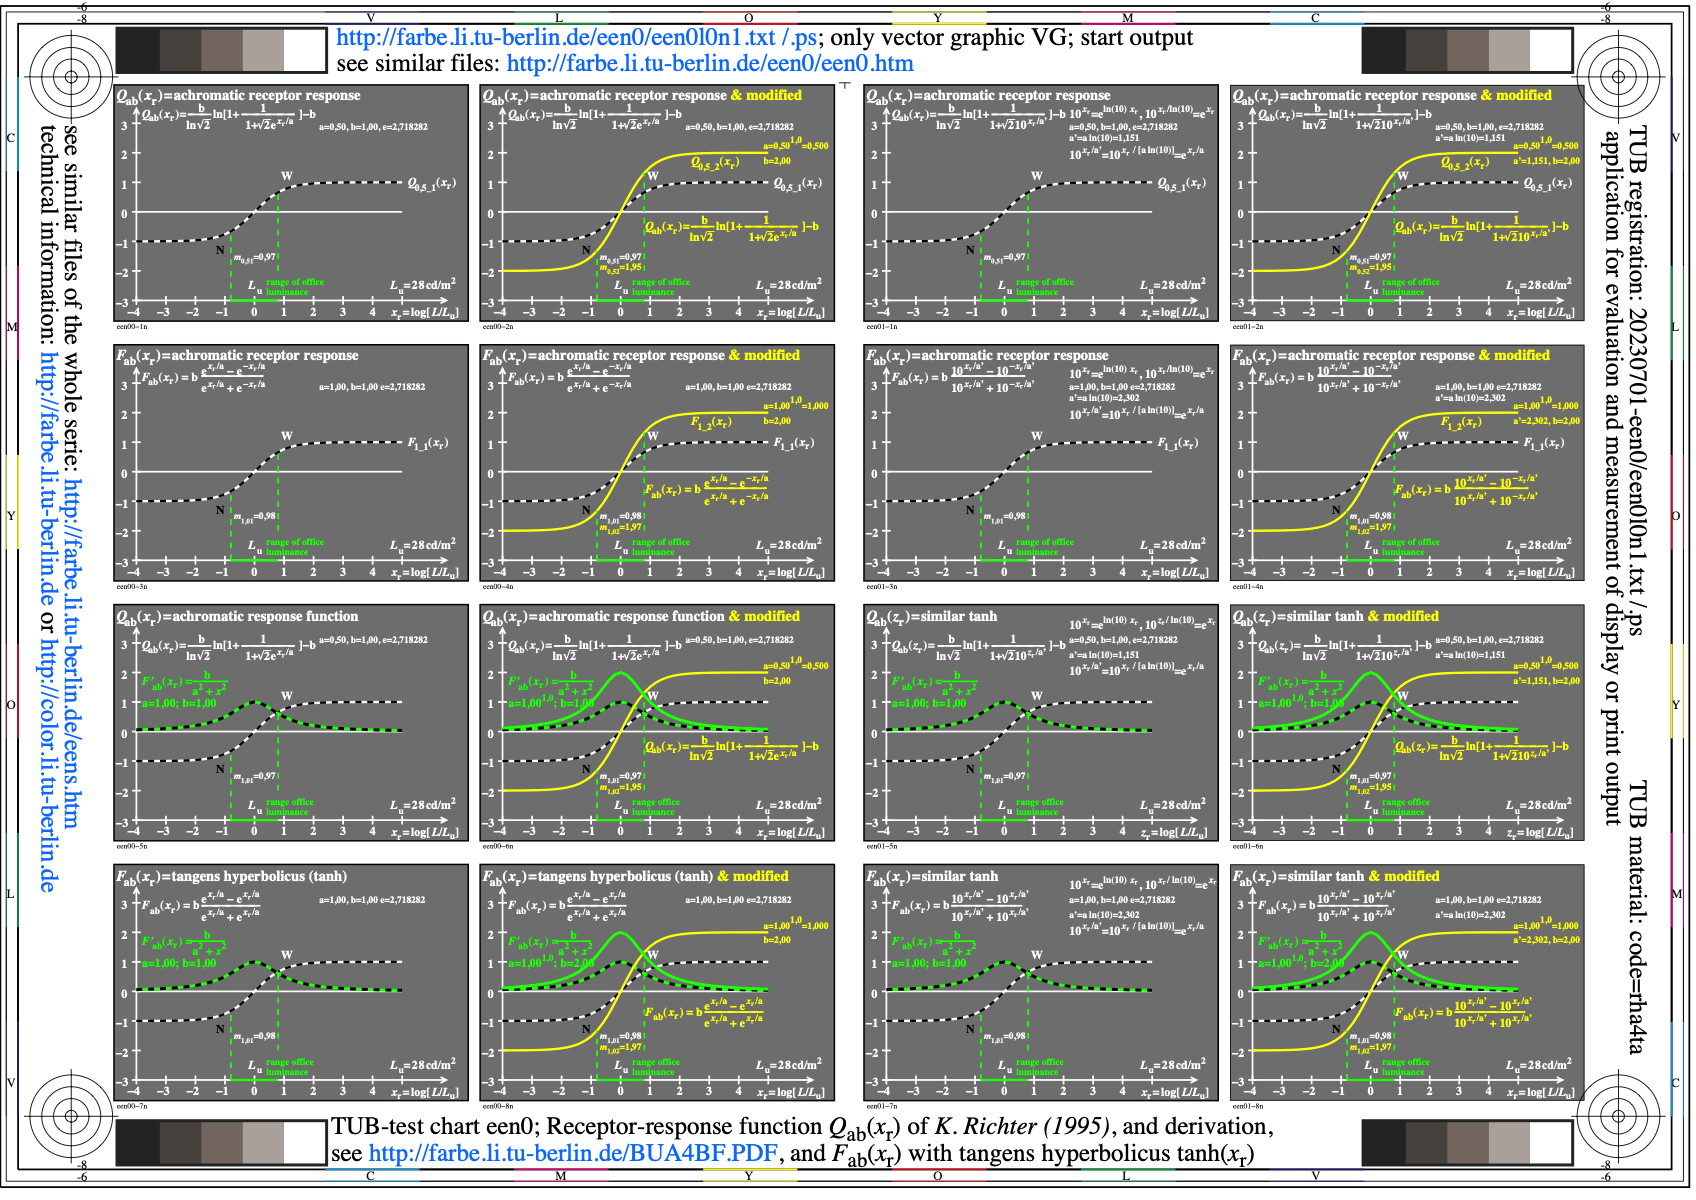
Image een0l0n1.jpg: Output in format A6 of the file
een0l0np.pdf, see
een0l0n1.
PS /
TXT /
PDF /
jpg
een0: TUB-test chart een0; Receptor-response function of Richter
(1995), see http://color.li.tu-berlin.de/BUA4BF.PDF
and function with tanh, both functions with derivation
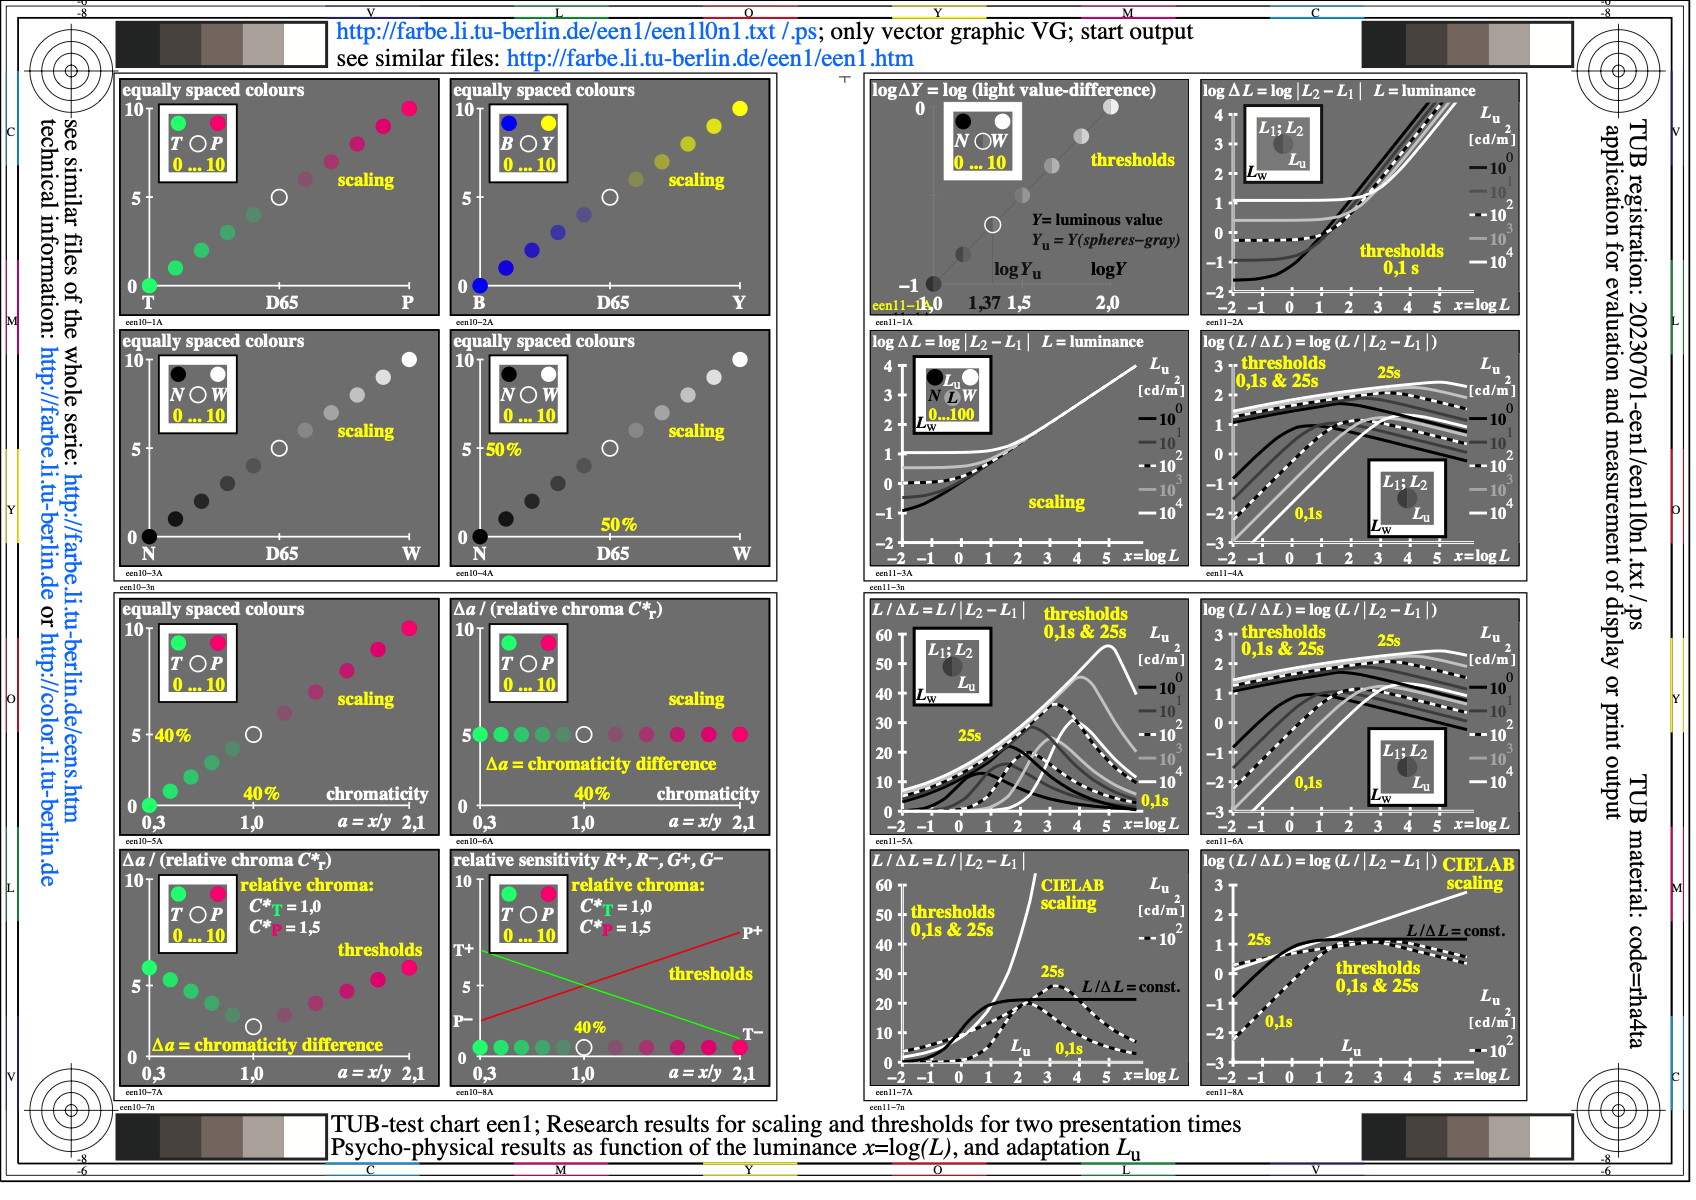
Image een1l0n1.jpg: Output in format A6 of the file
een1l0np.pdf, see
een1l0n1.
PS /
TXT /
PDF /
jpg
een1: TUB-test chart een1; Research results for scaling, thresholds
and for 2 presentation times; psycho-physical models,
and relative luminance x=log(L/Lu) and adaptation Lu
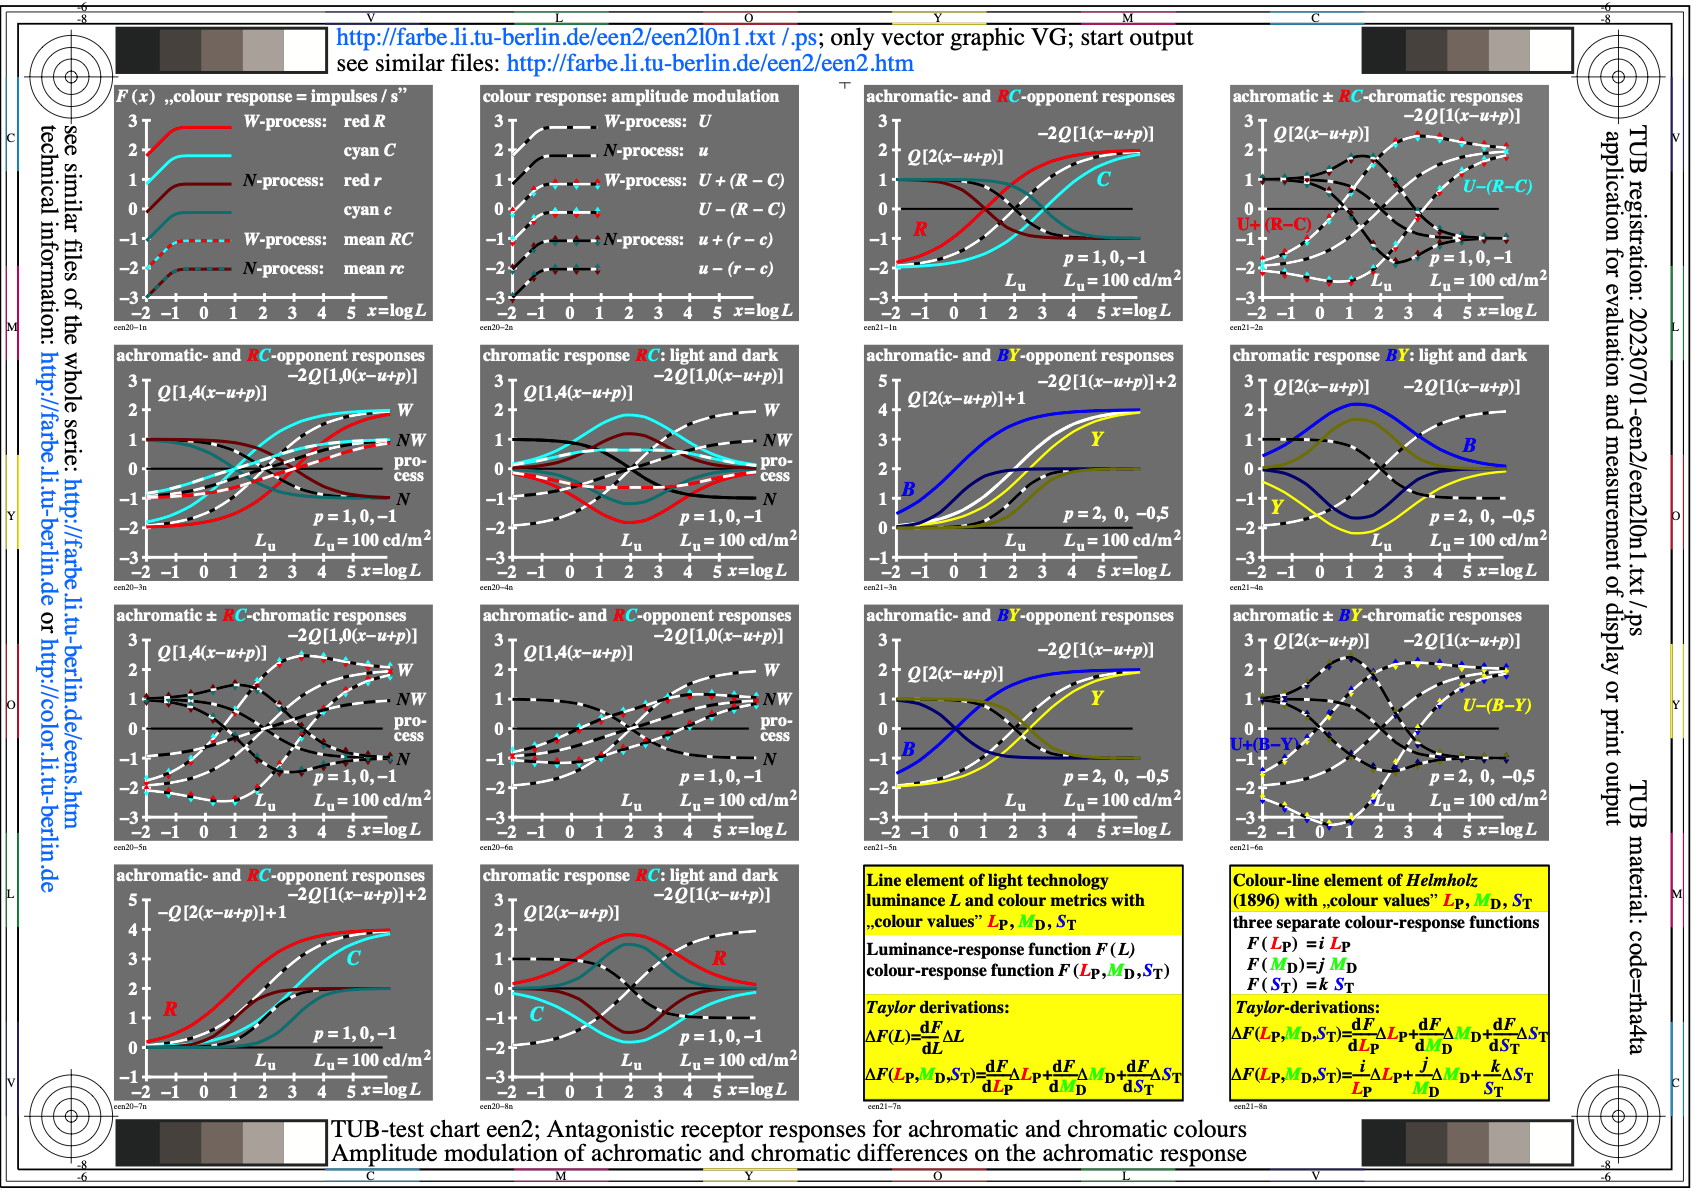
Image een2l0n1.jpg: Output in format A6 of the file
een2l0np.pdf, see
een2l0n1.
PS /
TXT /
PDF /
jpg
een2: TUB-test chart een2; Antagonistic receptor responses
for achromatic and chromatic colours; amplitude modulation of
achromatic and chromatic differences on achromatic responses
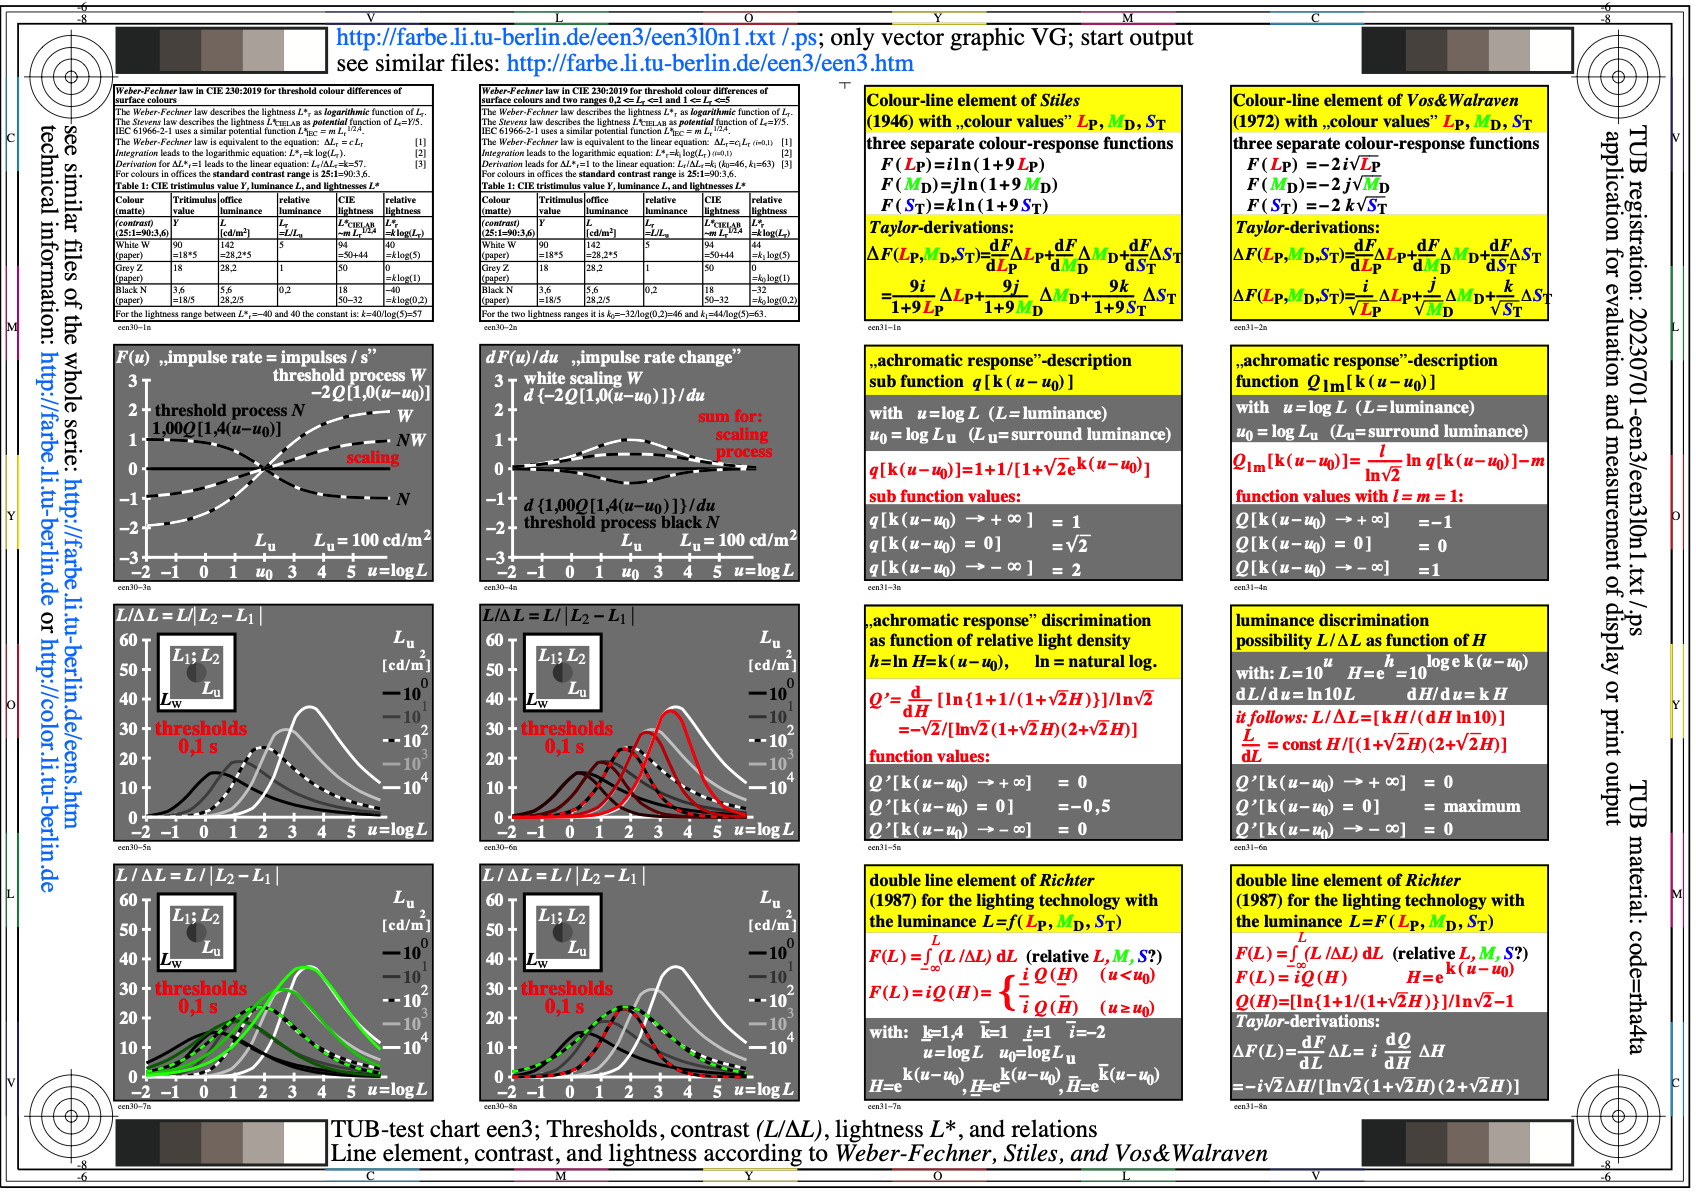
Image een3l0n1.jpg: Output in format A6 of the file
een3l0np.pdf, see
een3l0n1.
PS /
TXT /
PDF /
jpg
een3: TUB-test chart een3; Threshold, contrast L/delta_L,
and lightness L* with internal attribute relations.
Line element, contrast, lightness of Weber-Fechner & Stiles
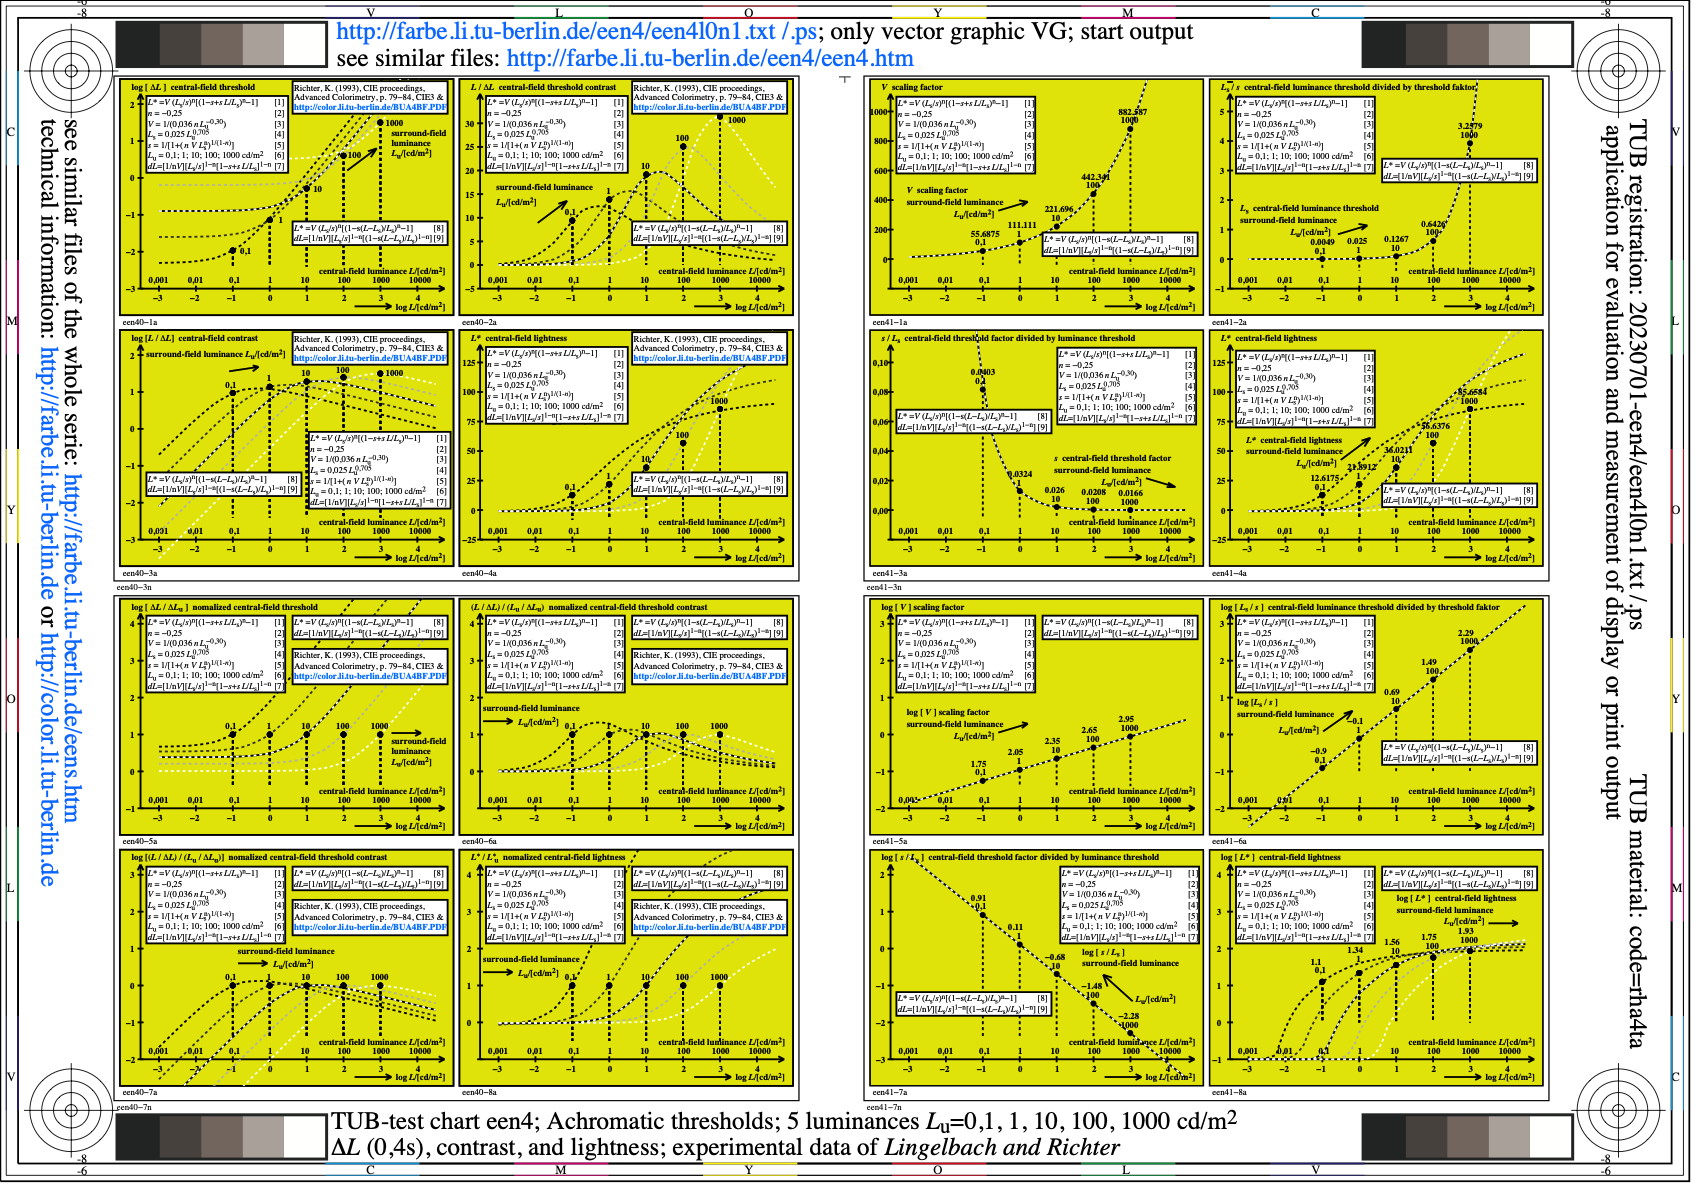
Image een4l0n1.jpg: Output in format A6 of the file
een4l0np.pdf, see
een4l0n1.
PS /
TXT /
PDF /
jpg
een4: TUB-test chart een4; Achromatic thresholds for 5 Lu,
thresholds delta_L (0,4s), contrast and lightness;
experimental data of Lingelbach and Richter
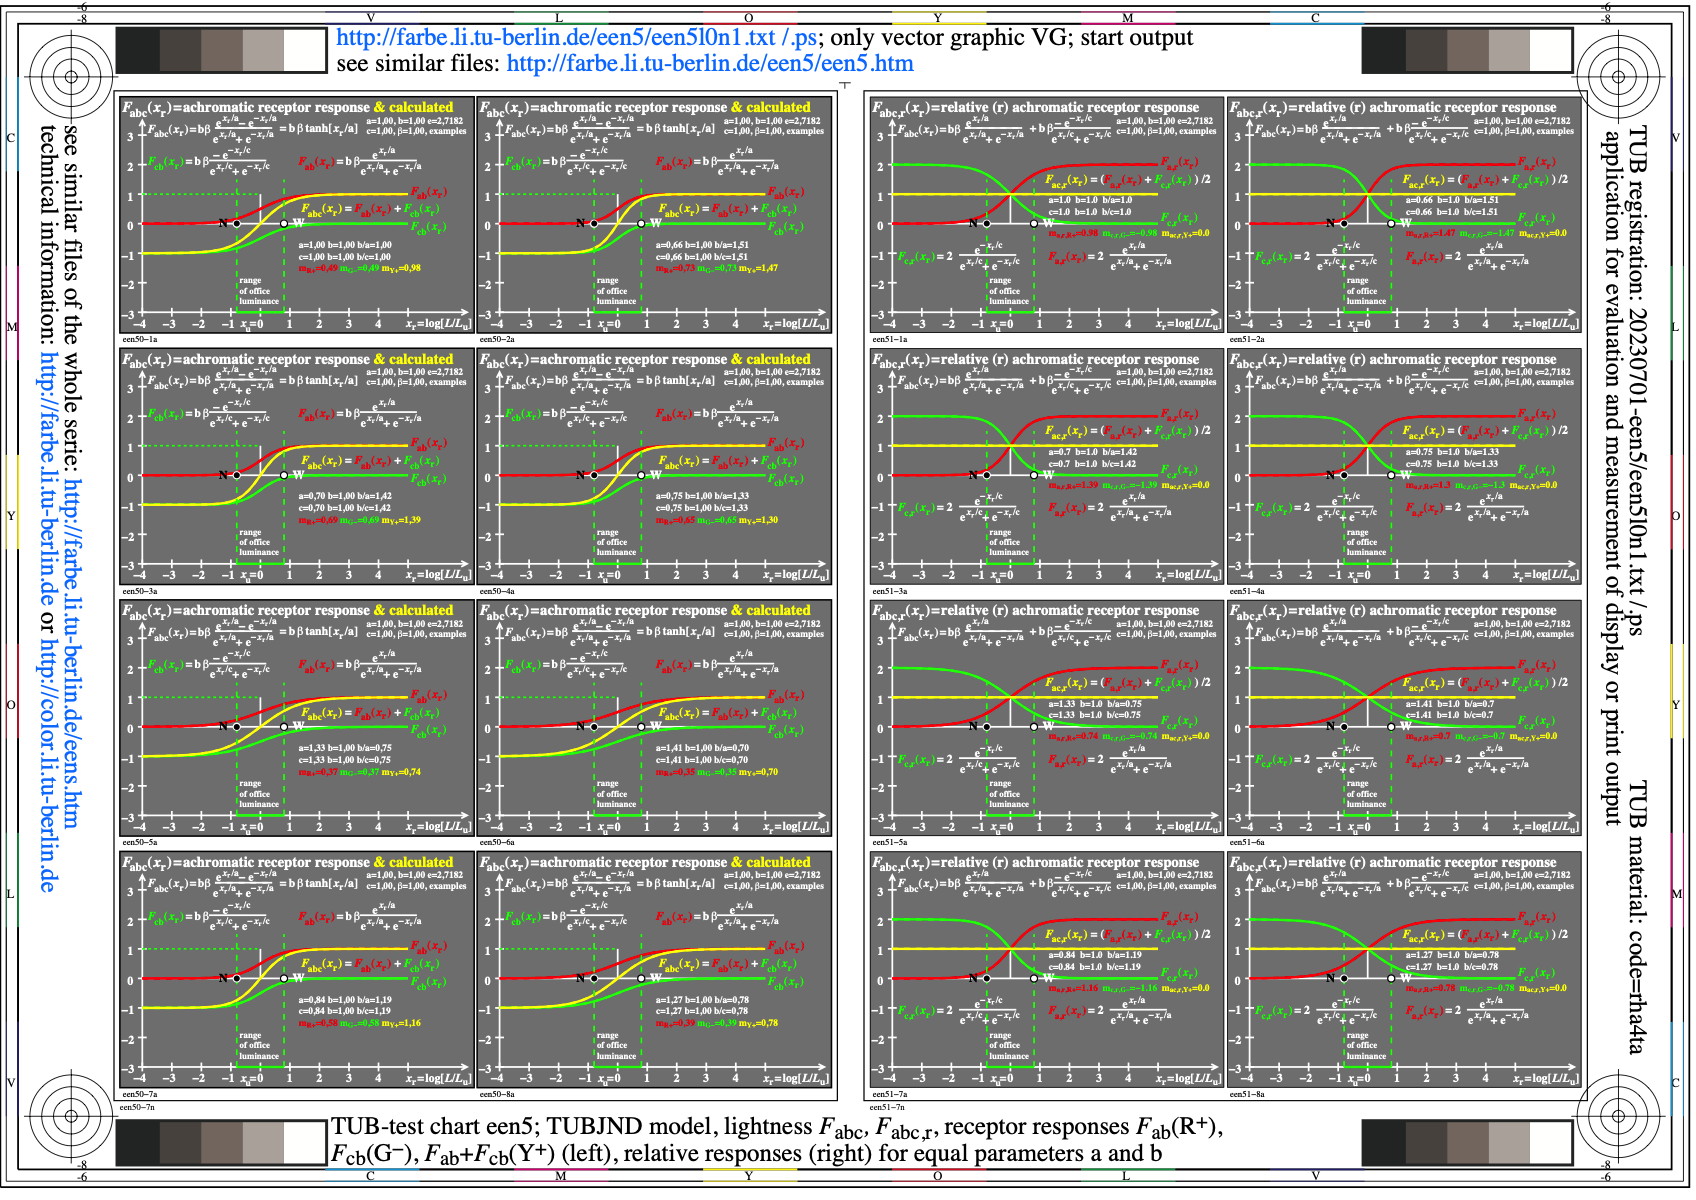
Image een5l0n1.jpg: Output in format A6 of the file
een5l0np.pdf, see
een5l0n1.
PS /
TXT /
PDF /
jpg
een5: TUB-test chart een5; TUBJND model, lightness Fabc, Fabc,r,
receptor responses Fab (R+), Fcb (G-), Fab+Fcb (Y+) (left),
and relative (right) for equal parameters a and b
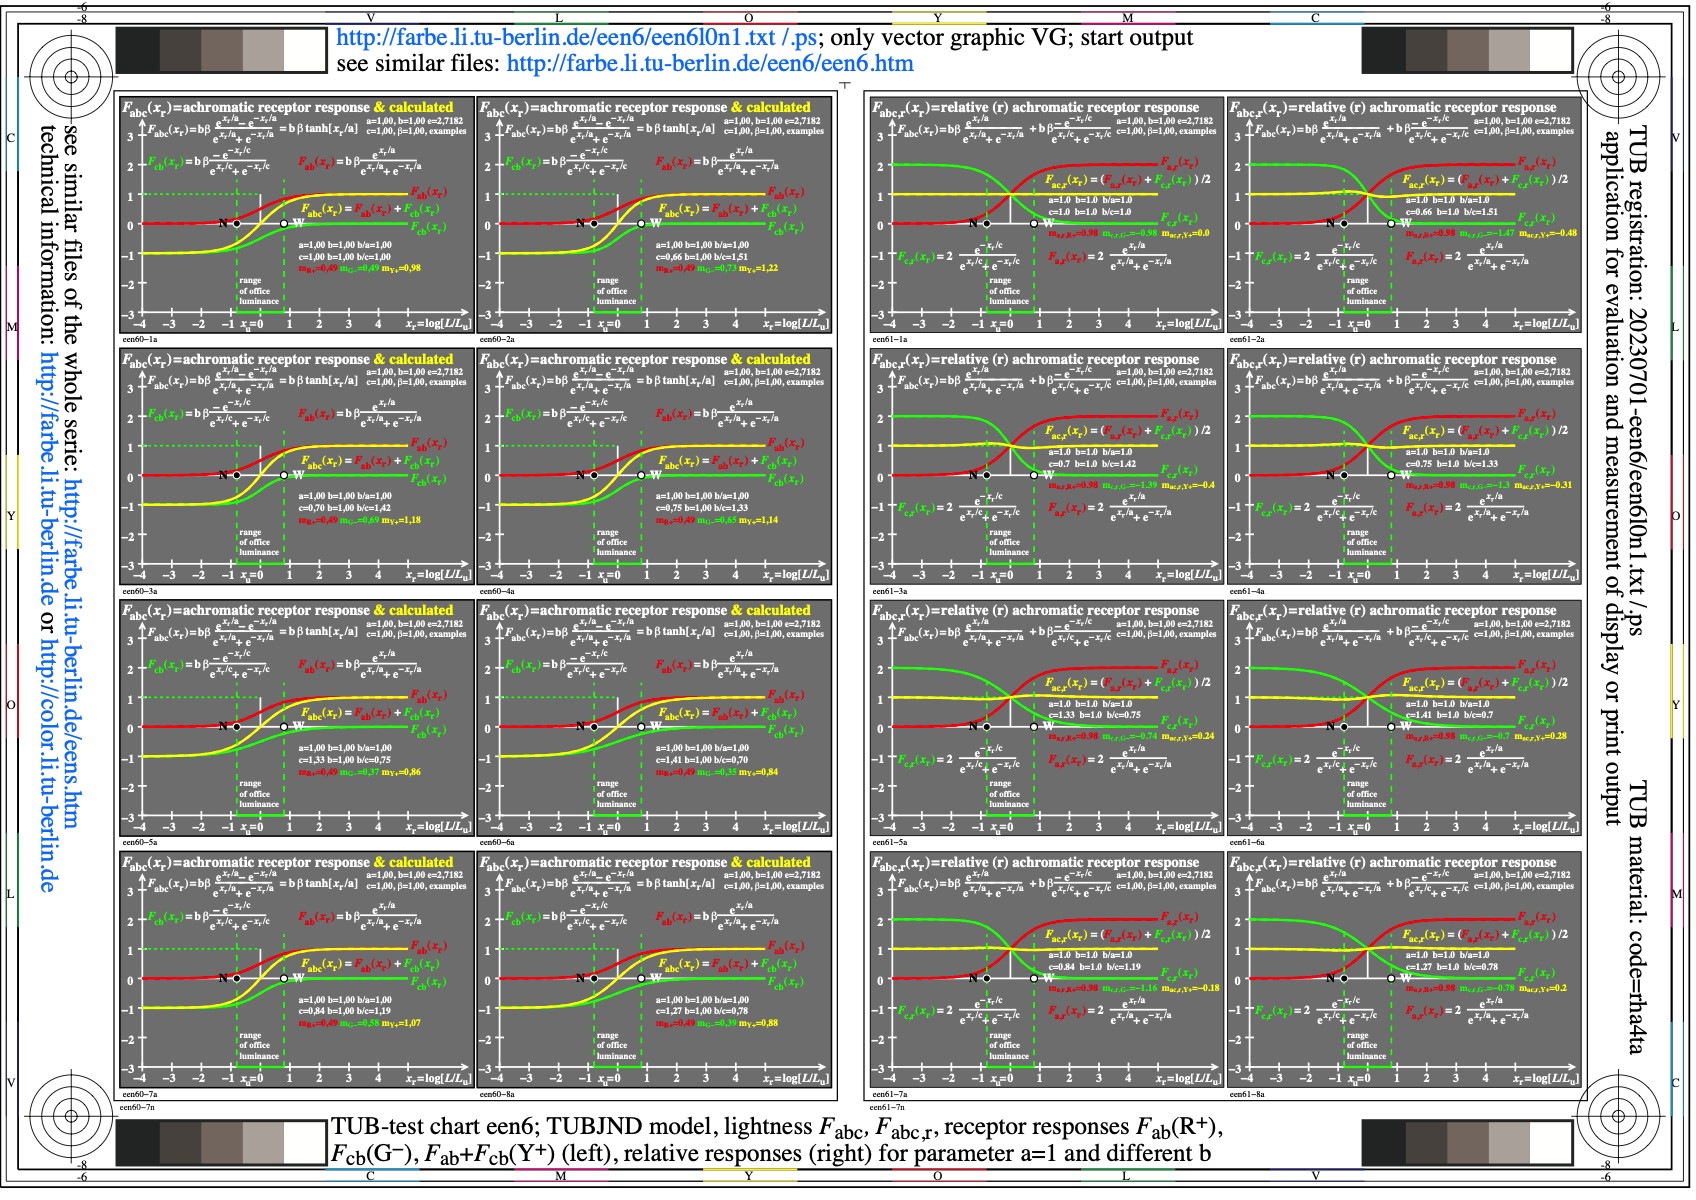
Image een6l0n1.jpg: Output in format A6 of the file
een6l0np.pdf, see
een6l0n1.
PS /
TXT /
PDF /
jpg
een6: TUB-test chart een6; TUBJND model, lightness Fabc, Fabc,r,
receptor responses Fab (R+), Fcb (G-), Fab+Fcb (Y+) (left),
and relative (right) for parameters a=1 and different b

Image een7l0n1.jpg: Output in format A6 of the file
een7l0np.pdf, see
een7l0n1.
PS /
TXT /
PDF /
jpg
een7: TUB-test chart een7; TUBJND model, lightness Fabc, Fabc,r,
receptor responses Fab (R+), Fcb (G-), Fab+Fcb (Y+) (left),
and relative (right) for different parameters a and b
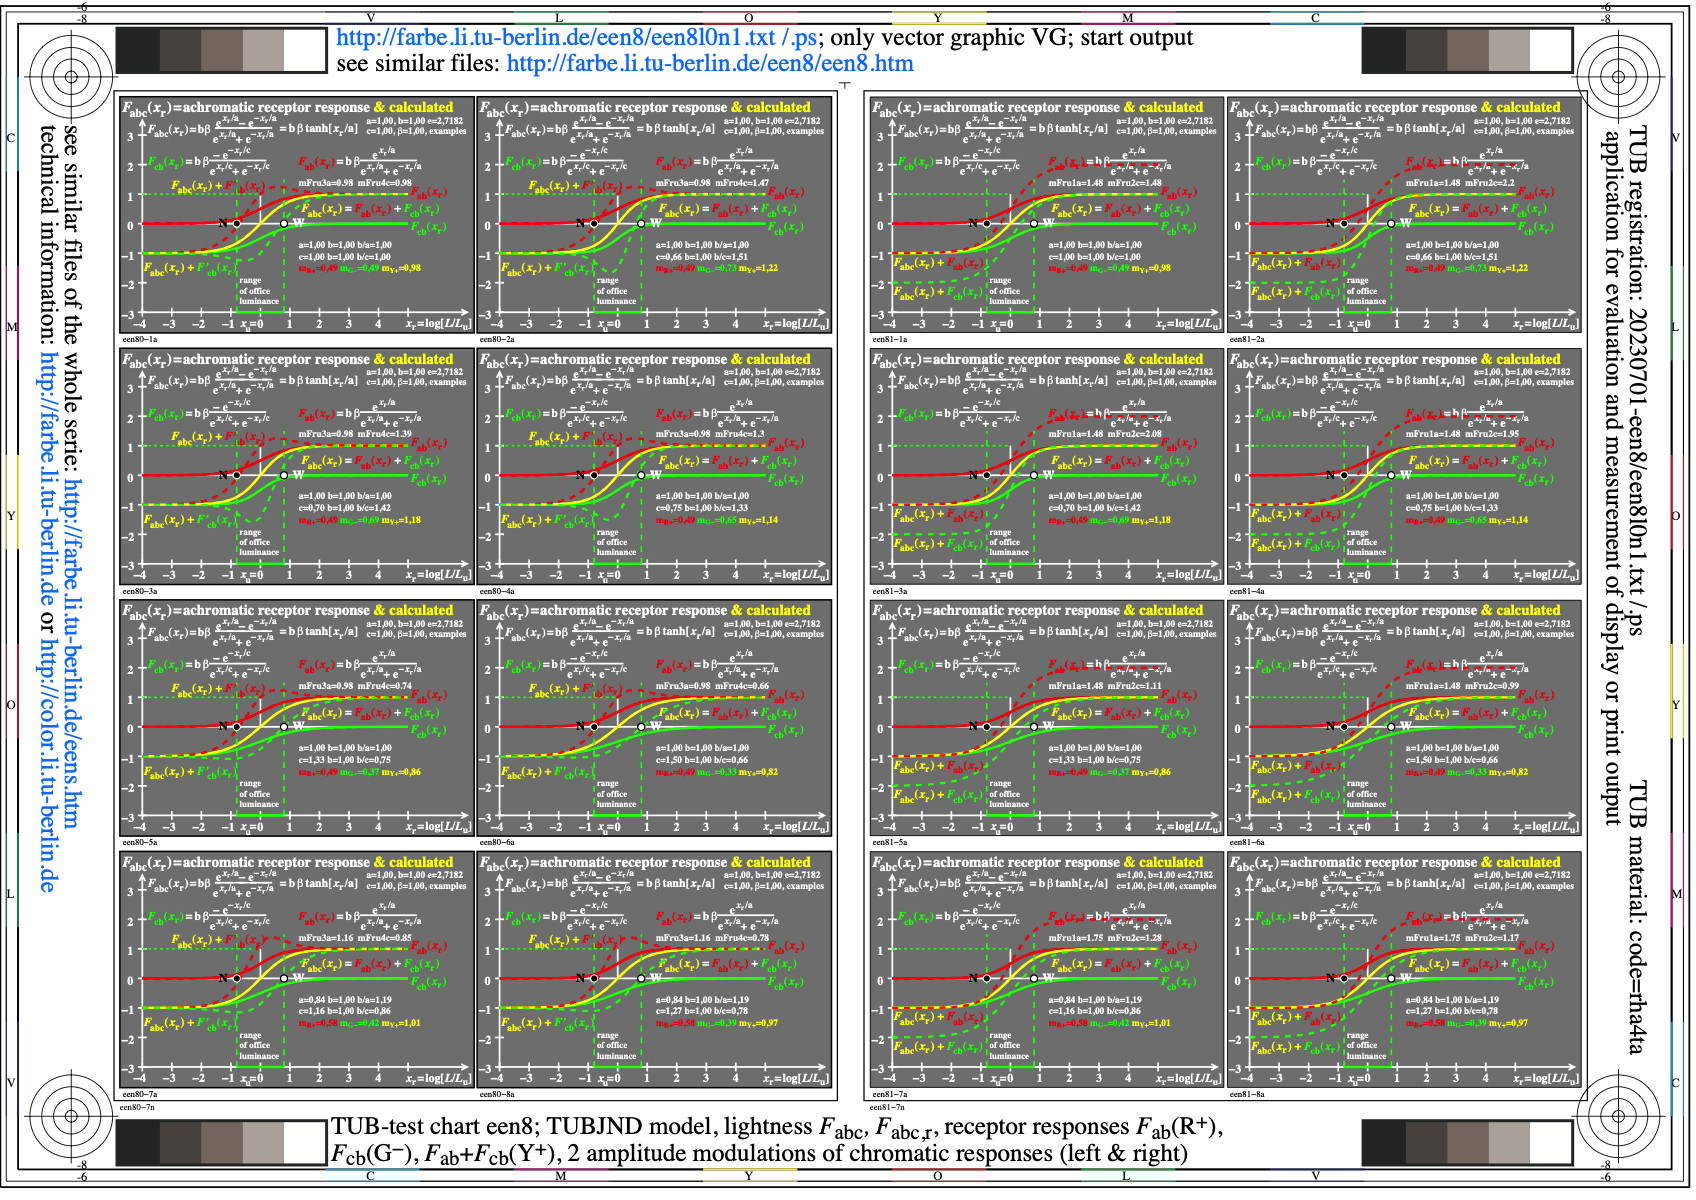
Image een8l0n1.jpg: Output in format A6 of the file
een8l0np.pdf, see
een8l0n1.
PS /
TXT /
PDF /
jpg
een8: TUB-test chart een8; TUBJND model, lightness Fabc, Fabc,r,
receptor responses Fab(R+), Fcb(G-), Fab+Fcb(Y+) (left & right),
2 amplitude modulations of chromatic responses (left & right)
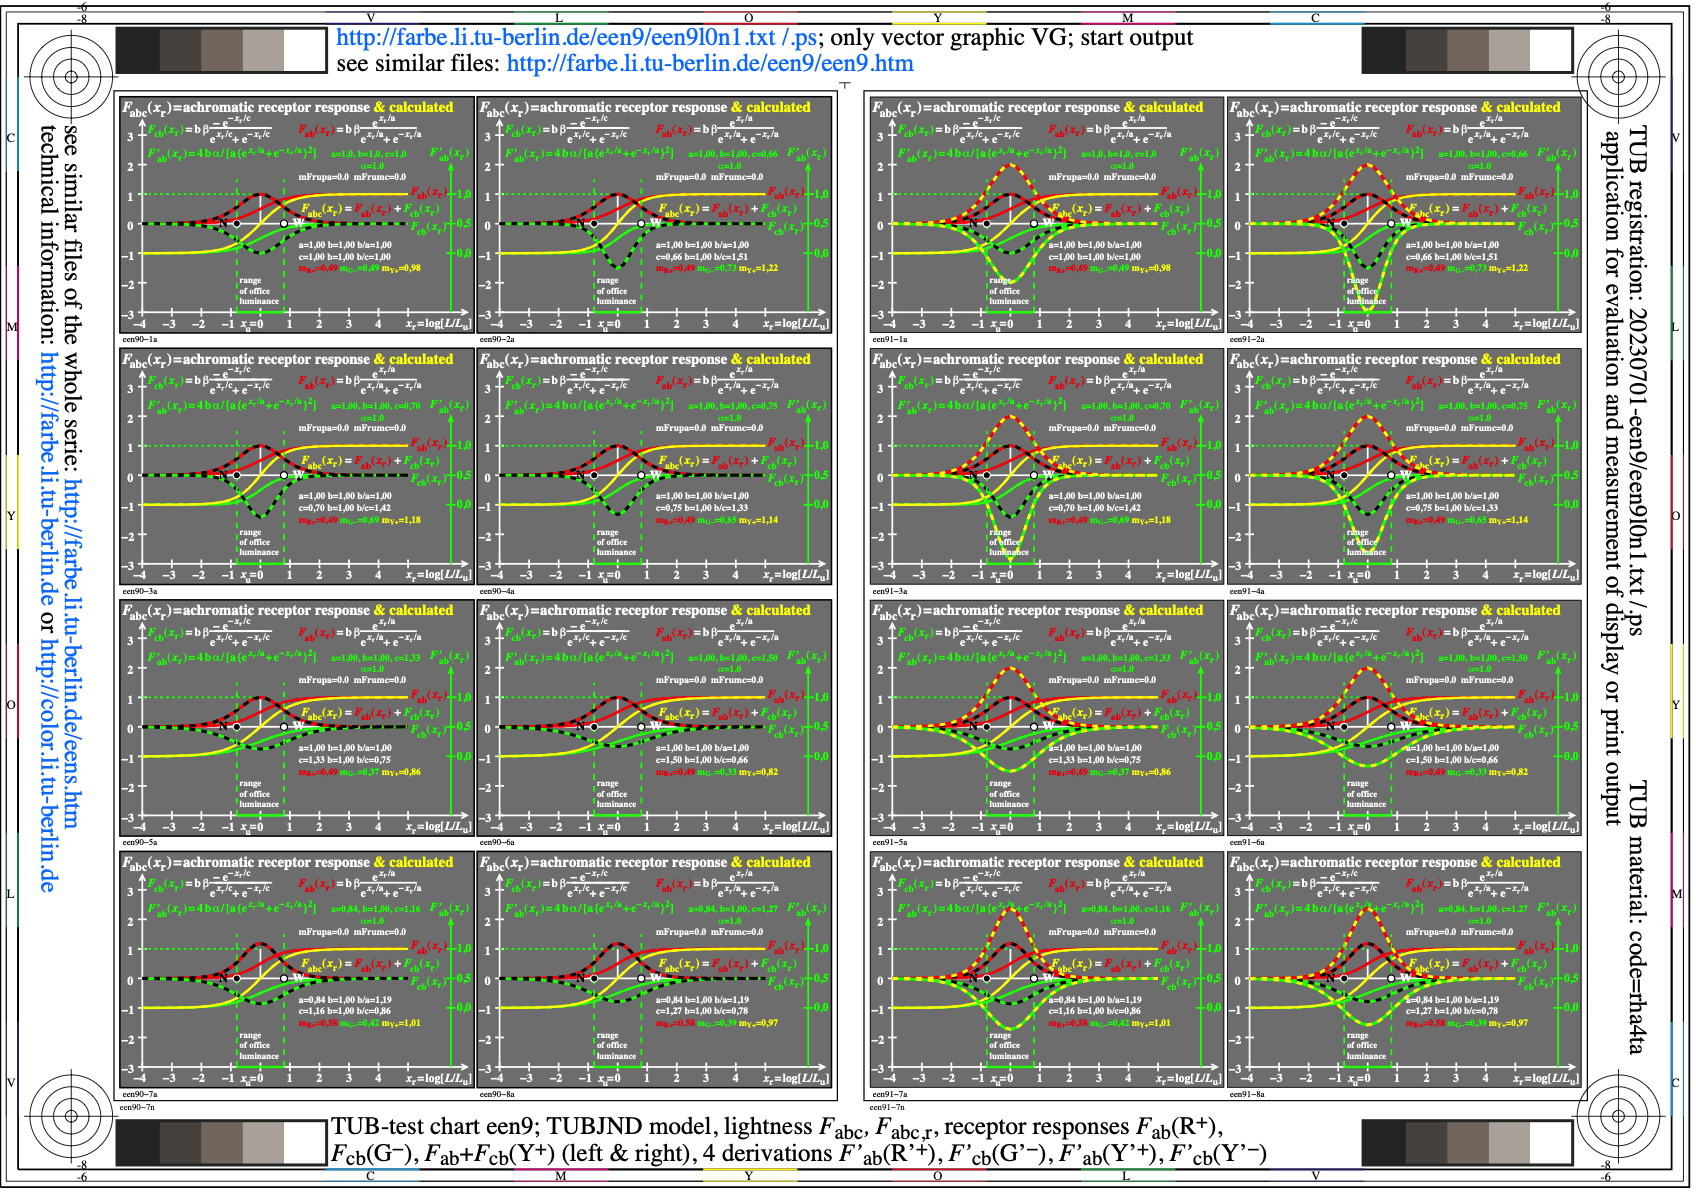
Image een9l0n1.jpg: Output in format A6 of the file
een9l0np.pdf, see
een9l0n1.
PS /
TXT /
PDF /
jpg
een9: TUB-test chart een9; TUBJND model, lightness Fabc, Fabc,r,
receptor responses Fab(R+), Fcb(G-), Fab+Fcb(Y+) (left & right),
4 derivations F'ab (R'+), F'cb (G'-), F'ab (Y'+), F'cb (Y'-)
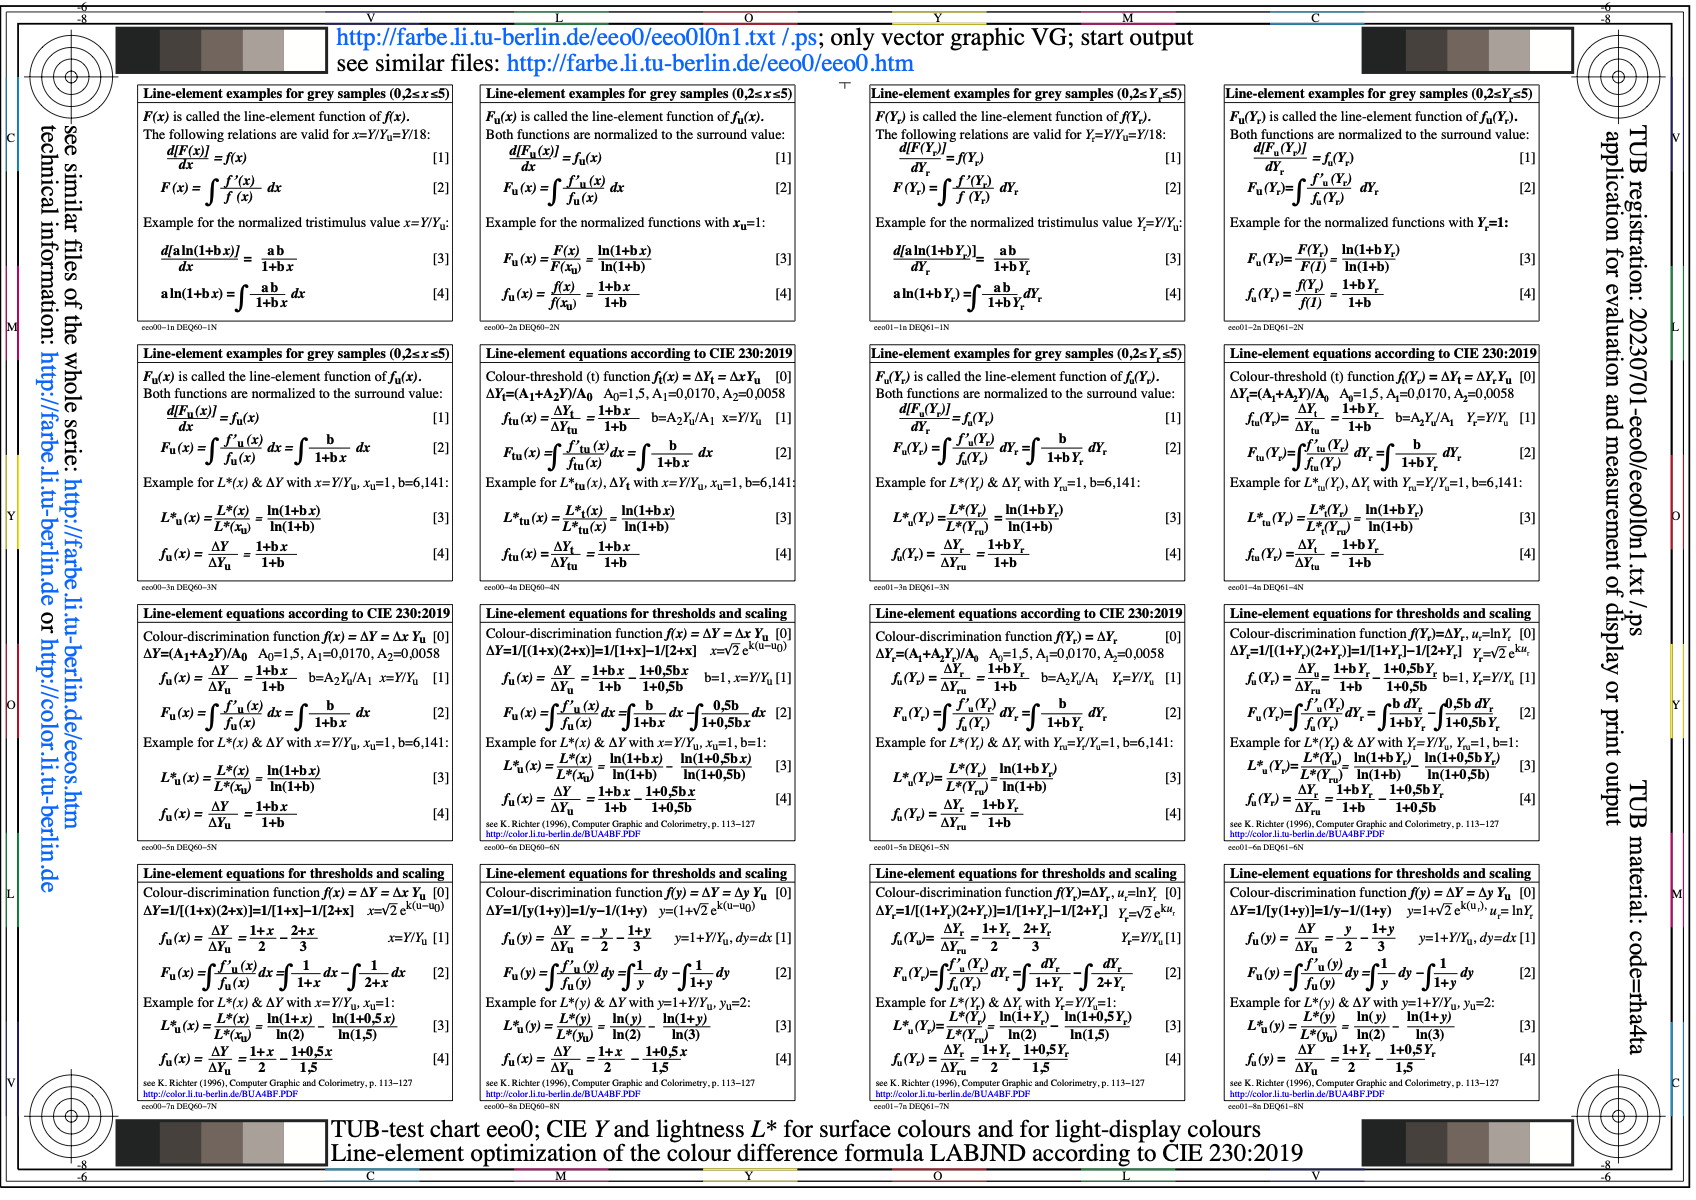
Image eeo0l0n1.jpg: Output in format A6 of the file
eeo0l0np.pdf, see
eeo0l0n1.
PS /
TXT /
PDF /
jpg
eeo0: TUB-test chart eeo0; Threshold experiments
Description of the experimental threshold delta Y
Formulae for the description of the lightness F*(Y)
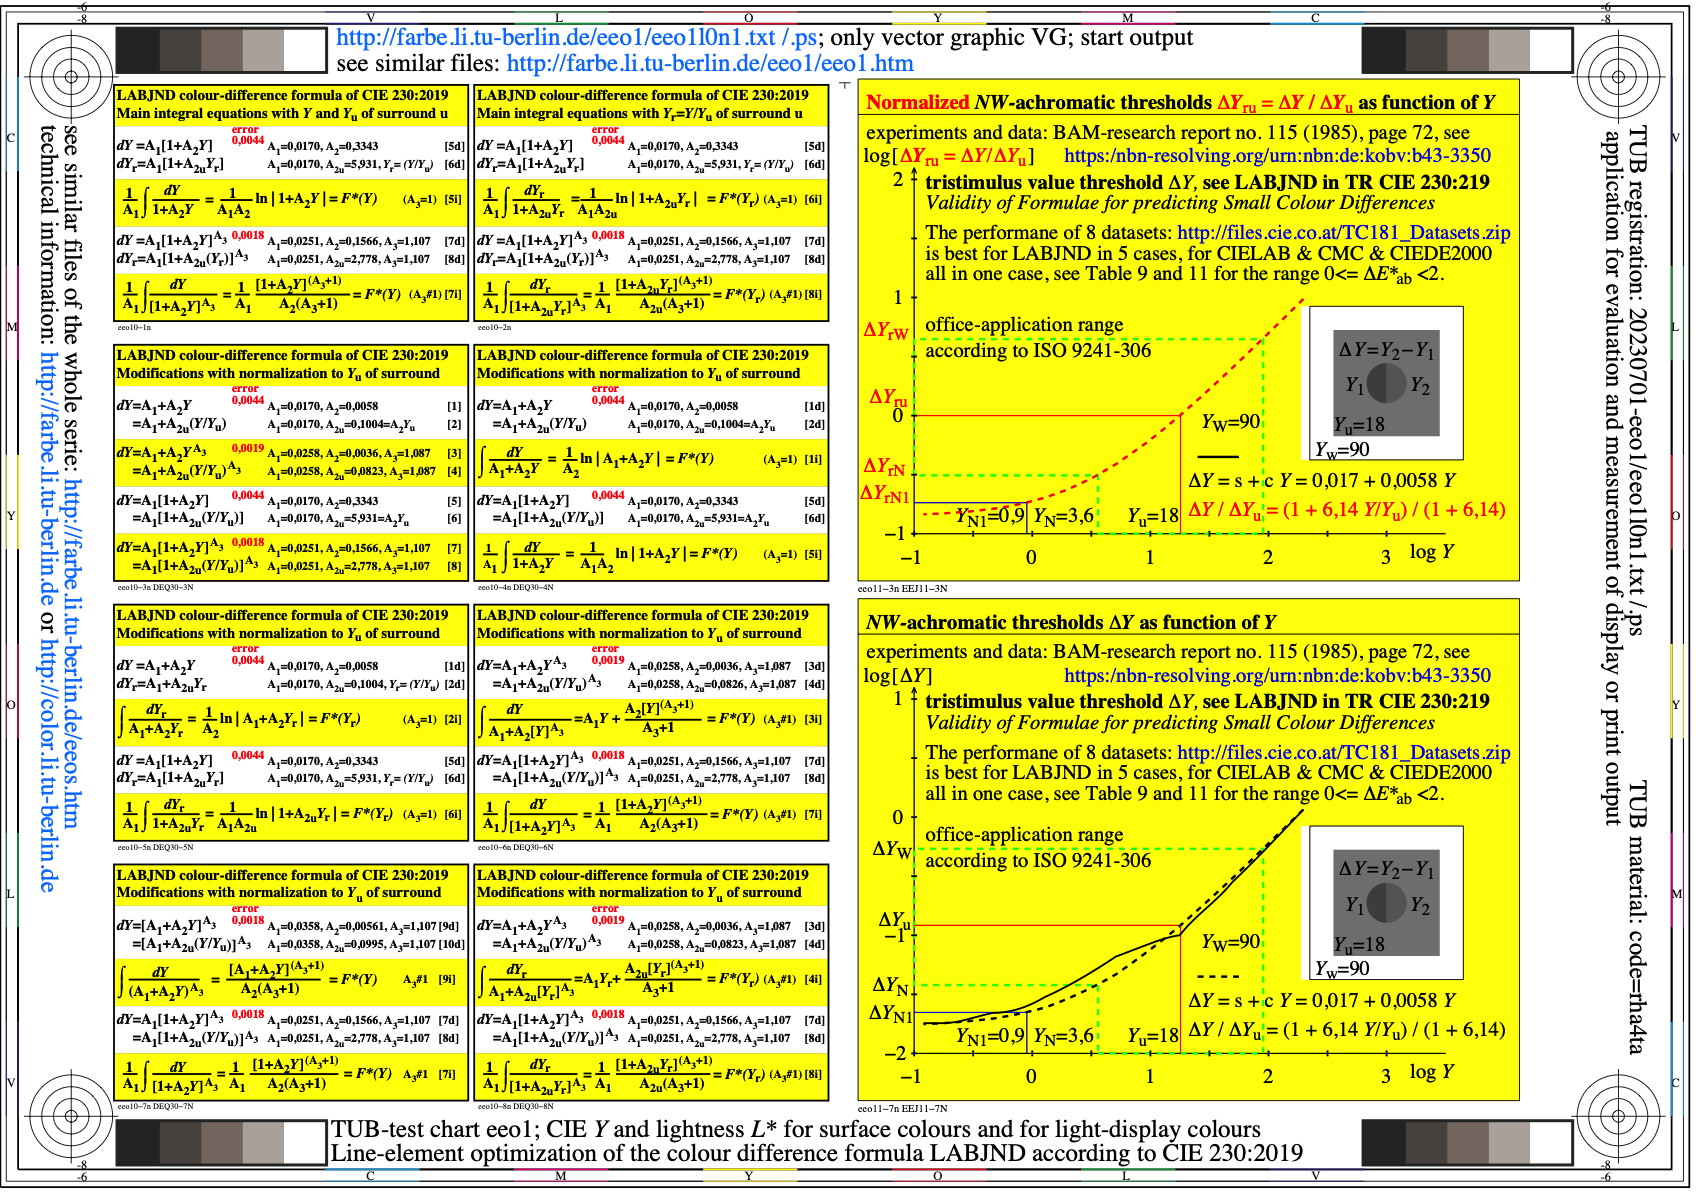
Image eeo1l0n1.jpg: Output in format A6 of the file
eeo1l0np.pdf, see
eeo1l0n1.
PS /
TXT /
PDF /
jpg
eeo1: TUB-test chart eeo1; CIE Y an lightness L*
for surface colours and emissive displays
Chromaticity and chromatic values of Ostwald- colours
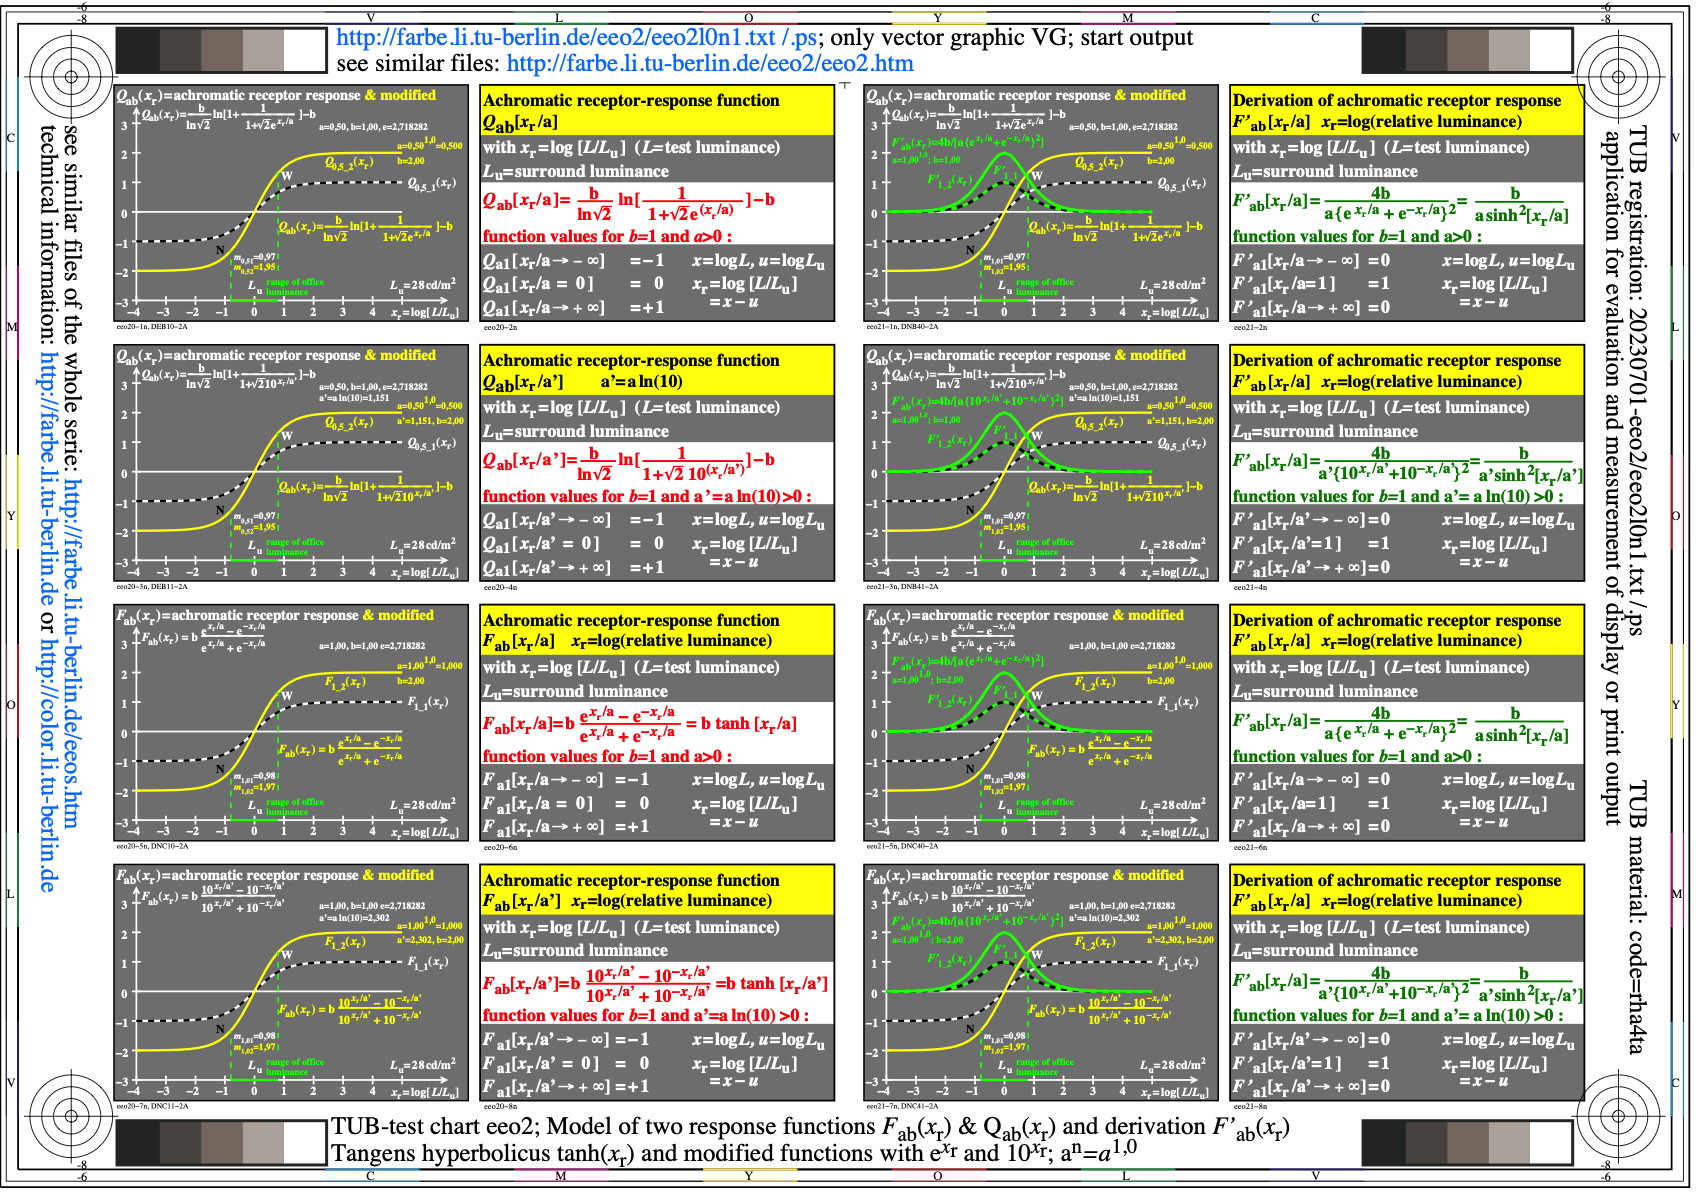
Image eeo2l0n1.jpg: Output in format A6 of the file
eeo2l0np.pdf, see
eeo2l0n1.
PS /
TXT /
PDF /
jpg
eeo2: TUB-test chart eeo2; Comparison of Qab(xr) and Fab(xr)
Line elements as integral an derivation
tanh(xr) mit e^(xr/a) und 10^(xr/a')
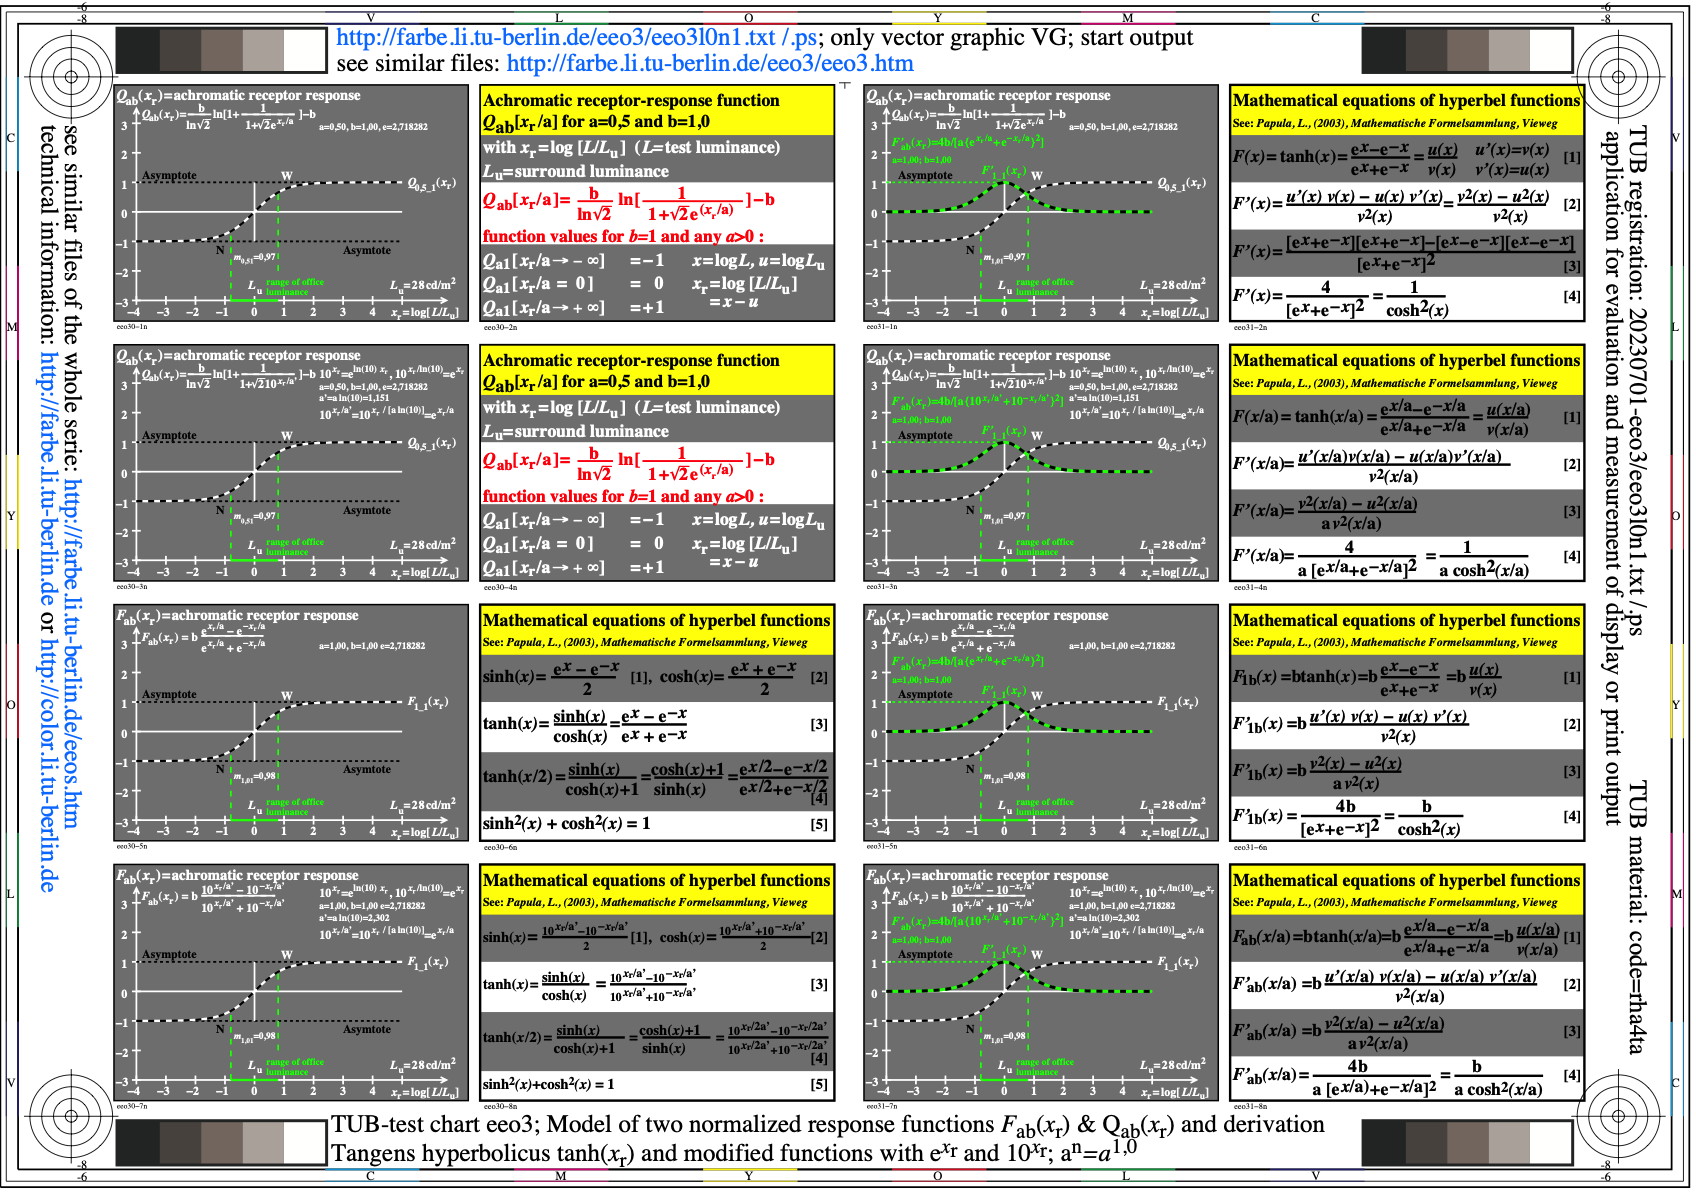
Image eeo3l0n1.jpg: Output in format A6 of the file
eeo3l0np.pdf, see
eeo3l0n1.
PS /
TXT /
PDF /
jpg
eeo3: TUB-test chart eeo3; Q/Fab(xr)-models for visual responses
Q/Fab(xr) with hyperbel functions e^(xr/a) and 10^(xr/a')
with contants a'=a ln(10) and a^n = a^1,0
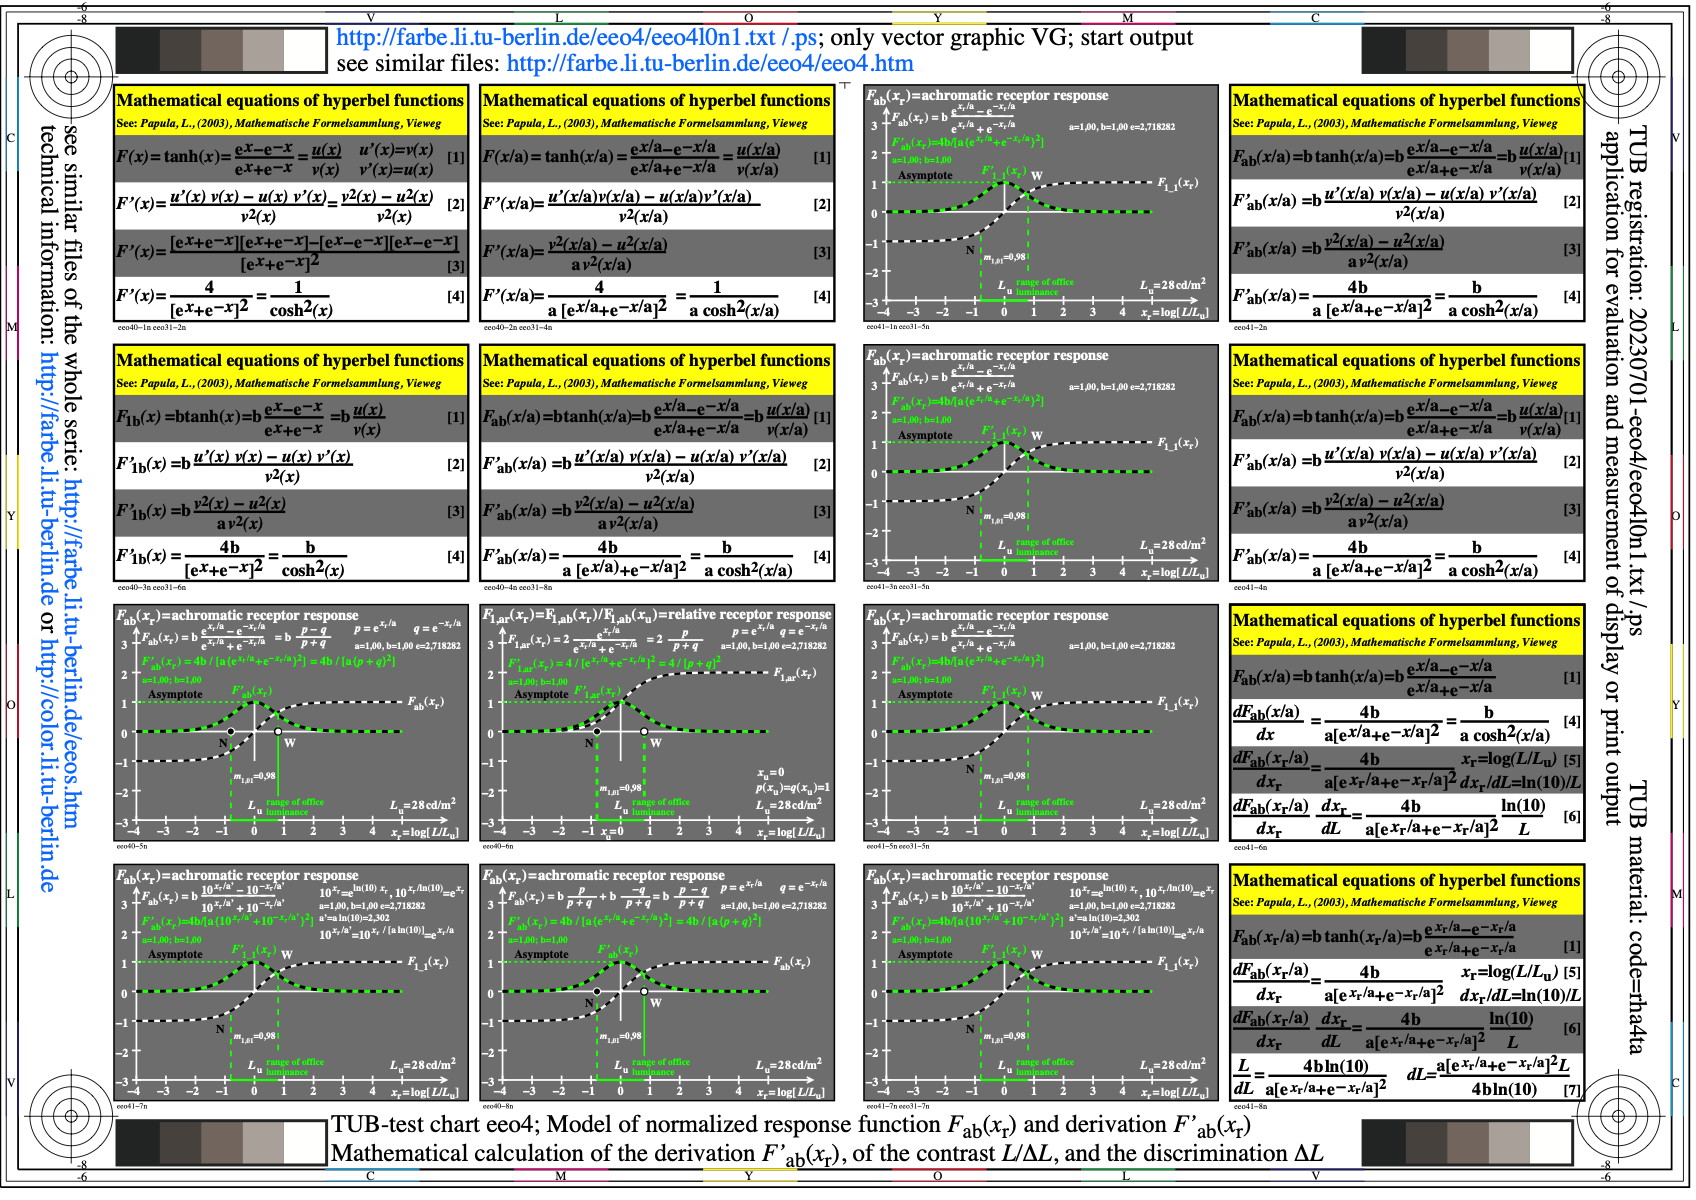
Image eeo4l0n1.jpg: Output in format A6 of the file
eeo4l0np.pdf, see
eeo4l0n1.
PS /
TXT /
PDF /
jpg
eeo4: TUB-test chart eeo4; Fab(xr)-model for visual responses
Application of hyperbel function tanh on receptor responses
Presentation of the functions and derivation for discrimination
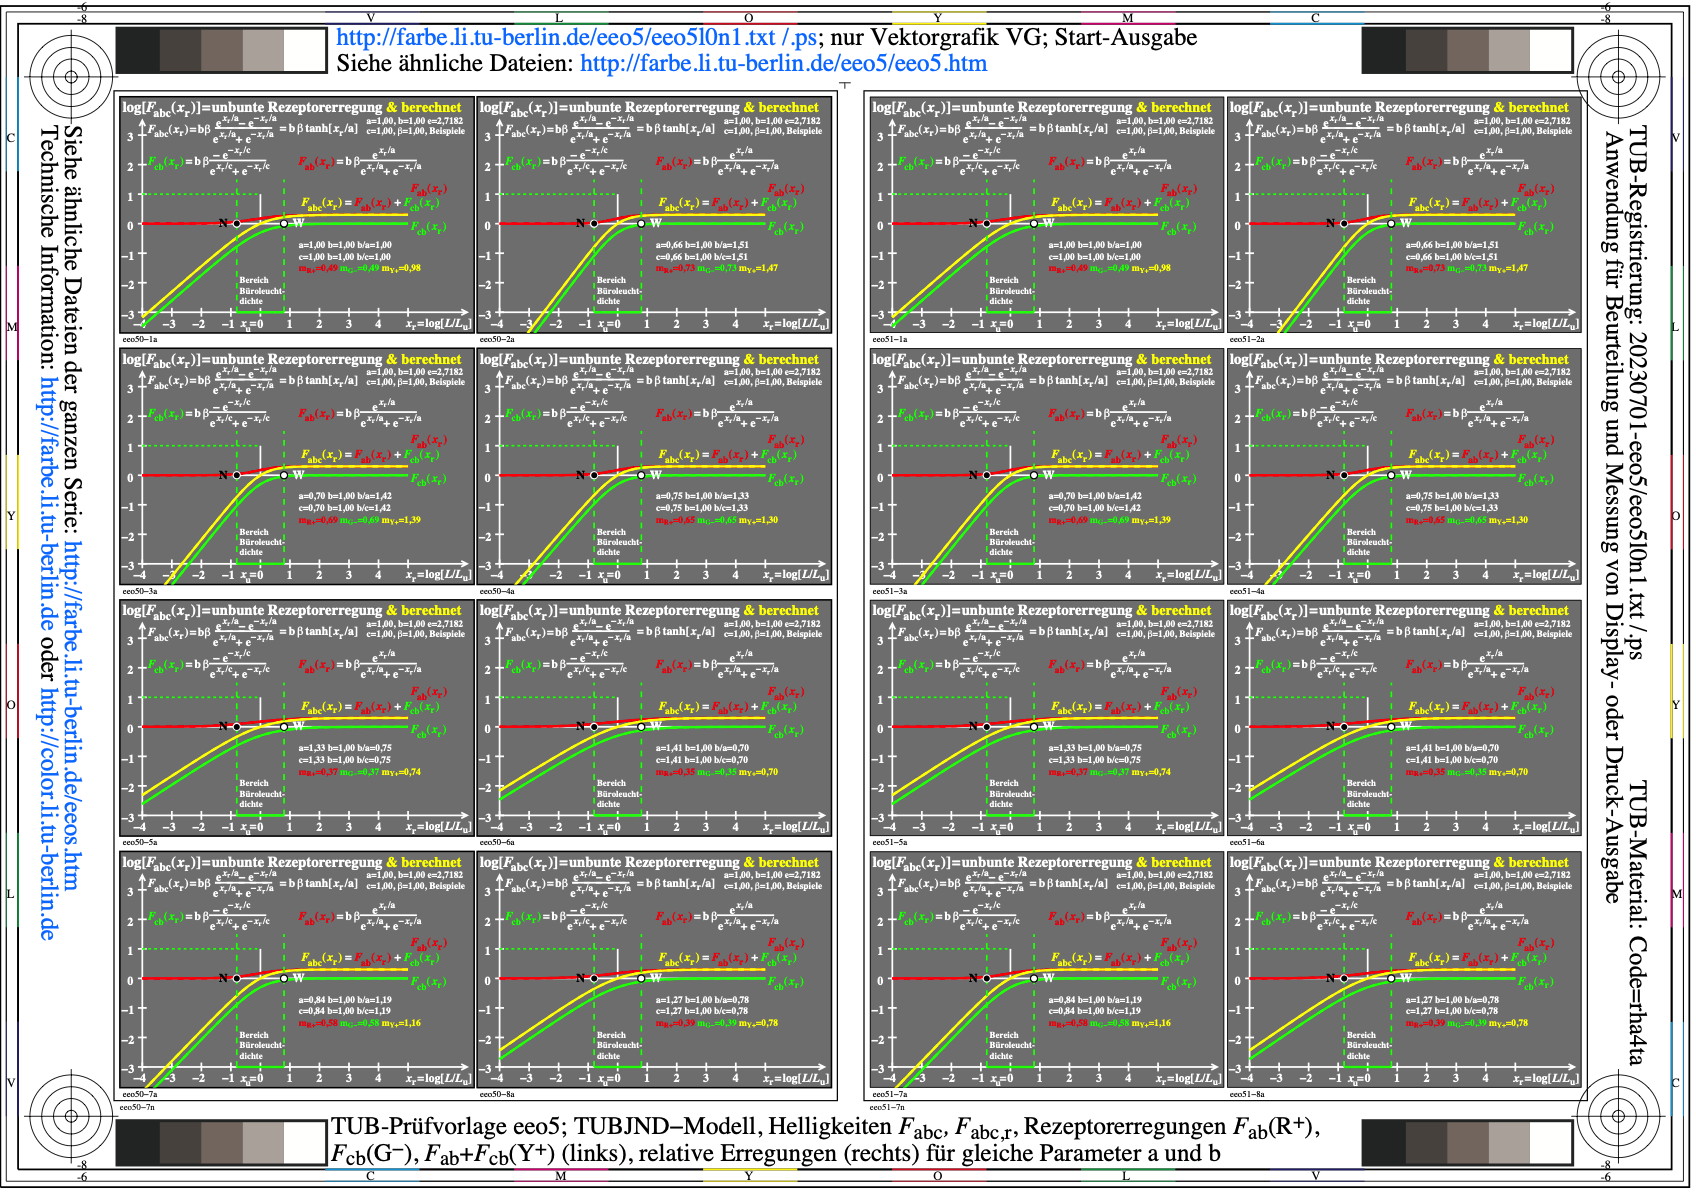
Image eeo5l0n1.jpg: Output in format A6 of the file
eeo5l0np.pdf, see
eeo5l0n1.
PS /
TXT /
PDF /
jpg
eeo5: TUB-test chart eeo5; TUBJND model, lightness Fabc, Fabc,r,
receptor responses Fab (R+), Fcb (G-), Fab+Fcb (Y+) (left),
and relative (right) for equal parameters a and b
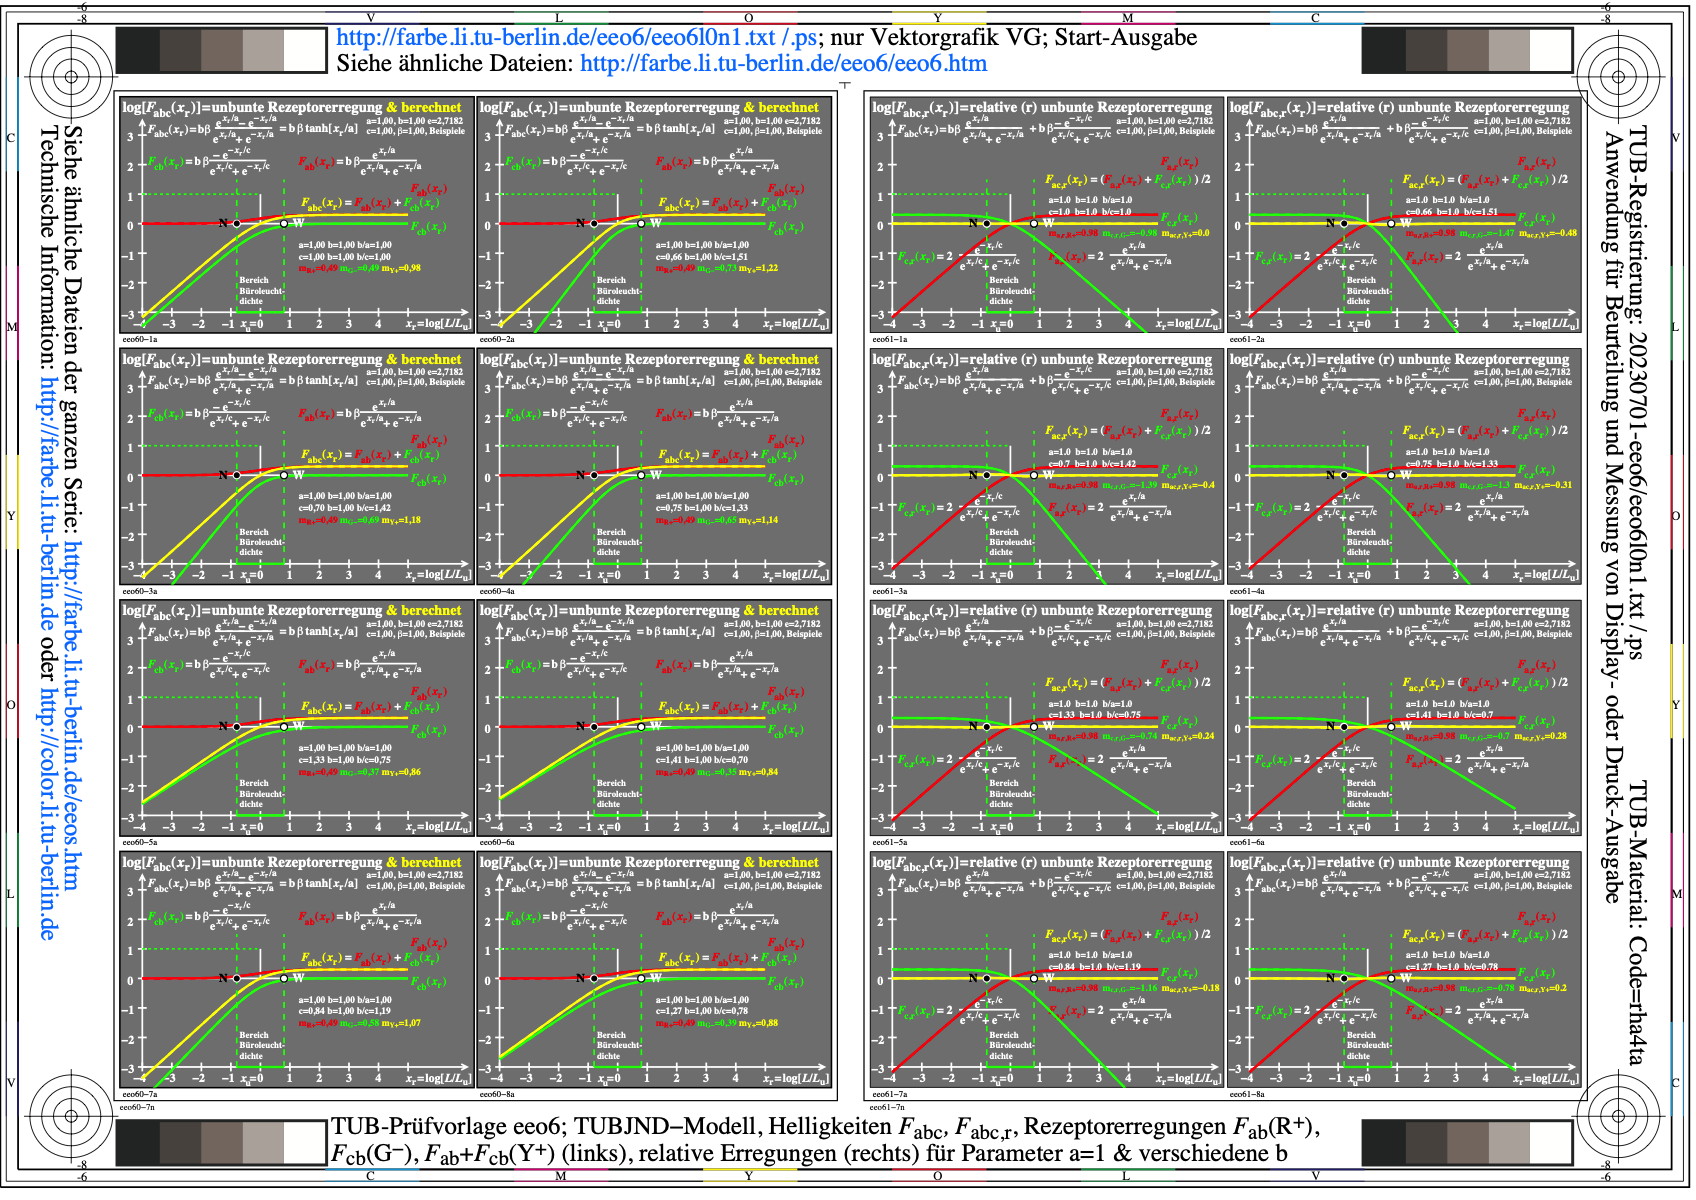
Image eeo6l0n1.jpg: Output in format A6 of the file
eeo6l0np.pdf, see
eeo6l0n1.
PS /
TXT /
PDF /
jpg
eeo6: TUB-test chart eeo6; TUBJND model, lightness Fabc, Fabc,r,
receptor responses Fab (R+), Fcb (G-), Fab+Fcb (Y+) (left),
and relative (right) for parameters a=1 and different b
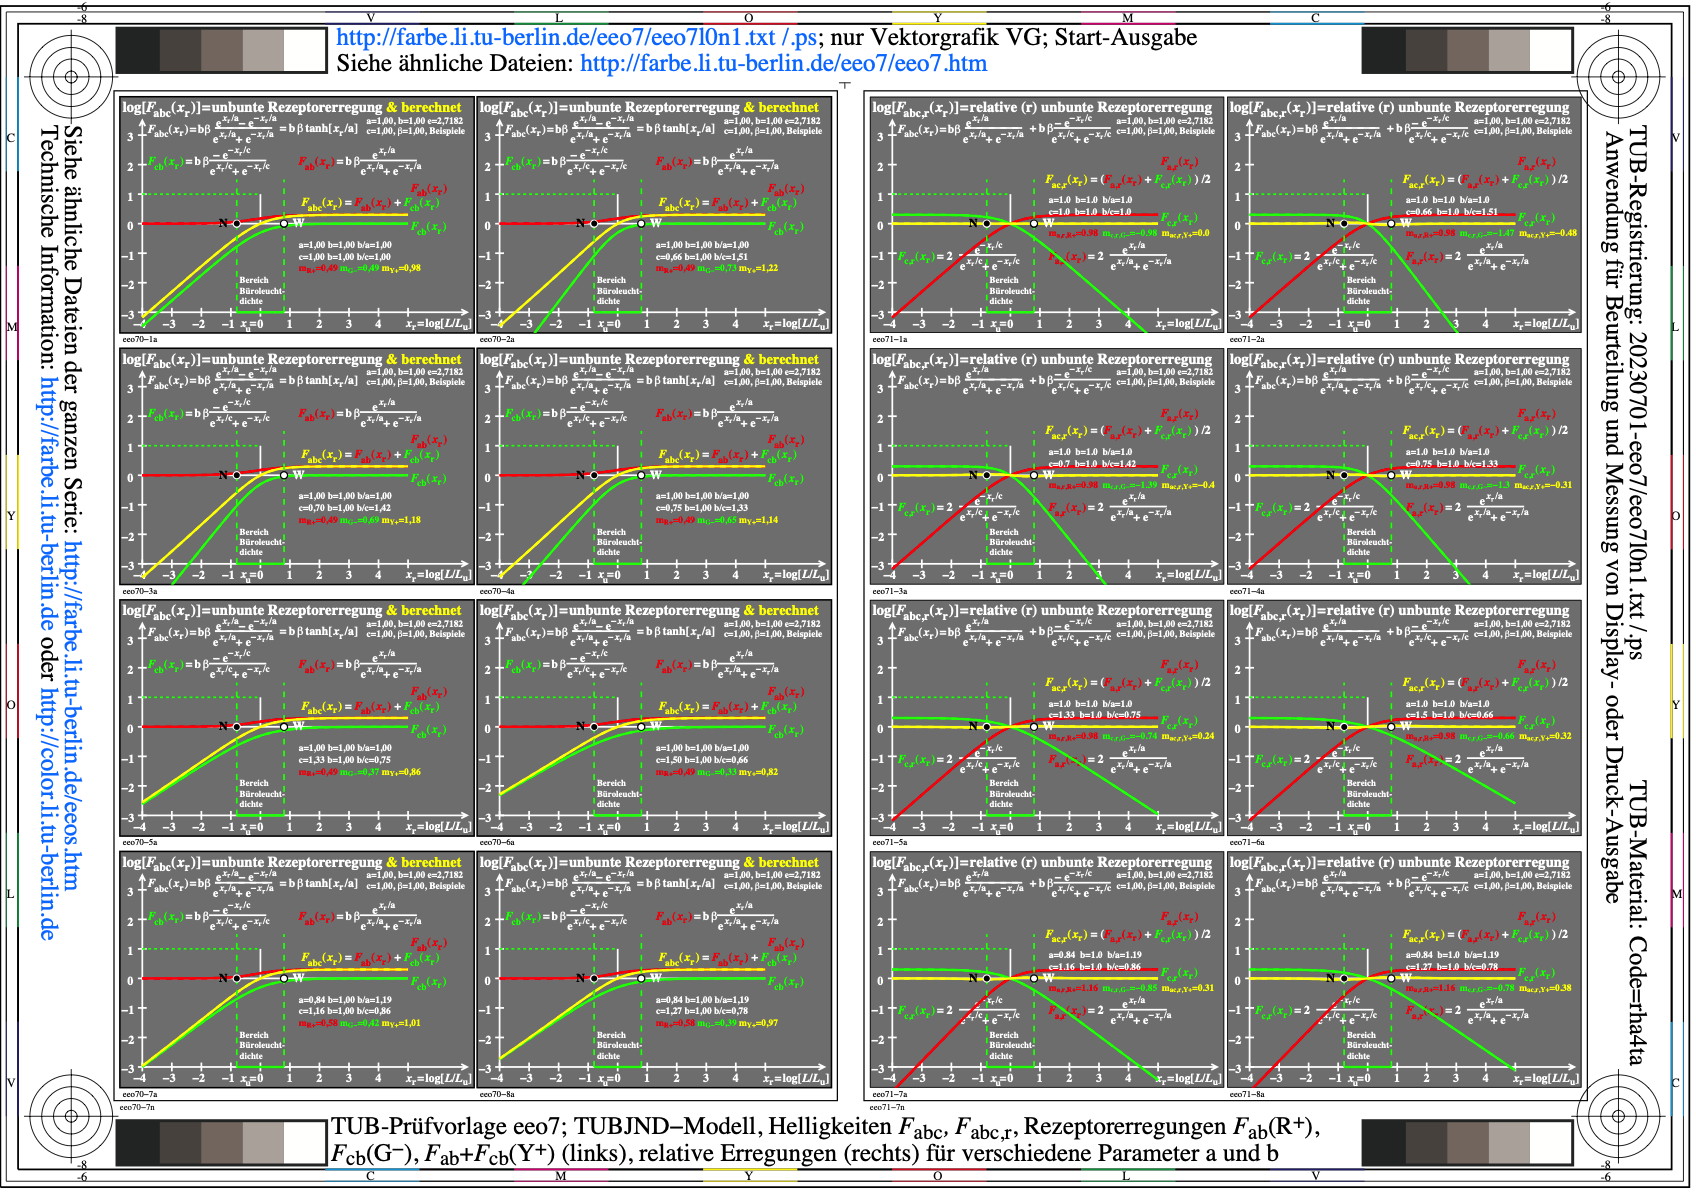
Image eeo7l0n1.jpg: Output in format A6 of the file
eeo7l0np.pdf, see
eeo7l0n1.
PS /
TXT /
PDF /
jpg
eeo7: TUB-test chart eeo7; TUBJND model, lightness Fabc, Fabc,r,
receptor responses Fab (R+), Fcb (G-), Fab+Fcb (Y+) (left),
and relative (right) for different parameters a and b
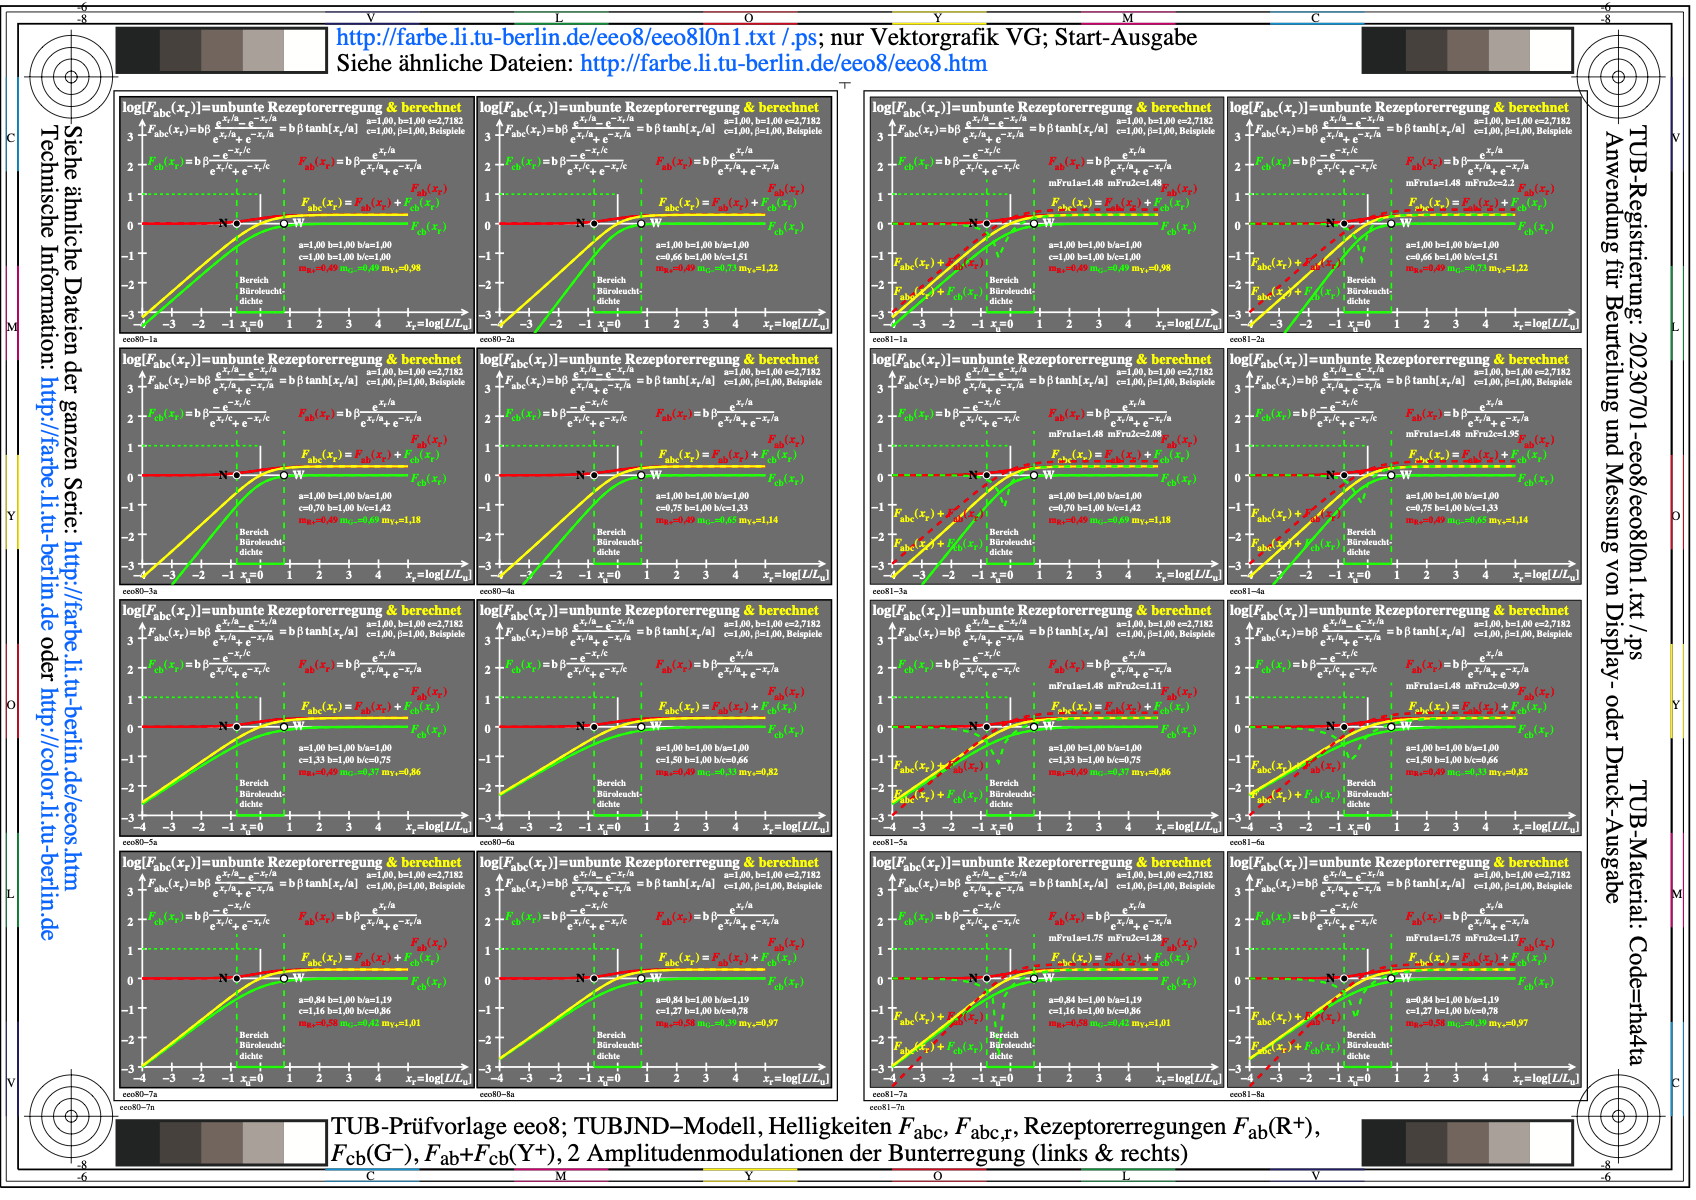
Image eeo8l0n1.jpg: Output in format A6 of the file
eeo8l0np.pdf, see
eeo8l0n1.
PS /
TXT /
PDF /
jpg
eeo8: TUB-test chart eeo8; TUBJND model, lightness Fabc, Fabc,r,
receptor responses Fab(R+), Fcb(G-), Fab+Fcb(Y+) (left & right),
2 amplitude modulations of chromatic responses (left & right)
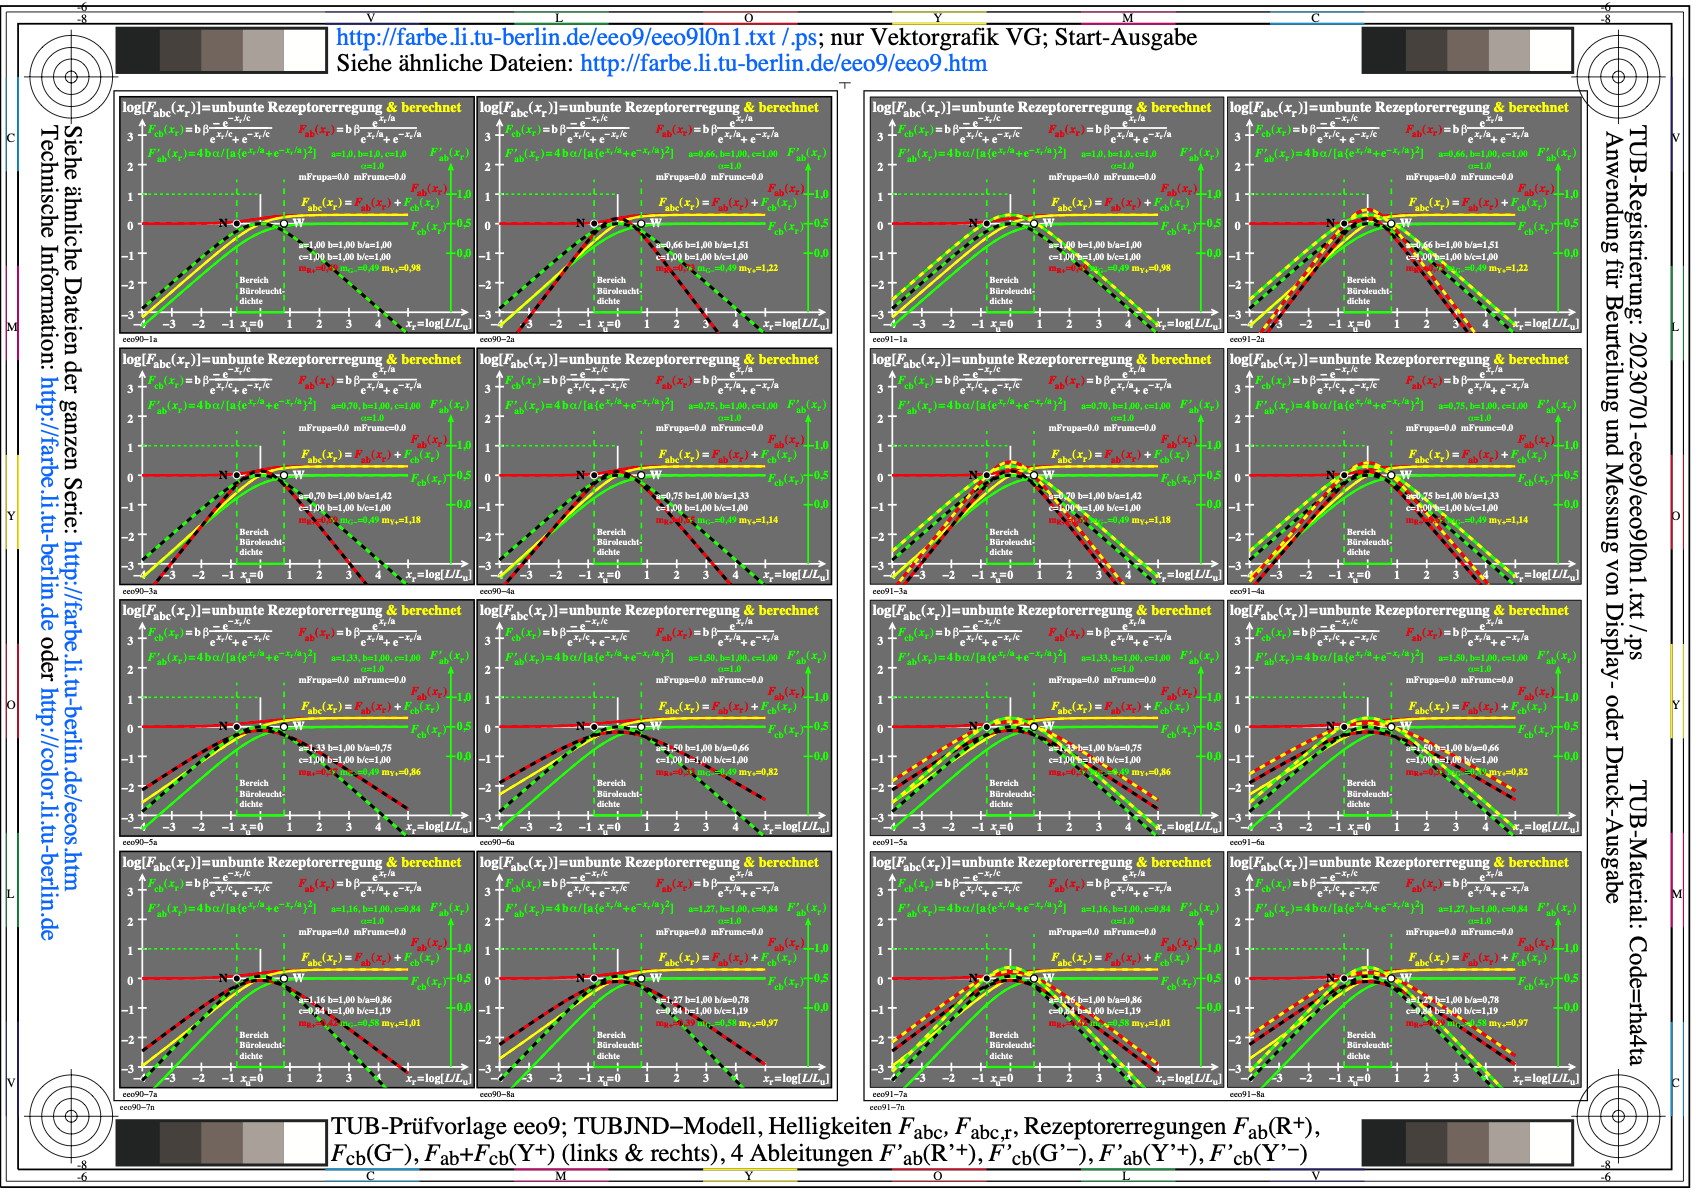
Image eeo9l0n1.jpg: Output in format A6 of the file
eeo9l0np.pdf, see
eeo9l0n1.
PS /
TXT /
PDF /
jpg
eeo9: TUB-test chart eeo9; TUBJND model, lightness Fabc, Fabc,r,
receptor responses Fab(R+), Fcb(G-), Fab+Fcb(Y+) (left & right),
4 derivations F'ab (R'+), F'cb (G'-), F'ab (Y'+), F'cb (Y'-)

Image eep0l0n1.jpg: Output in format A6 of the file
eep0l0np.pdf, see
eep0l0n1.
PS /
TXT /
PDF /
jpg
eep0: TUB-test chart eep0; CIELAB spaced 9 step grey scales
for four display reflections Yref=3,6, 0,4, 0,9, 1,8
L*N=22,3 or YN=3,6 and L*W=96 or YW=90, normalisation: white W

Image eep1l0n1.jpg: Output in format A6 of the file
eep1l0np.pdf, see
eep1l0n1.
PS /
TXT /
PDF /
jpg
eep1: TUB-test chart eep1; CIELAB spaced 9 step grey scales
for four display reflections Yref=3,6, 0,4, 0,9, 1,8
L*N=22,3 or YN=3,6 and L*W=96 or YW=90, normalisation: grey U

Image eep2l0n1.jpg: Output in format A6 of the file
eep2l0np.pdf, see
eep2l0n1.
PS /
TXT /
PDF /
jpg
eep2: TUB-test chart eep2; CIELAB spaced 9 step grey scales
for four display reflections Yref=3,6, 0,4, 0,9, 1,8
L*N=4 or YN=0,4 and L*W=96 or YW=90, normalisation: white W
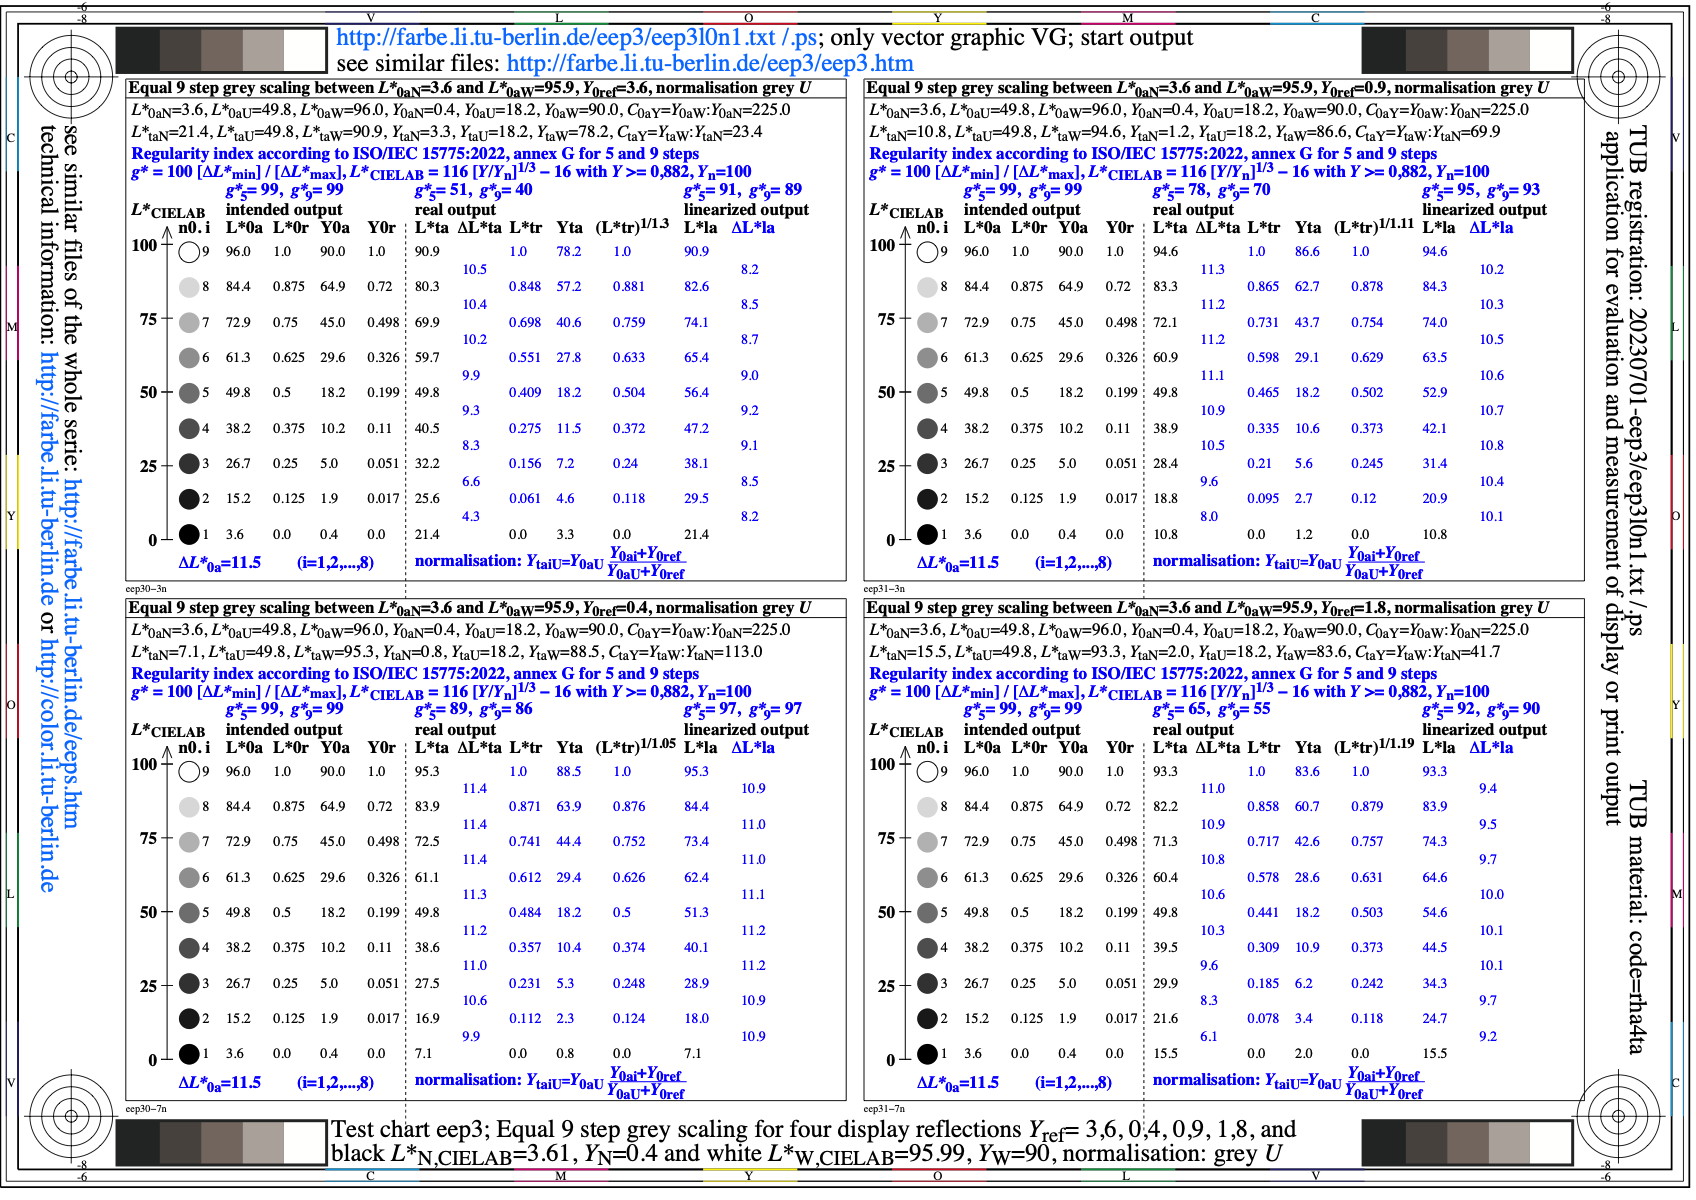
Image eep3l0n1.jpg: Output in format A6 of the file
eep3l0np.pdf, see
eep3l0n1.
PS /
TXT /
PDF /
jpg
eep3: TUB-test chart eep3; CIELAB spaced 9 step grey scales
for four display reflections Yref=3,6, 0,4, 0,9, 1,8
L*N=4 or YN=0,4 and L*W=96 or YW=90, normalisation: grey U

Image eep4l0n1.jpg: Output in format A6 of the file
eep4l0np.pdf, see
eep4l0n1.
PS /
TXT /
PDF /
jpg
eep4: TUB-test chart eep4; CIELAB spaced 9 step grey scales
for four display reflections Yref=3,6, 0,4, 0,9, 1,8
L*N=8,1 or YN=0,9 and L*W=96 or YW=90, normalisation: white W
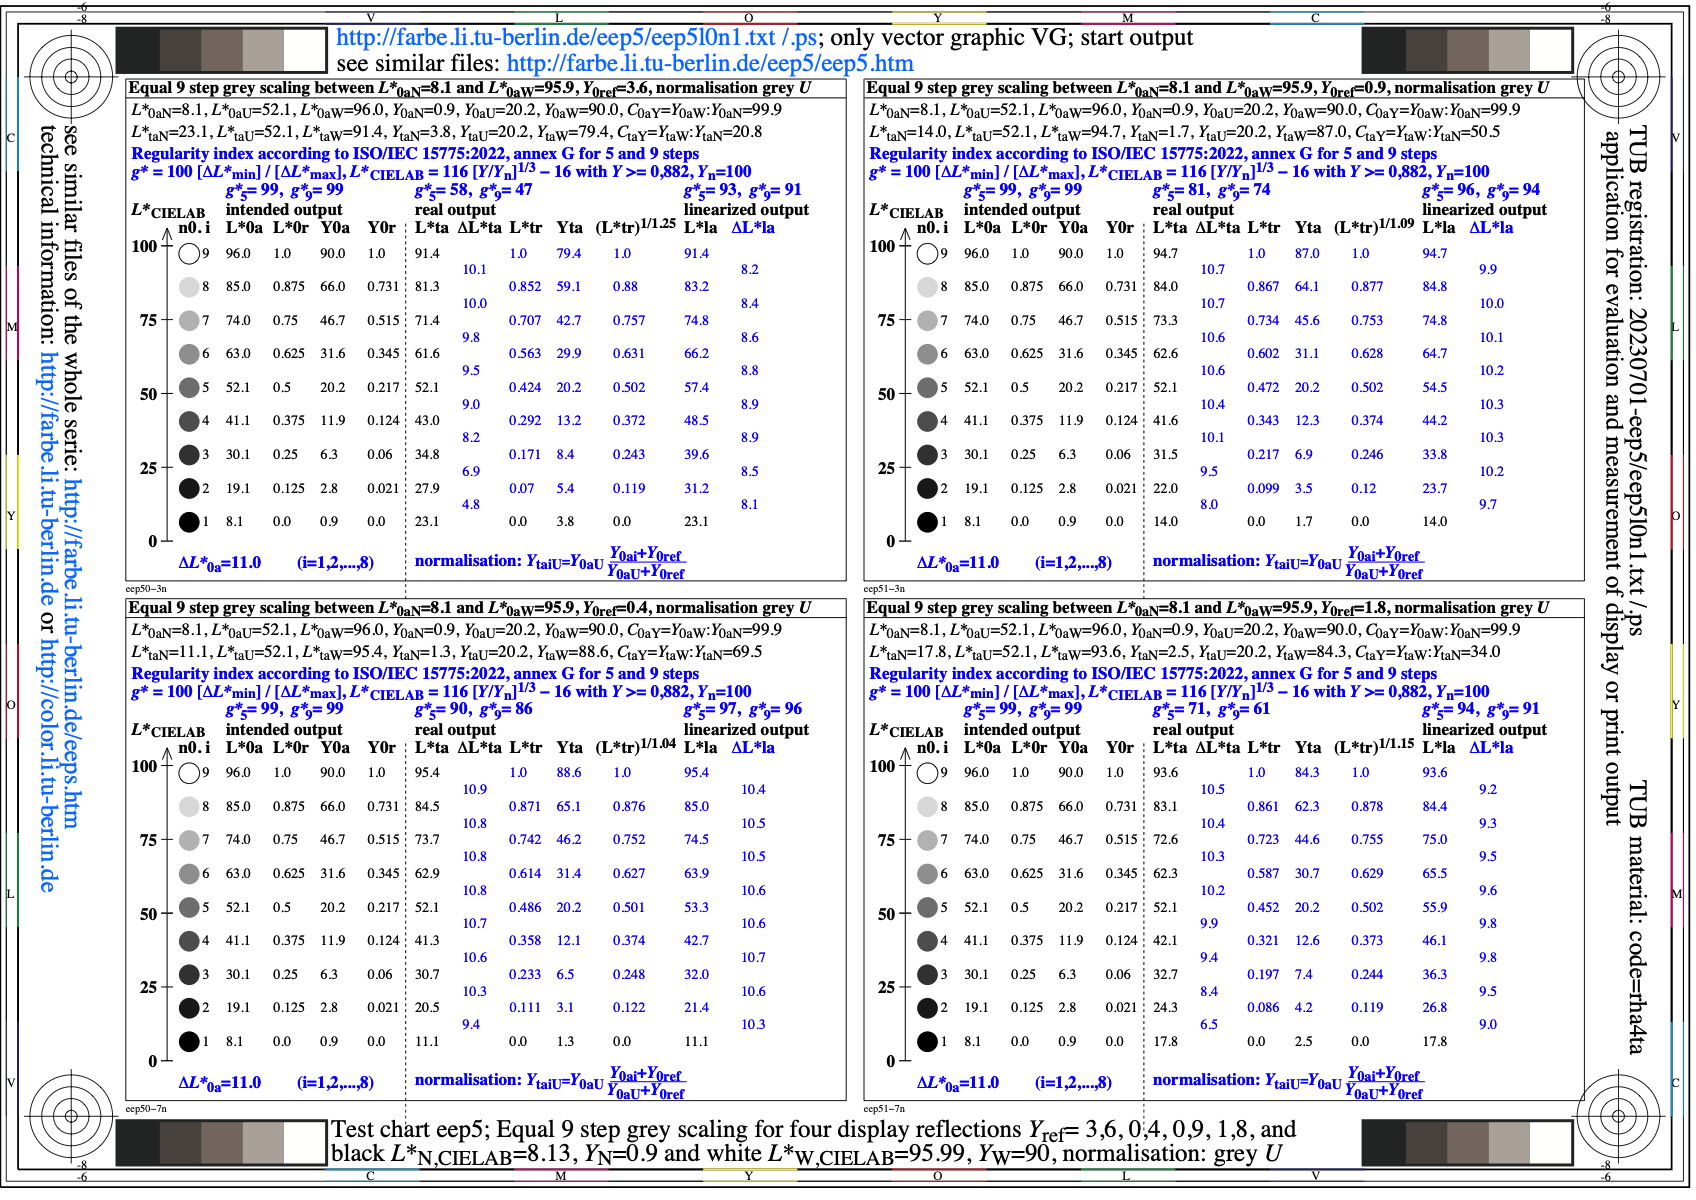
Image eep5l0n1.jpg: Output in format A6 of the file
eep5l0np.pdf, see
eep5l0n1.
PS /
TXT /
PDF /
jpg
eep5: TUB-test chart eep5; CIELAB spaced 9 step grey scales
for four display reflections Yref=3,6, 0,4, 0,9, 1,8
L*N=8,1 or YN=0,9 and L*W=96 or YW=90, normalisation: grey U
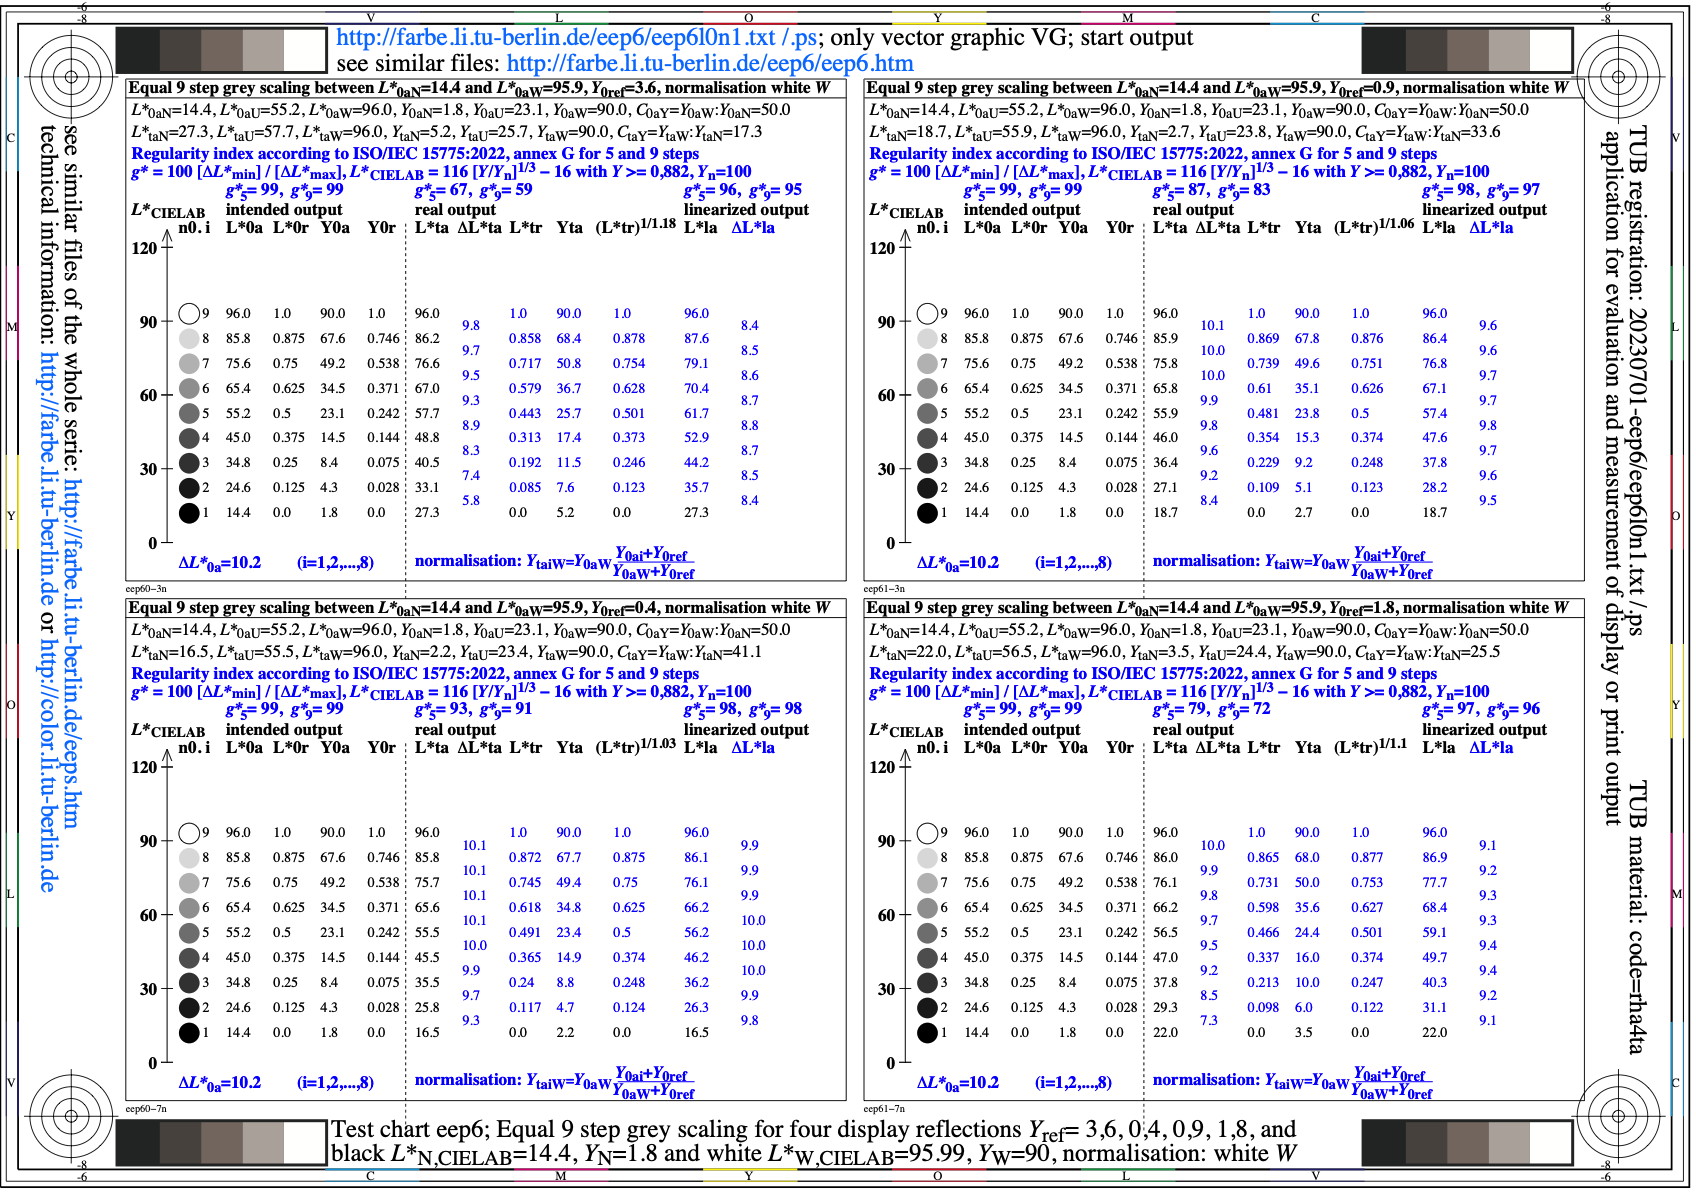
Image eep6l0n1.jpg: Output in format A6 of the file
eep6l0np.pdf, see
eep6l0n1.
PS /
TXT /
PDF /
jpg
eep6: TUB-test chart eep6; CIELAB spaced 9 step grey scales
for four display reflections Yref=3,6, 0,4, 0,9, 1,8
L*N=14,4 or YN=1,8 and L*W=96 or YW=90, normalisation: white W

Image eep7l0n1.jpg: Output in format A6 of the file
eep7l0np.pdf, see
eep7l0n1.
PS /
TXT /
PDF /
jpg
eep7: TUB-test chart eep7; CIELAB spaced 9 step grey scales
for four display reflections Yref=3,6, 0,4, 0,9, 1,8
L*N=14,4 or YN=1,8 and L*W=96 or YW=90, normalisation: grey U

Image eep8l0n1.jpg: Output in format A6 of the file
eep8l0np.pdf, see
eep8l0n1.
PS /
TXT /
PDF /
jpg
eep8: TUB-test chart eep8; CIELAB spaced 9 step grey scales
for four display reflections Yref=3,6, 0,4, 0,9, 1,8
L*N=18 or YN=2,5 and L*W=96 or YW=90, normalisation: white W

Image eep9l0n1.jpg: Output in format A6 of the file
eep9l0np.pdf, see
eep9l0n1.
PS /
TXT /
PDF /
jpg
eep9: TUB-test chart eep9; CIELAB spaced 9 step grey scales
for four display reflections Yref=3,6, 0,4, 0,9, 1,8
L*N=18 or YN=2,5 and L*W=96 or YW=90, normalisation: grey U
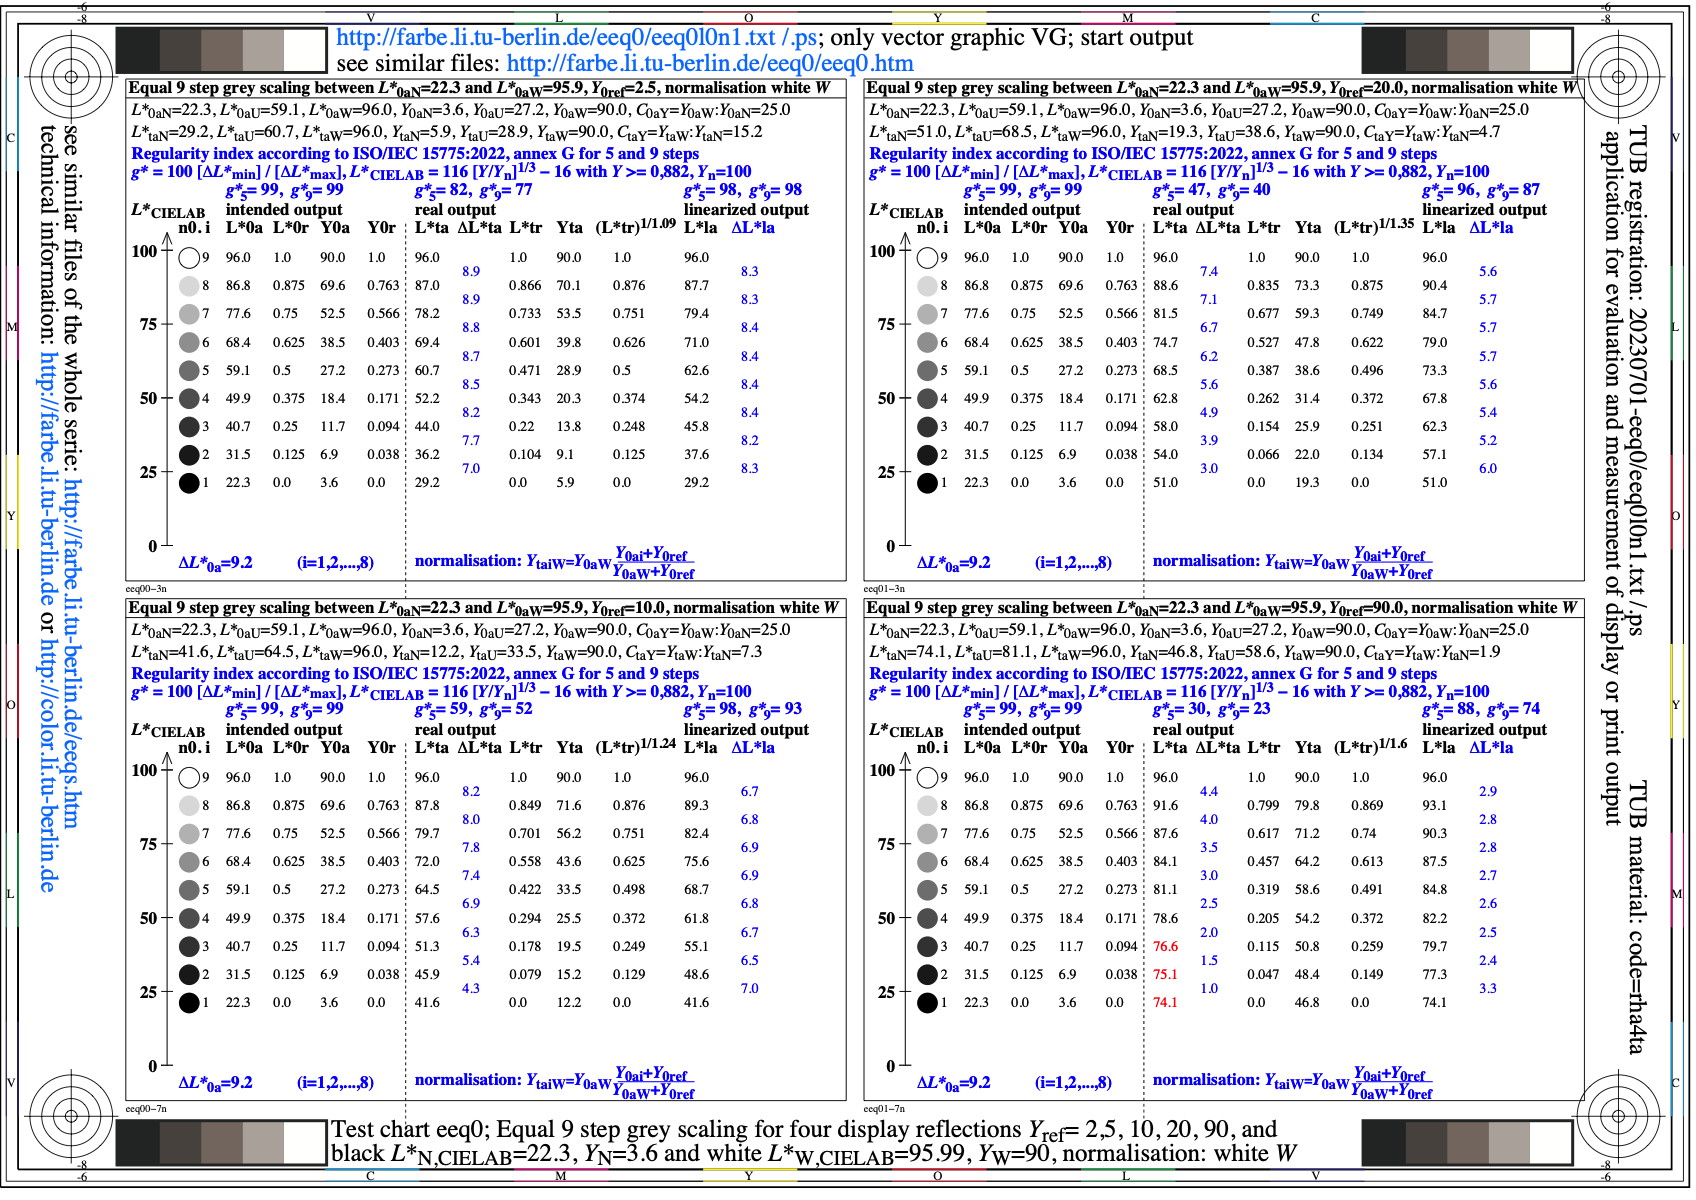
Image eeq0l0n1.jpg: Output in format A6 of the file
eeq0l0np.pdf, see
eeq0l0n1.
PS /
TXT /
PDF /
jpg
eeq0: TUB-test chart eeq0; CIELAB spaced 9 step grey scales
for four display reflections Yref=2,5, 10, 20, 90
L*N=22,3 or YN=3,6 and L*W=96 or YW=90, normalisation: white W

Image eeq1l0n1.jpg: Output in format A6 of the file
eeq1l0np.pdf, see
eeq1l0n1.
PS /
TXT /
PDF /
jpg
eeq1: TUB-test chart eeq1; CIELAB spaced 9 step grey scales
for four display reflections Yref=2,5, 10, 20, 90
L*N=22,3 or YN=3,6 and L*W=96 or YW=90, normalisation: grey U

Image eeq2l0n1.jpg: Output in format A6 of the file
eeq2l0np.pdf, see
eeq2l0n1.
PS /
TXT /
PDF /
jpg
eeq2: TUB-test chart eeq2; CIELAB spaced 9 step grey scales
for four display reflections Yref=2,5, 10, 20, 90
L*N=4 or YN=0,4 and L*W=96 or YW=90, normalisation: white W
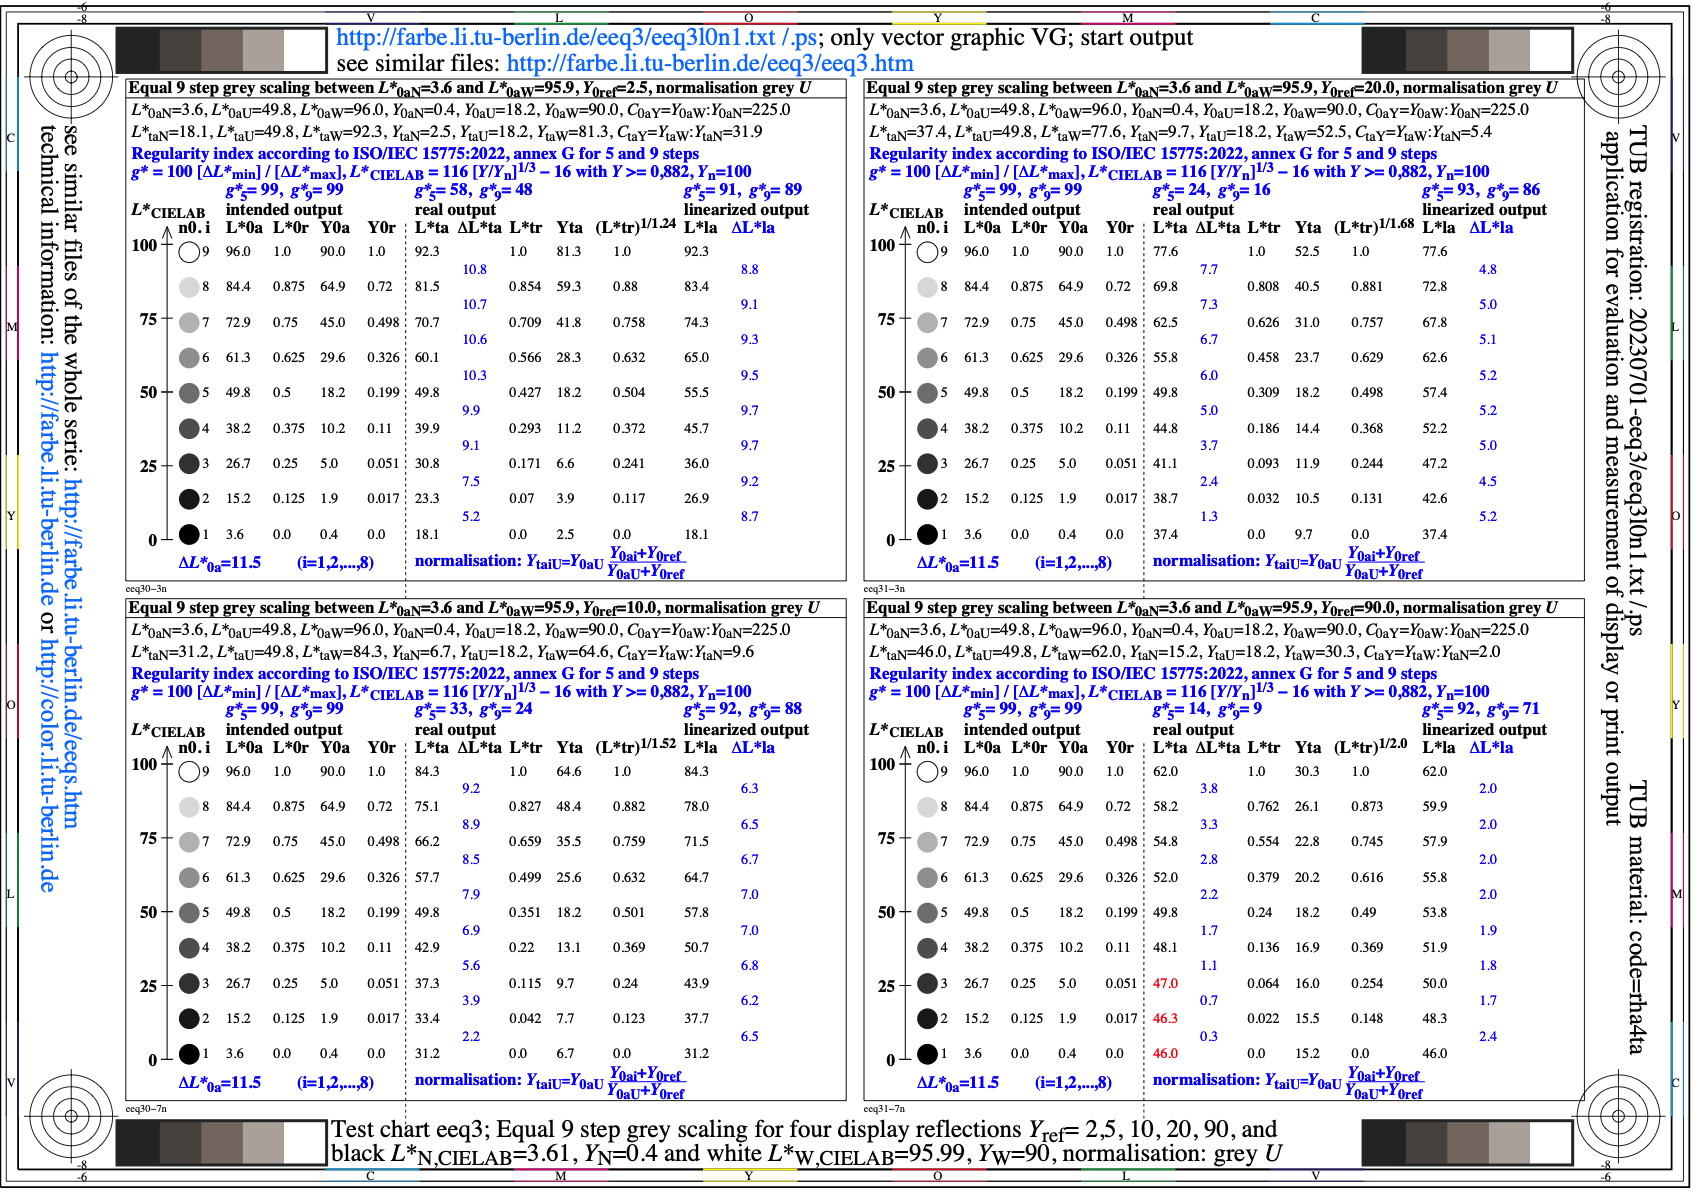
Image eeq3l0n1.jpg: Output in format A6 of the file
eeq3l0np.pdf, see
eeq3l0n1.
PS /
TXT /
PDF /
jpg
eeq3: TUB-test chart eeq3; CIELAB spaced 9 step grey scales
for four display reflections Yref=2,5, 10, 20, 90
L*N=4 or YN=0,4 and L*W=96 or YW=90, normalisation: grey U

Image eeq4l0n1.jpg: Output in format A6 of the file
eeq4l0np.pdf, see
eeq4l0n1.
PS /
TXT /
PDF /
jpg
eeq4: TUB-test chart eeq4; CIELAB spaced 9 step grey scales
for four display reflections Yref=2,5, 10, 20, 90
L*N=8,1 or YN=0,9 and L*W=96 or YW=90, normalisation: white W

Image eeq5l0n1.jpg: Output in format A6 of the file
eeq5l0np.pdf, see
eeq5l0n1.
PS /
TXT /
PDF /
jpg
eeq5: TUB-test chart eeq5; CIELAB spaced 9 step grey scales
for four display reflections Yref=2,5, 10, 20, 90
L*N=8,1 or YN=0,9 and L*W=96 or YW=90, normalisation: grey U
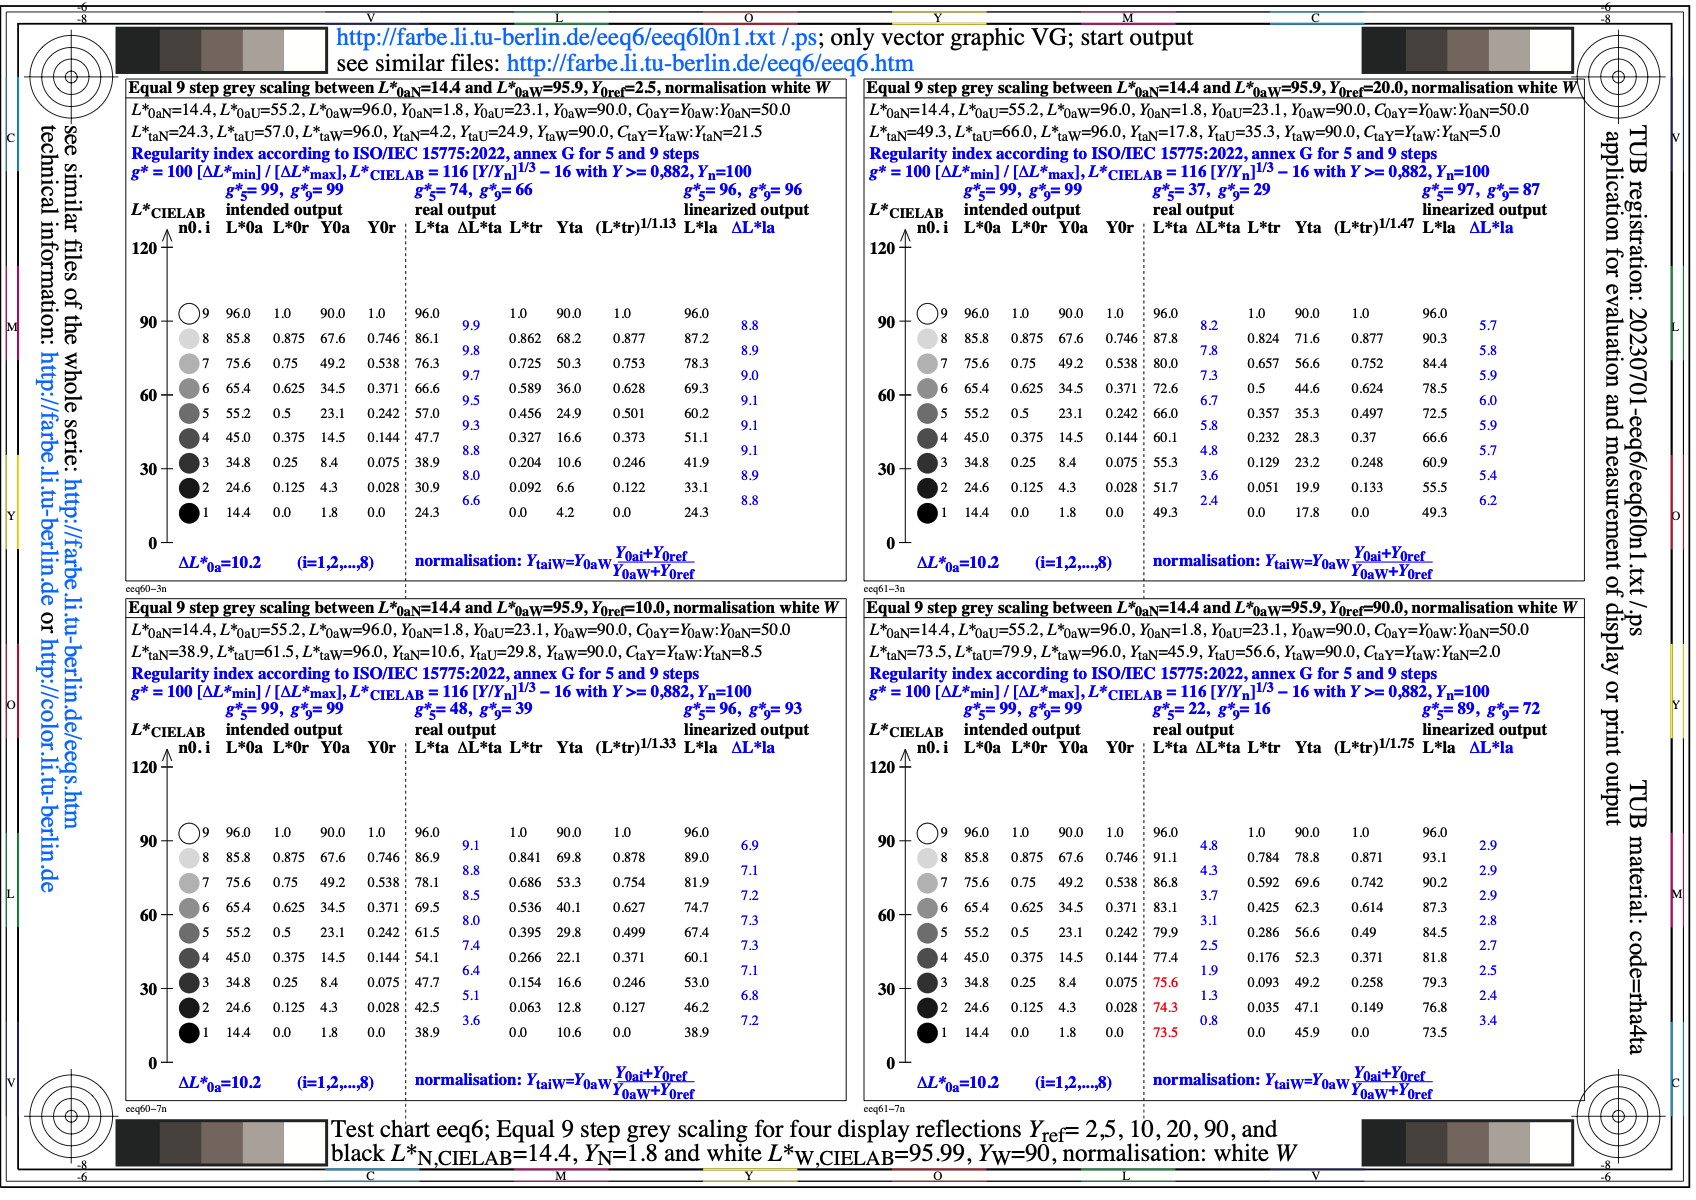
Image eeq6l0n1.jpg: Output in format A6 of the file
eeq6l0np.pdf, see
eeq6l0n1.
PS /
TXT /
PDF /
jpg
eeq6: TUB-test chart eeq6; CIELAB spaced 9 step grey scales
for four display reflections Yref=2,5, 10, 20, 90
L*N=14,4 or YN=1,8 and L*W=96 or YW=90, normalisation: white W

Image eeq7l0n1.jpg: Output in format A6 of the file
eeq7l0np.pdf, see
eeq7l0n1.
PS /
TXT /
PDF /
jpg
eeq7: TUB-test chart eeq7; CIELAB spaced 9 step grey scales
for four display reflections Yref=2,5, 10, 20, 90
L*N=14,4 or YN=1,8 and L*W=96 or YW=90, normalisation: grey U

Image eeq8l0n1.jpg: Output in format A6 of the file
eeq8l0np.pdf, see
eeq8l0n1.
PS /
TXT /
PDF /
jpg
eeq8: TUB-test chart eeq8; CIELAB spaced 9 step grey scales
for four display reflections Yref=2,5, 10, 20, 90
L*N=18 or YN=2,5 and L*W=96 or YW=90, normalisation: white W

Image eeq9l0n1.jpg: Output in format A6 of the file
eeq9l0np.pdf, see
eeq9l0n1.
PS /
TXT /
PDF /
jpg
eeq9: TUB-test chart eeq9; CIELAB spaced 9 step grey scales
for four display reflections Yref=2,5, 10, 20, 90
L*N=18 or YN=2,5 and L*W=96 or YW=90, normalisation: grey U
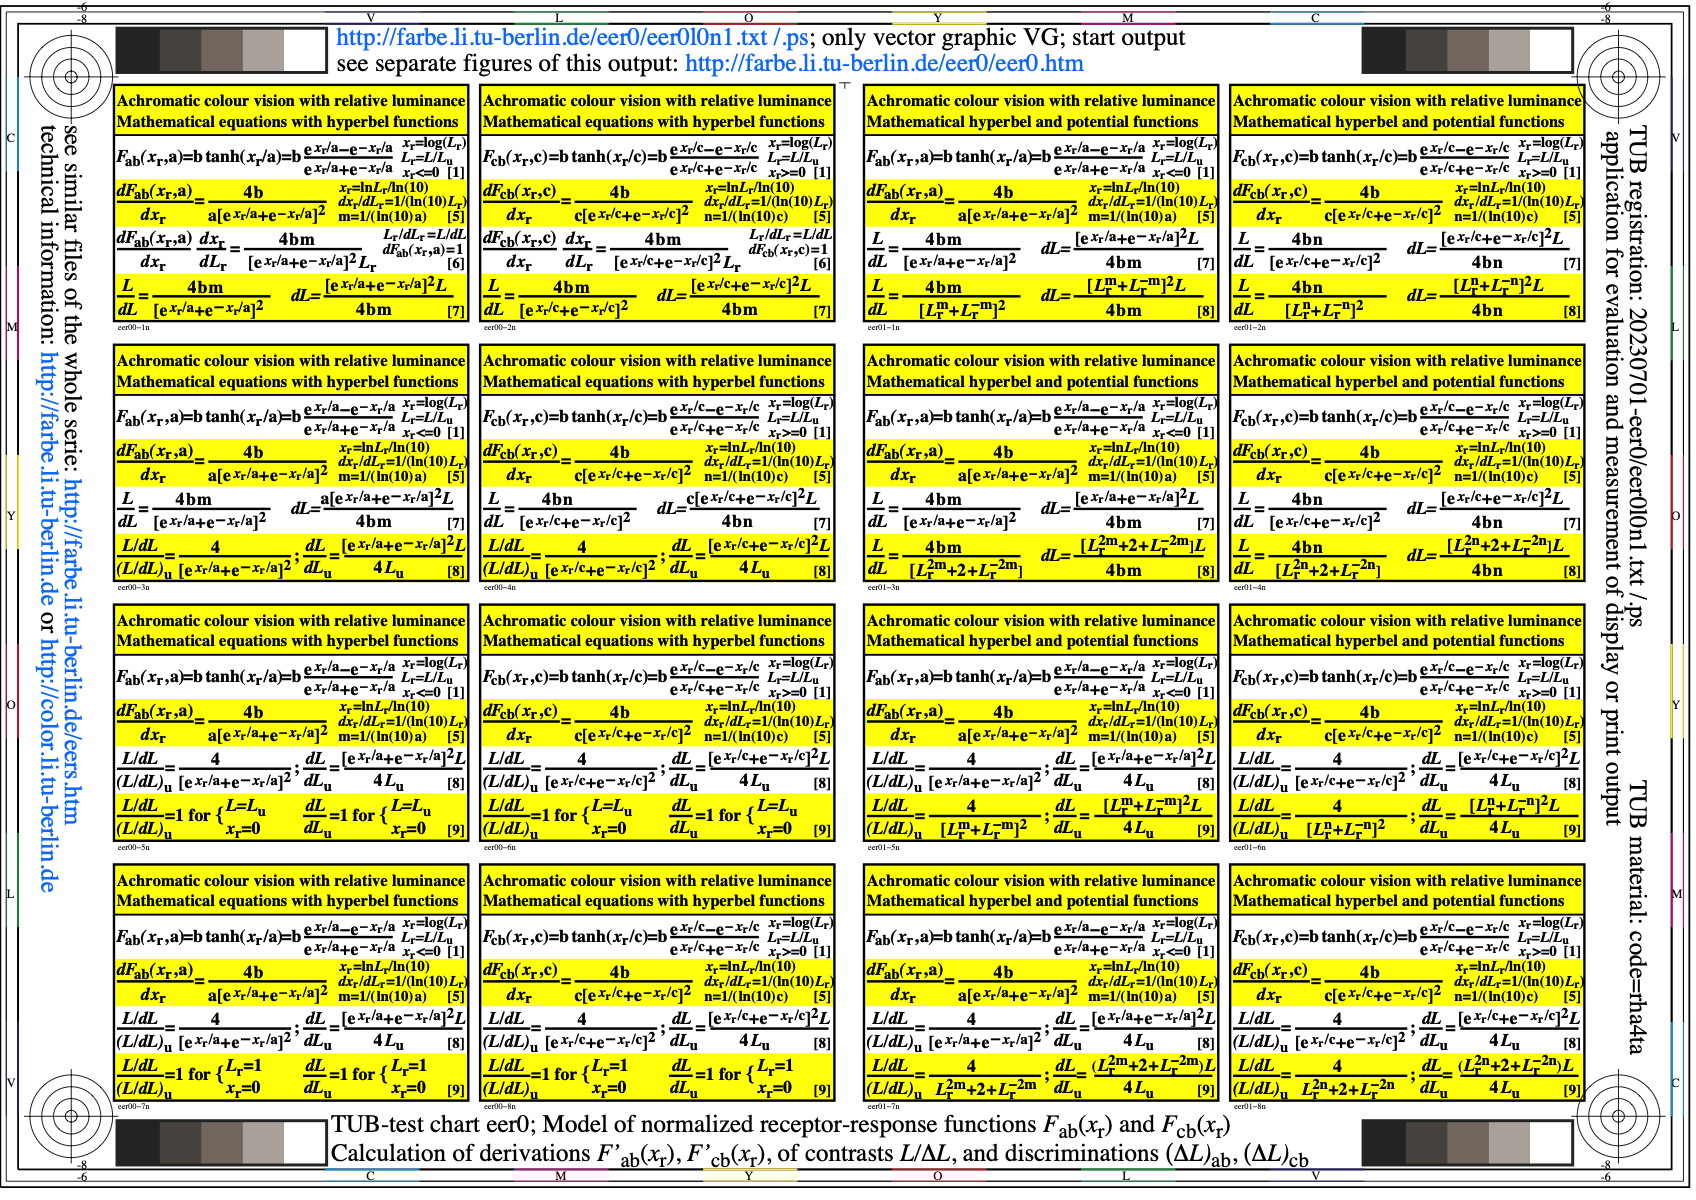
Image eer0l0n1.jpg: Output in format A6 of the file
eer0l0np.pdf, see
eer0l0n1.
PS /
TXT /
PDF /
jpg
eer0: TUB-test chart eer0; Q/Fab(xr)-models for visual responses
Q/Fab(xr) with hyperbel functions e^(xr/a) and 10^(xr/a')
with contants a'=a ln(10) and a^n = a^1,0
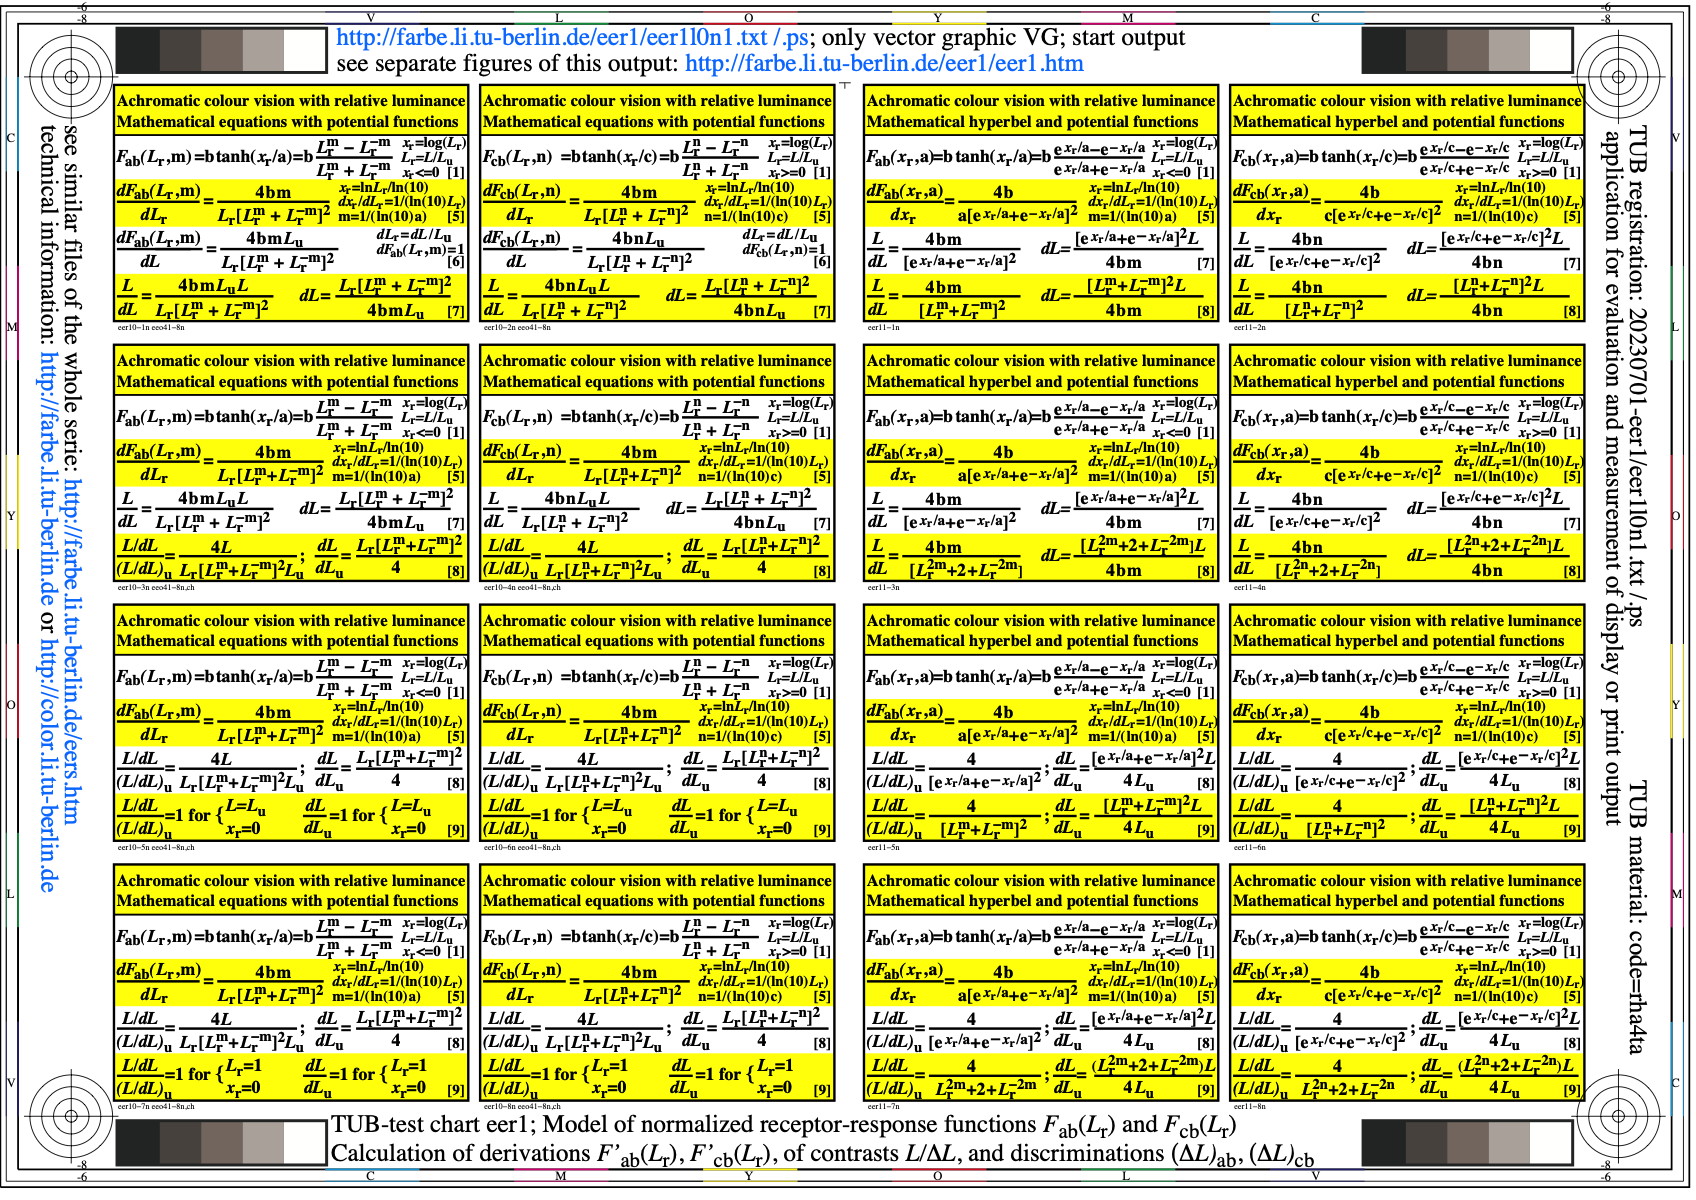
Image eer1l0n1.jpg: Output in format A6 of the file
eer1l0np.pdf, see
eer1l0n1.
PS /
TXT /
PDF /
jpg
eer1: TUB-test chart eer1; Fab(xr)-model for visual responses
Application of hyperbel function tanh on receptor responses
Presentation of the functions and derivation for discrimination
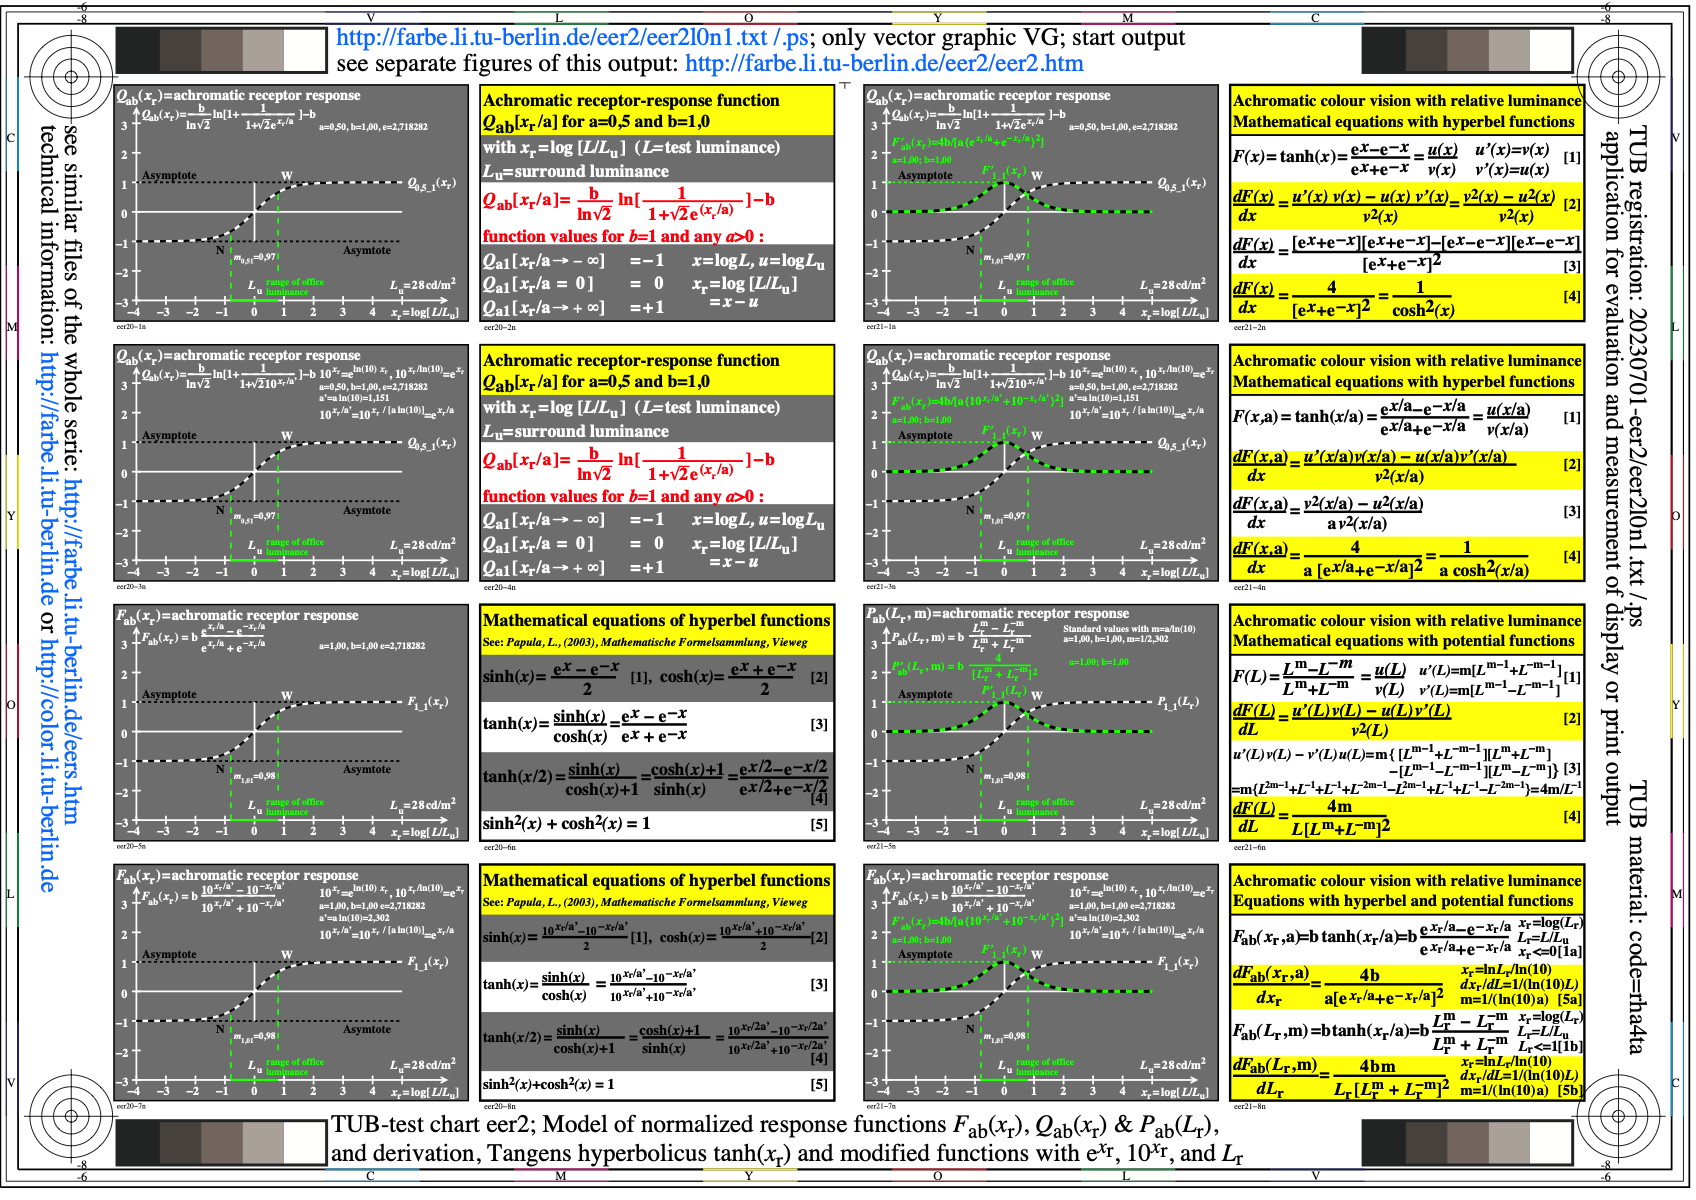
Image eer2l0n1.jpg: Output in format A6 of the file
eer2l0np.pdf, see
eer2l0n1.
PS /
TXT /
PDF /
jpg
eer2: TUB-test chart eer2; Q/Fab(xr)-models for visual responses
Q/Fab(xr) with hyperbel functions e^(xr/a) and 10^(xr/a')
with contants a'=a ln(10) and a^n = a^1,0
Image eer3l0n1.jpg: Output in format A6 of the file
eer3l0np.pdf, see
eer3l0n1.
PS /
TXT /
PDF /
jpg
eer3: TUB-test chart eer3; Under development
Image eer4l0n1.jpg: Output in format A6 of the file
eer4l0np.pdf, see
eer4l0n1.
PS /
TXT /
PDF /
jpg
eer4: TUB-test chart eer4; Under development

Image eer5l0n1.jpg: Output in format A6 of the file
eer5l0np.pdf, see
eer5l0n1.
PS /
TXT /
PDF /
jpg
eer5: TUB-test chart eer5; Under development

Image eer6l0n1.jpg: Output in format A6 of the file
eer6l0np.pdf, see
eer6l0n1.
PS /
TXT /
PDF /
jpg
eer6: TUB-test chart eer6; Experiments Lingelbach (77)
Approximat. Richter (86), tp=0,4s, 9 observers, equations
and potential-A3 fit, 2 x 5 Lu, range 0,1 to 6000 cd/m^2
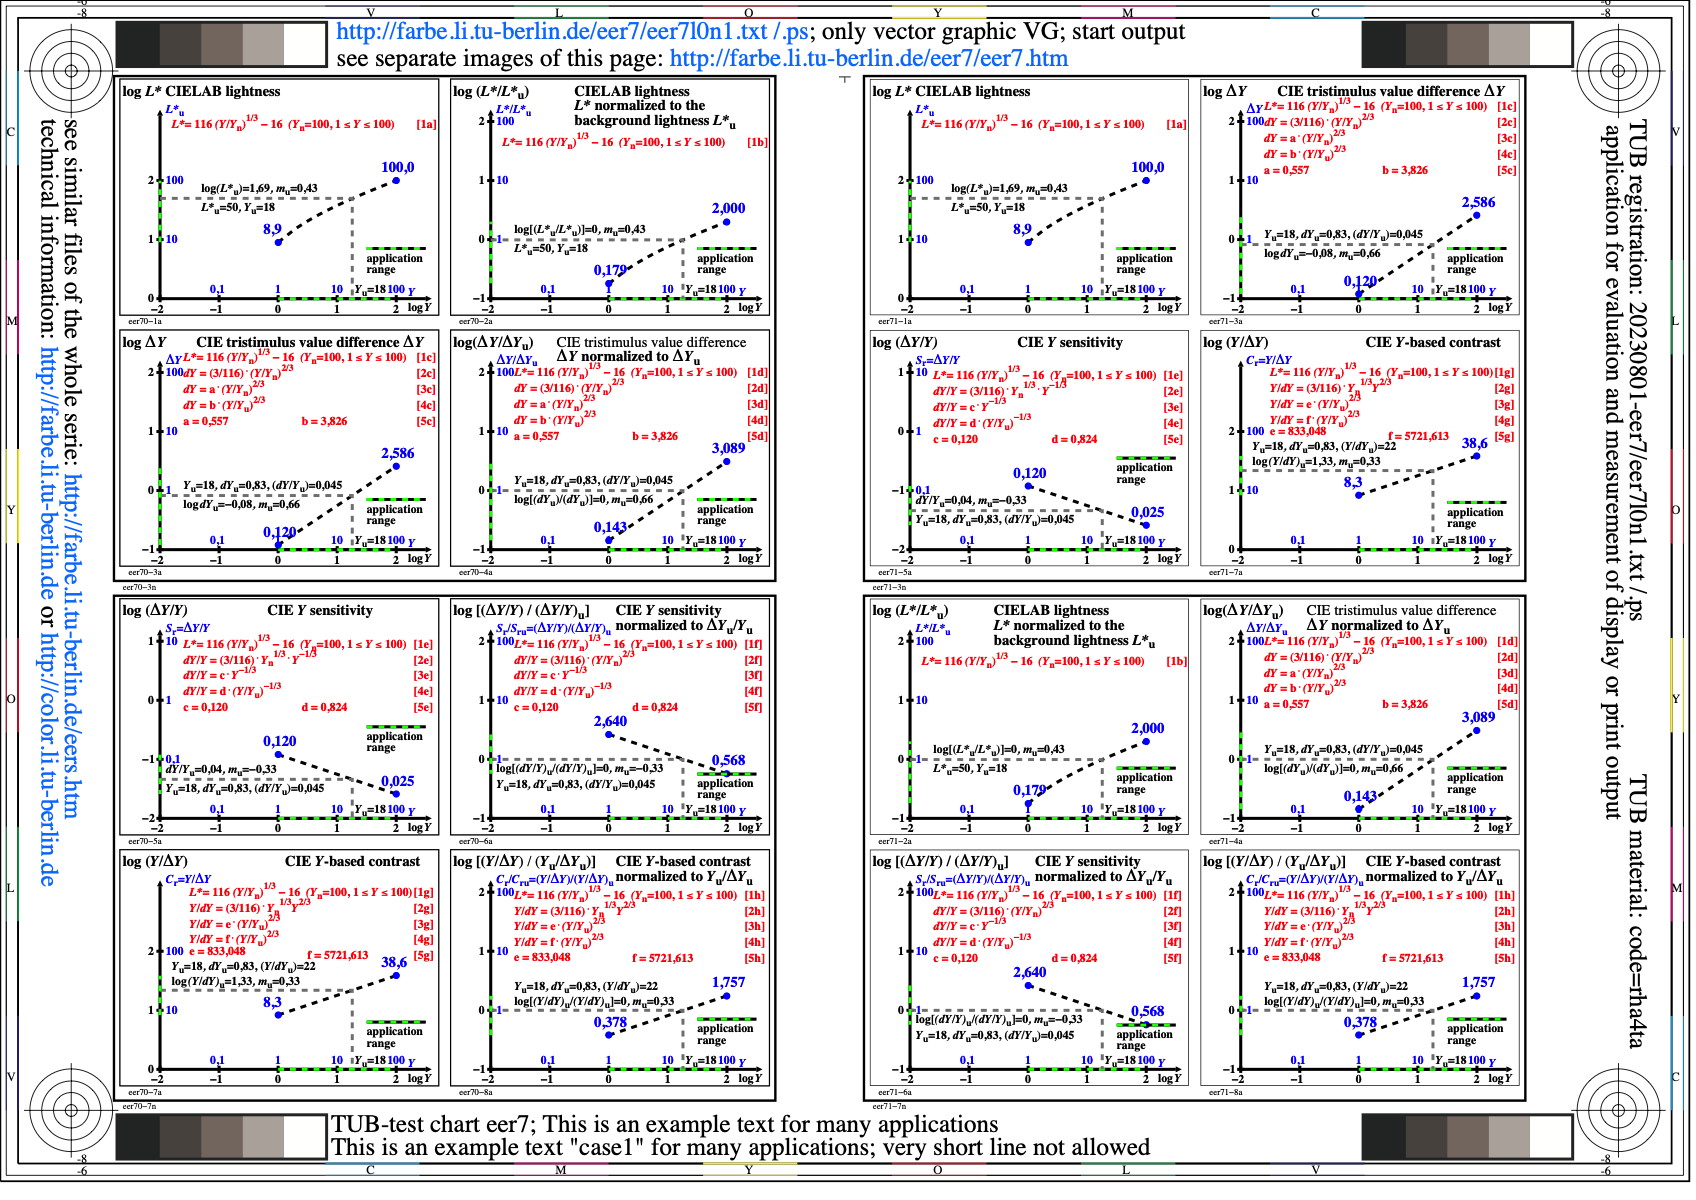
Image eer7l0n1.jpg: Output in format A6 of the file
eer7l0np.pdf, see
eer7l0n1.
PS /
TXT /
PDF /
jpg
eer7: TUB-test chart eer7; Threshold experiments
Lingelbach (77), tp=0,4s, 9 observers, equations
and exponential-A2 fit, 2 x 5 Lu, range 0,1 to 6000 cd/m^2
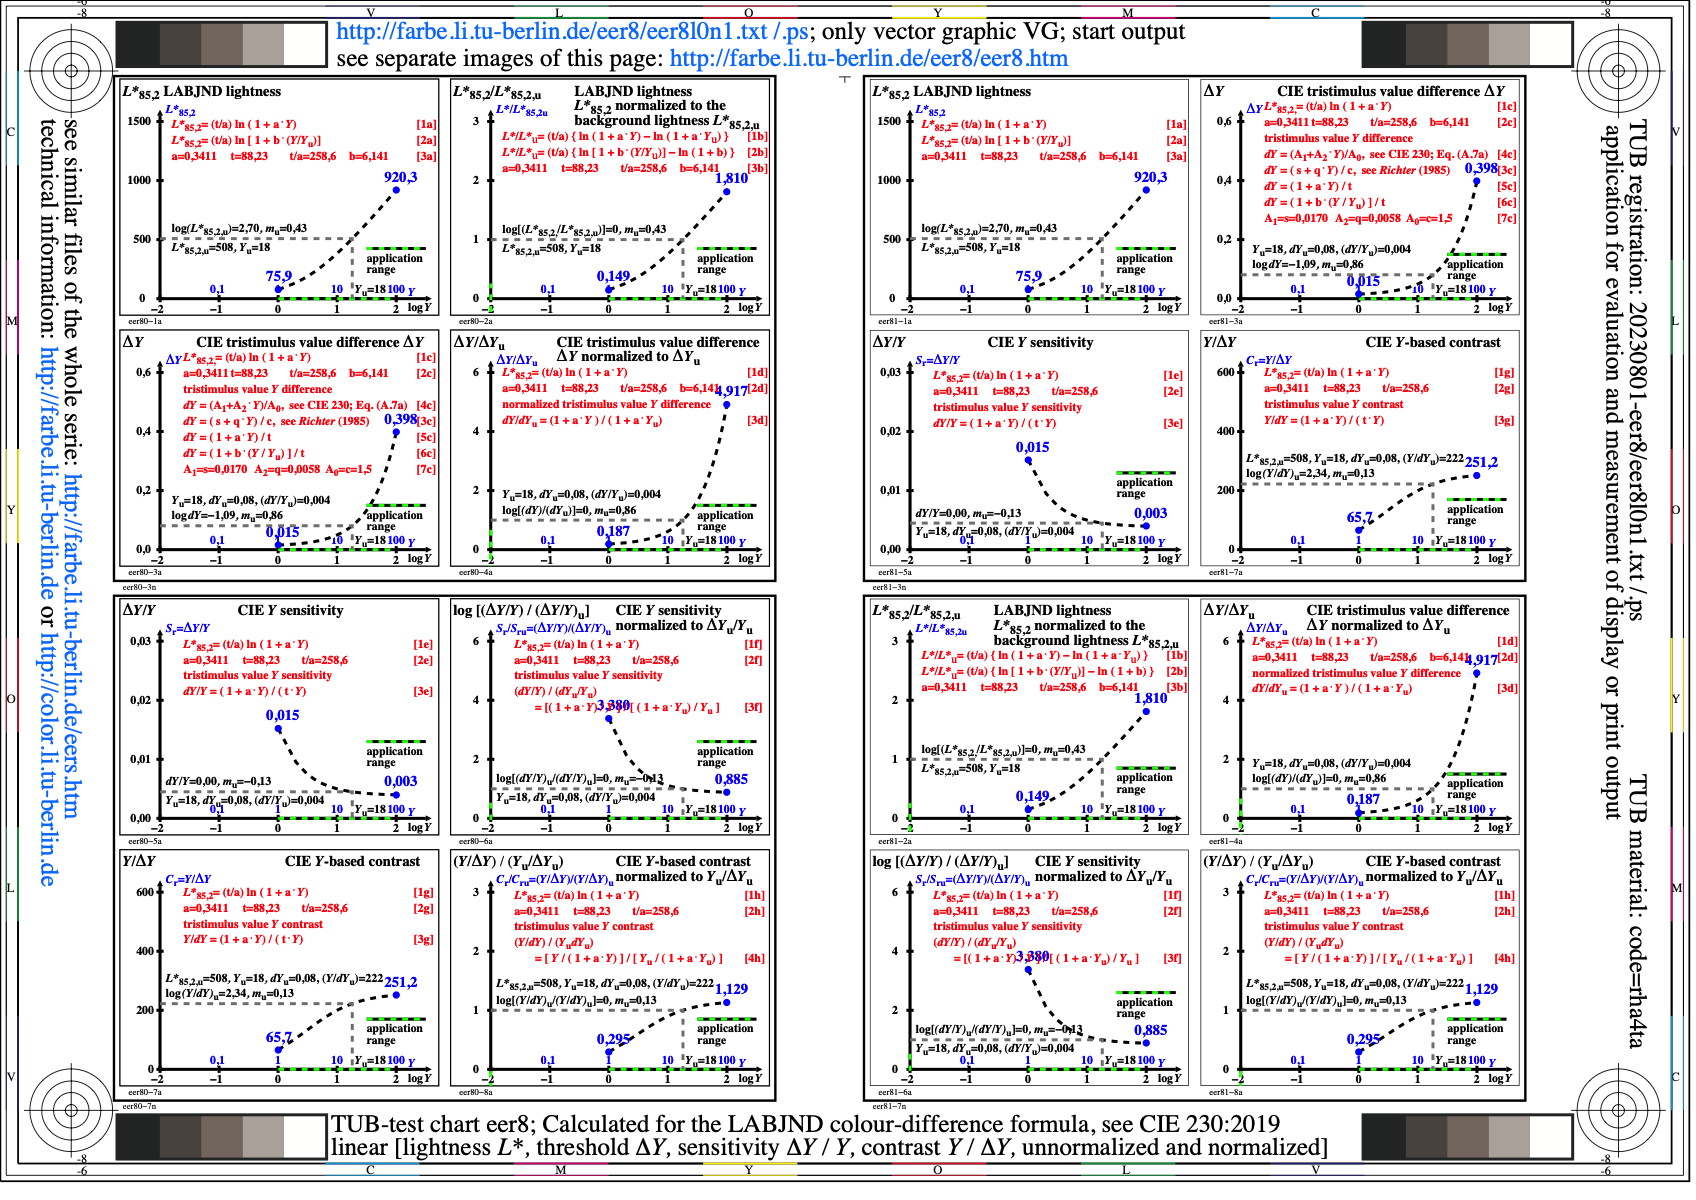
Image eer8l0n1.jpg: Output in format A6 of the file
eer8l0np.pdf, see
eer8l0n1.
PS /
TXT /
PDF /
jpg
eer8: TUB-test chart eer8; Threshold experiments
Lingelbach (77), tp=0,4s, 9 observers, equations
and exponential-A4 fit, 2 x 5 Lu, range 0,1 to 6000 cd/m^2
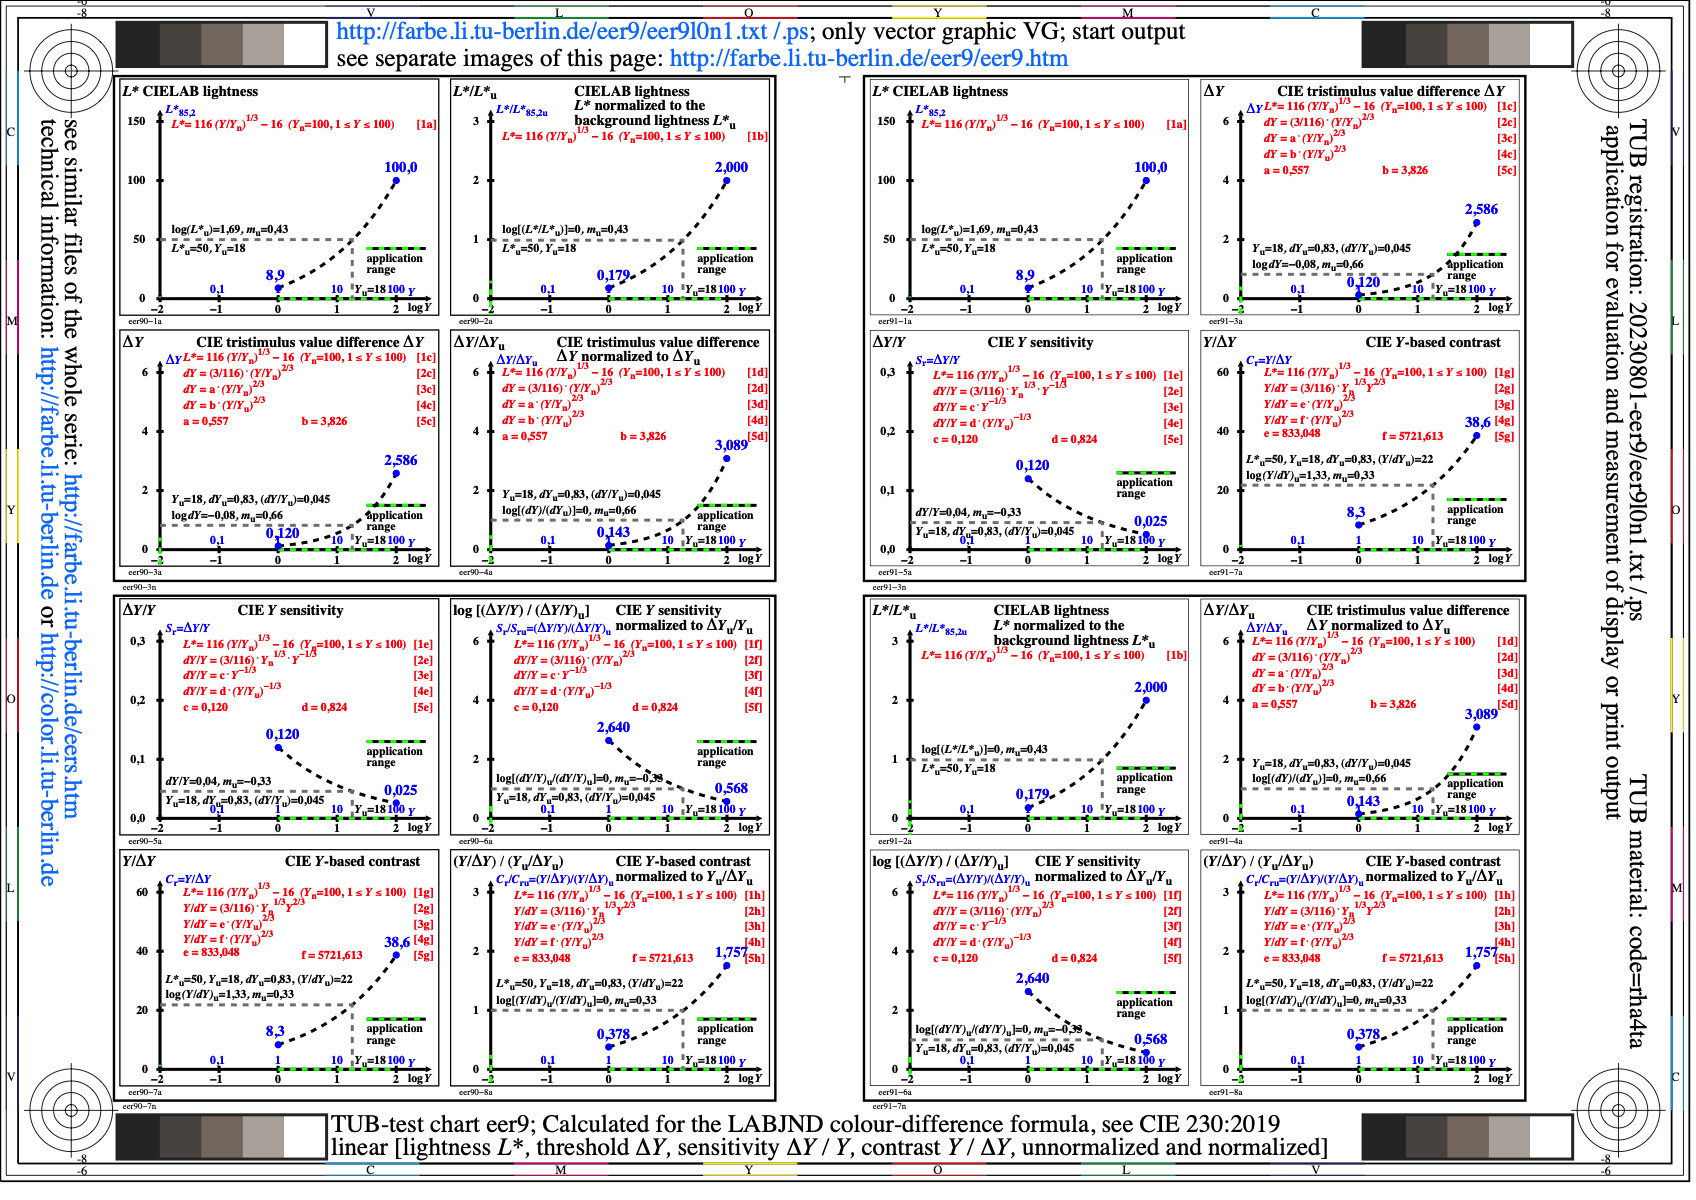
Image eer9l0n1.jpg: Output in format A6 of the file
eer9l0np.pdf, see
eer9l0n1.
PS /
TXT /
PDF /
jpg
eer9: TUB-test chart eer9; Under development
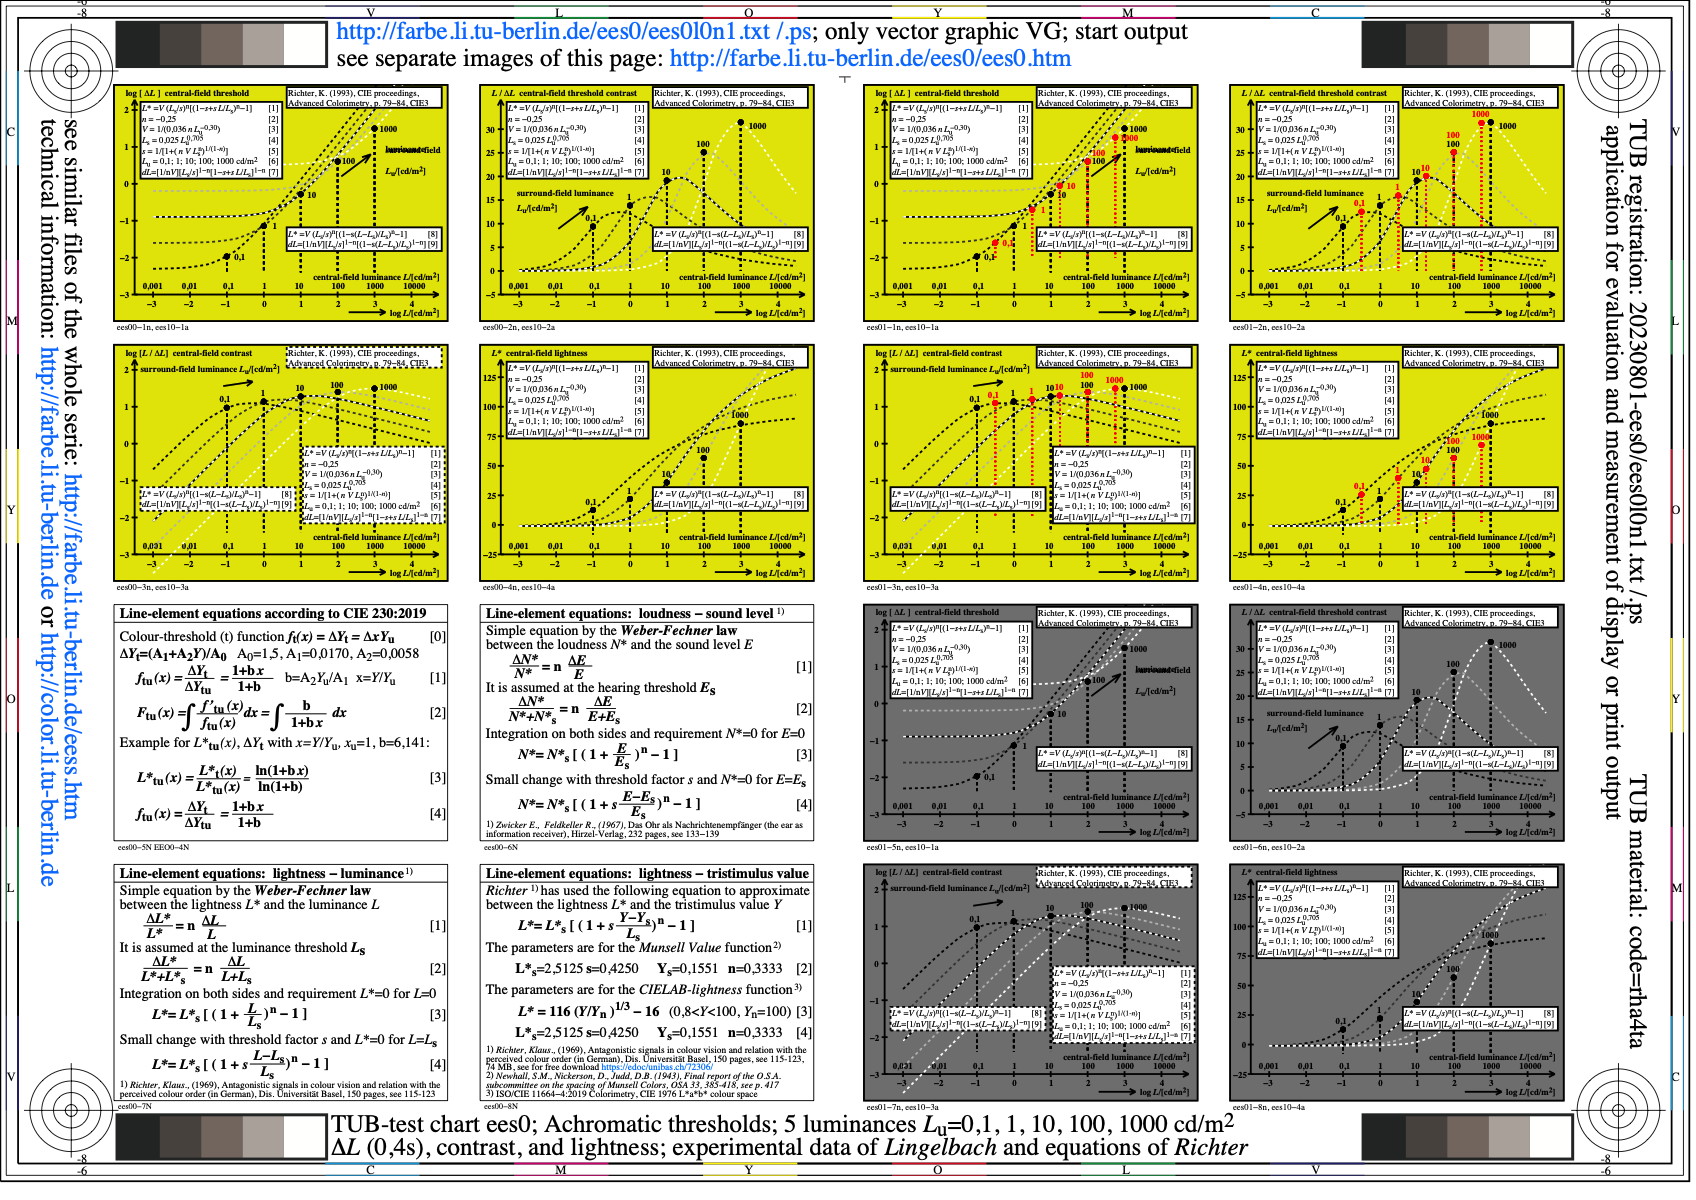
Image ees0l0n1.jpg: Output in format A6 of the file
ees0l0np.pdf, see
ees0l0n1.
PS /
TXT /
PDF /
jpg
ees0: TUB-test chart ees0; Colour metric for 5 luminances Lu
thresholds delta_L (0,4s), contrast and lightness;
experimental data of Lingelbach and Richter
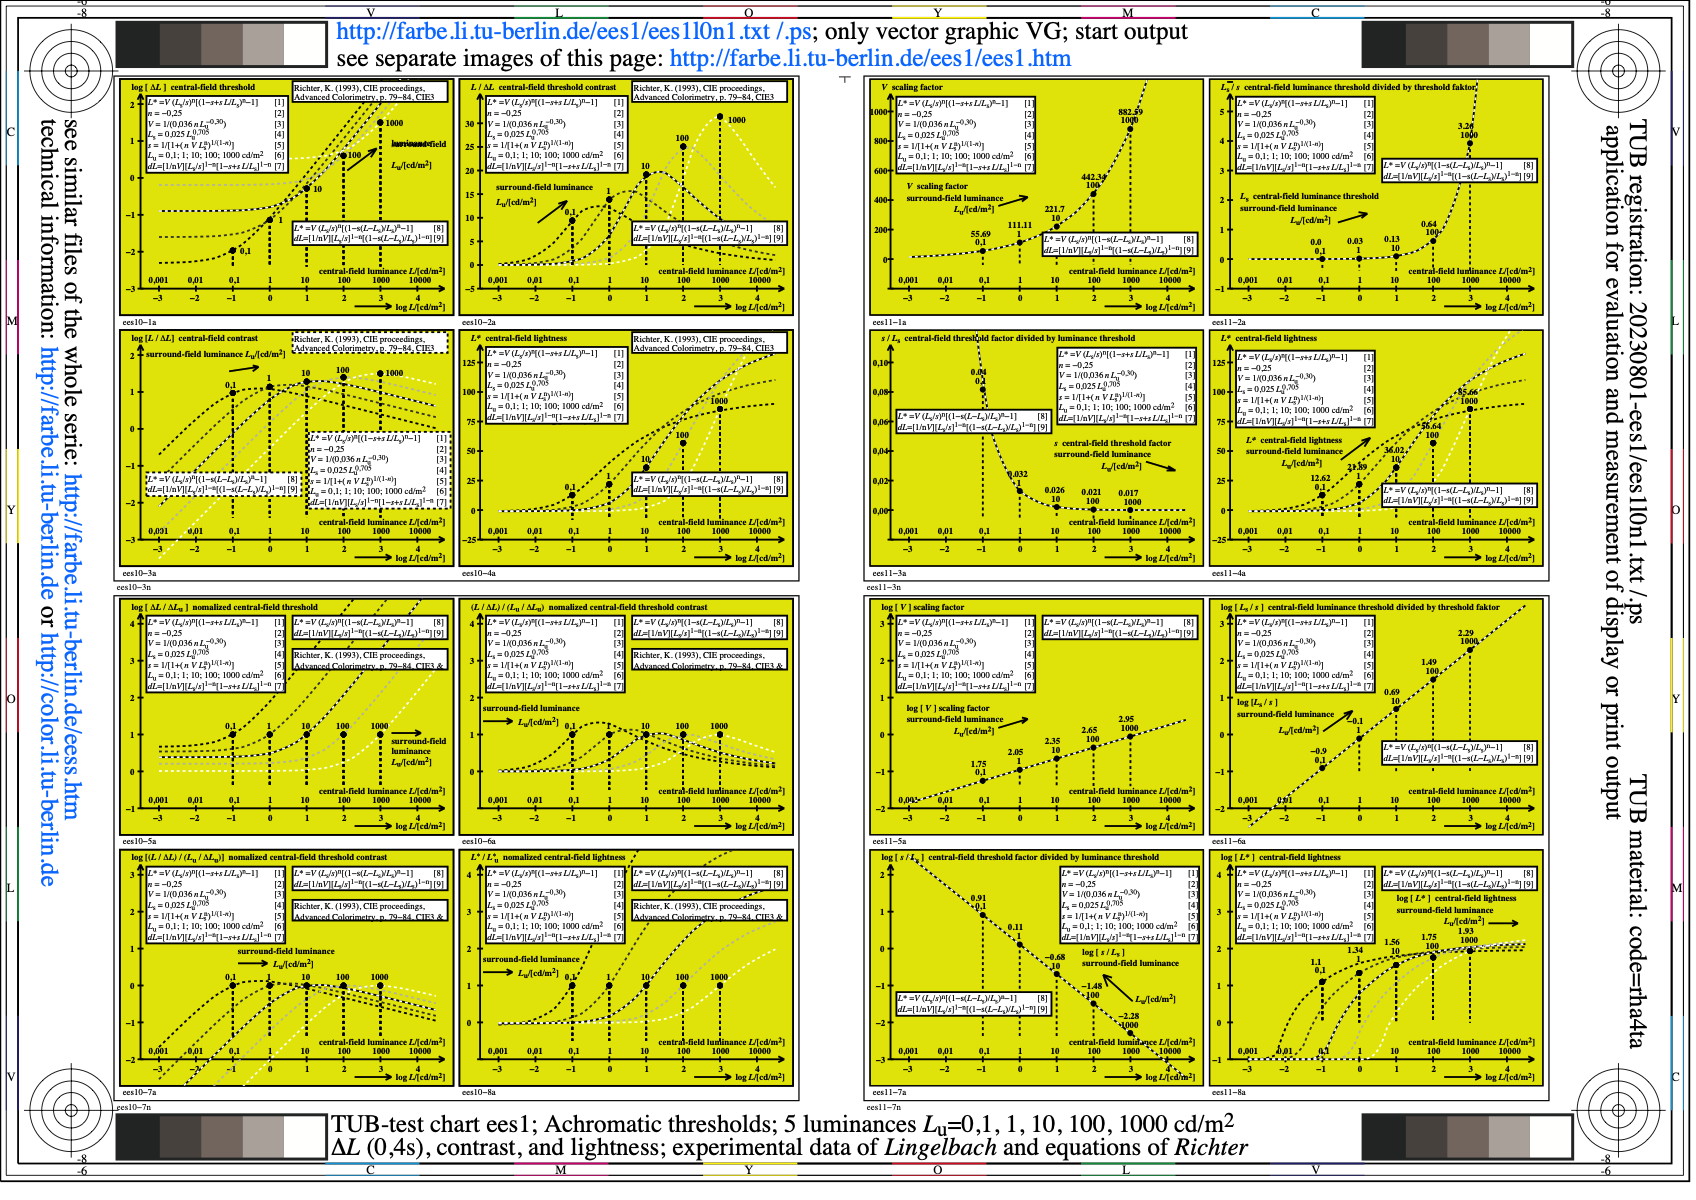
Image ees1l0n1.jpg: Output in format A6 of the file
ees1l0np.pdf, see
ees1l0n1.
PS /
TXT /
PDF /
jpg
ees1: TUB-test chart ees1; Achromatic thresholds, 5 Lu on Y
thresholds delta_L (0,4s), contrast and lightness;
experimental data of Lingelbach and Richter
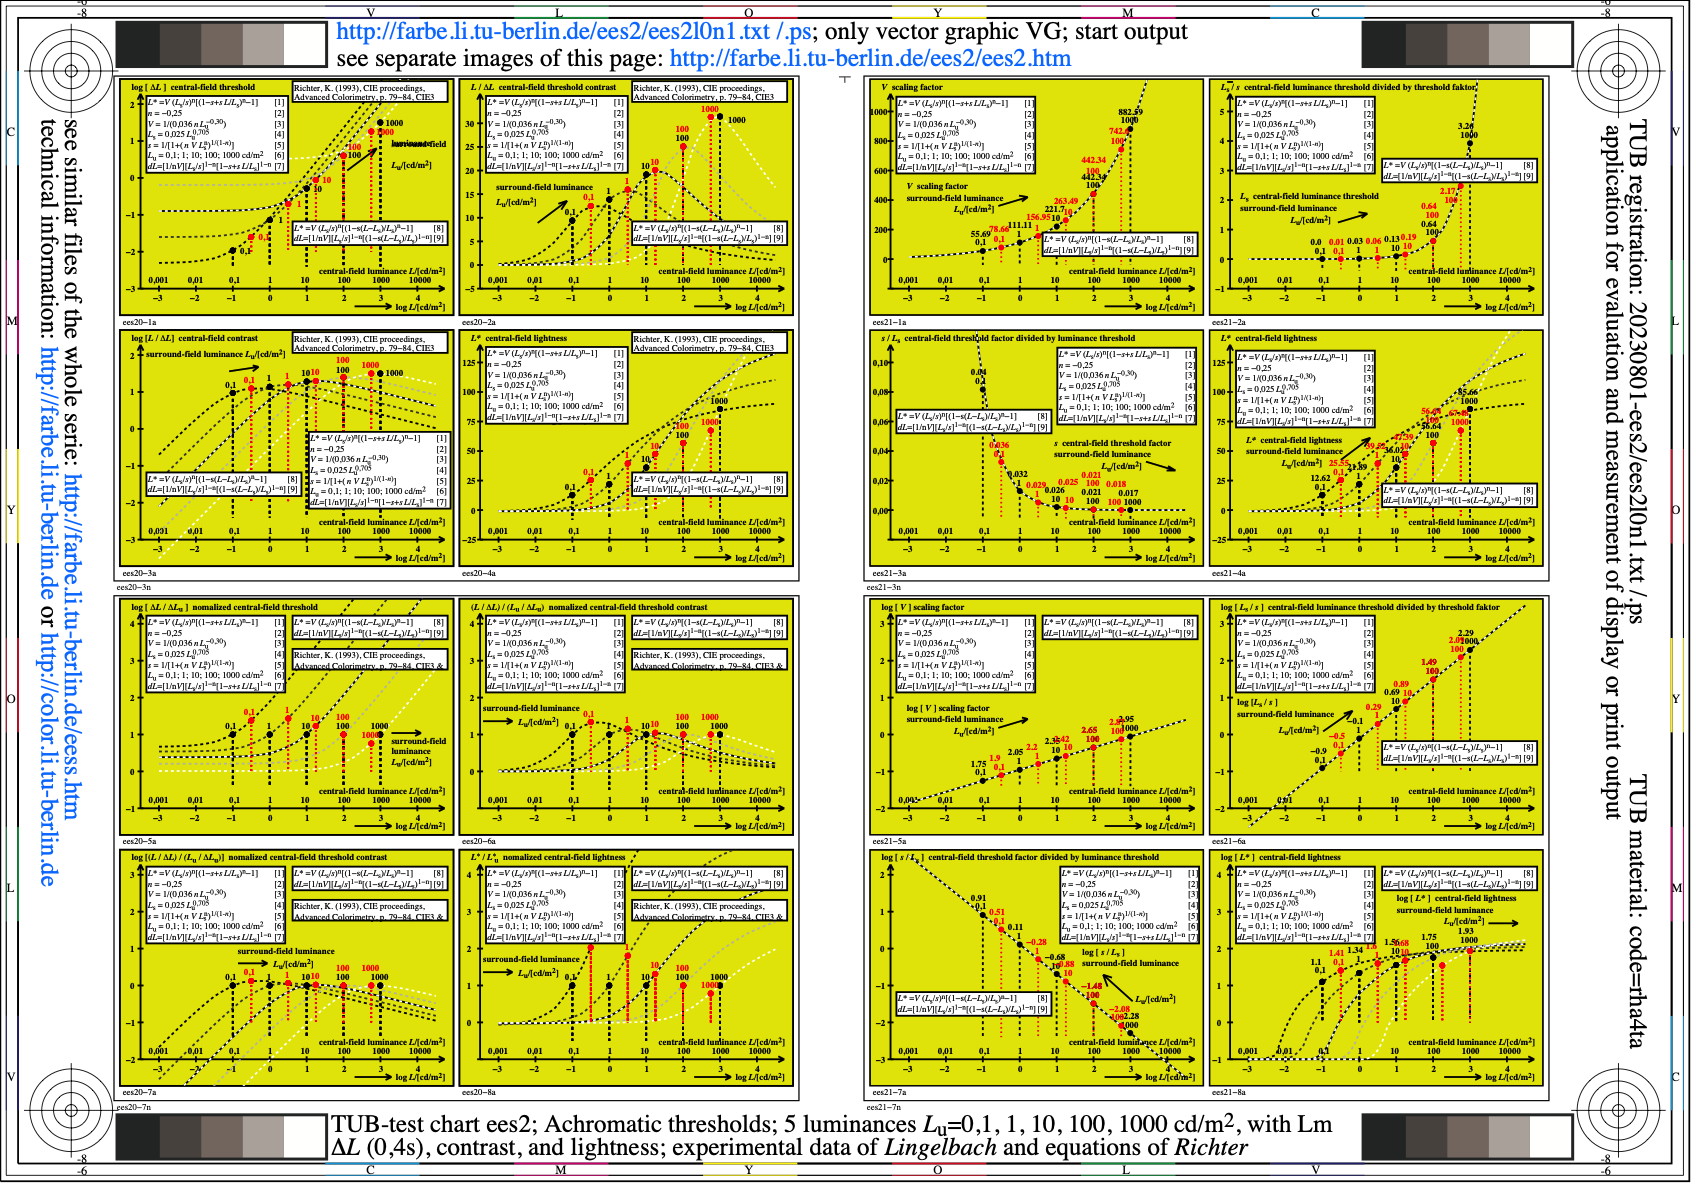
Image ees2l0n1.jpg: Output in format A6 of the file
ees2l0np.pdf, see
ees2l0n1.
PS /
TXT /
PDF /
jpg
ees2: TUB-test chart ees2; Achromatic thresholds, 5 Lu & Lm on Y
thresholds delta_L (0,4s), contrast and lightness;
experimental data of Lingelbach and Richter
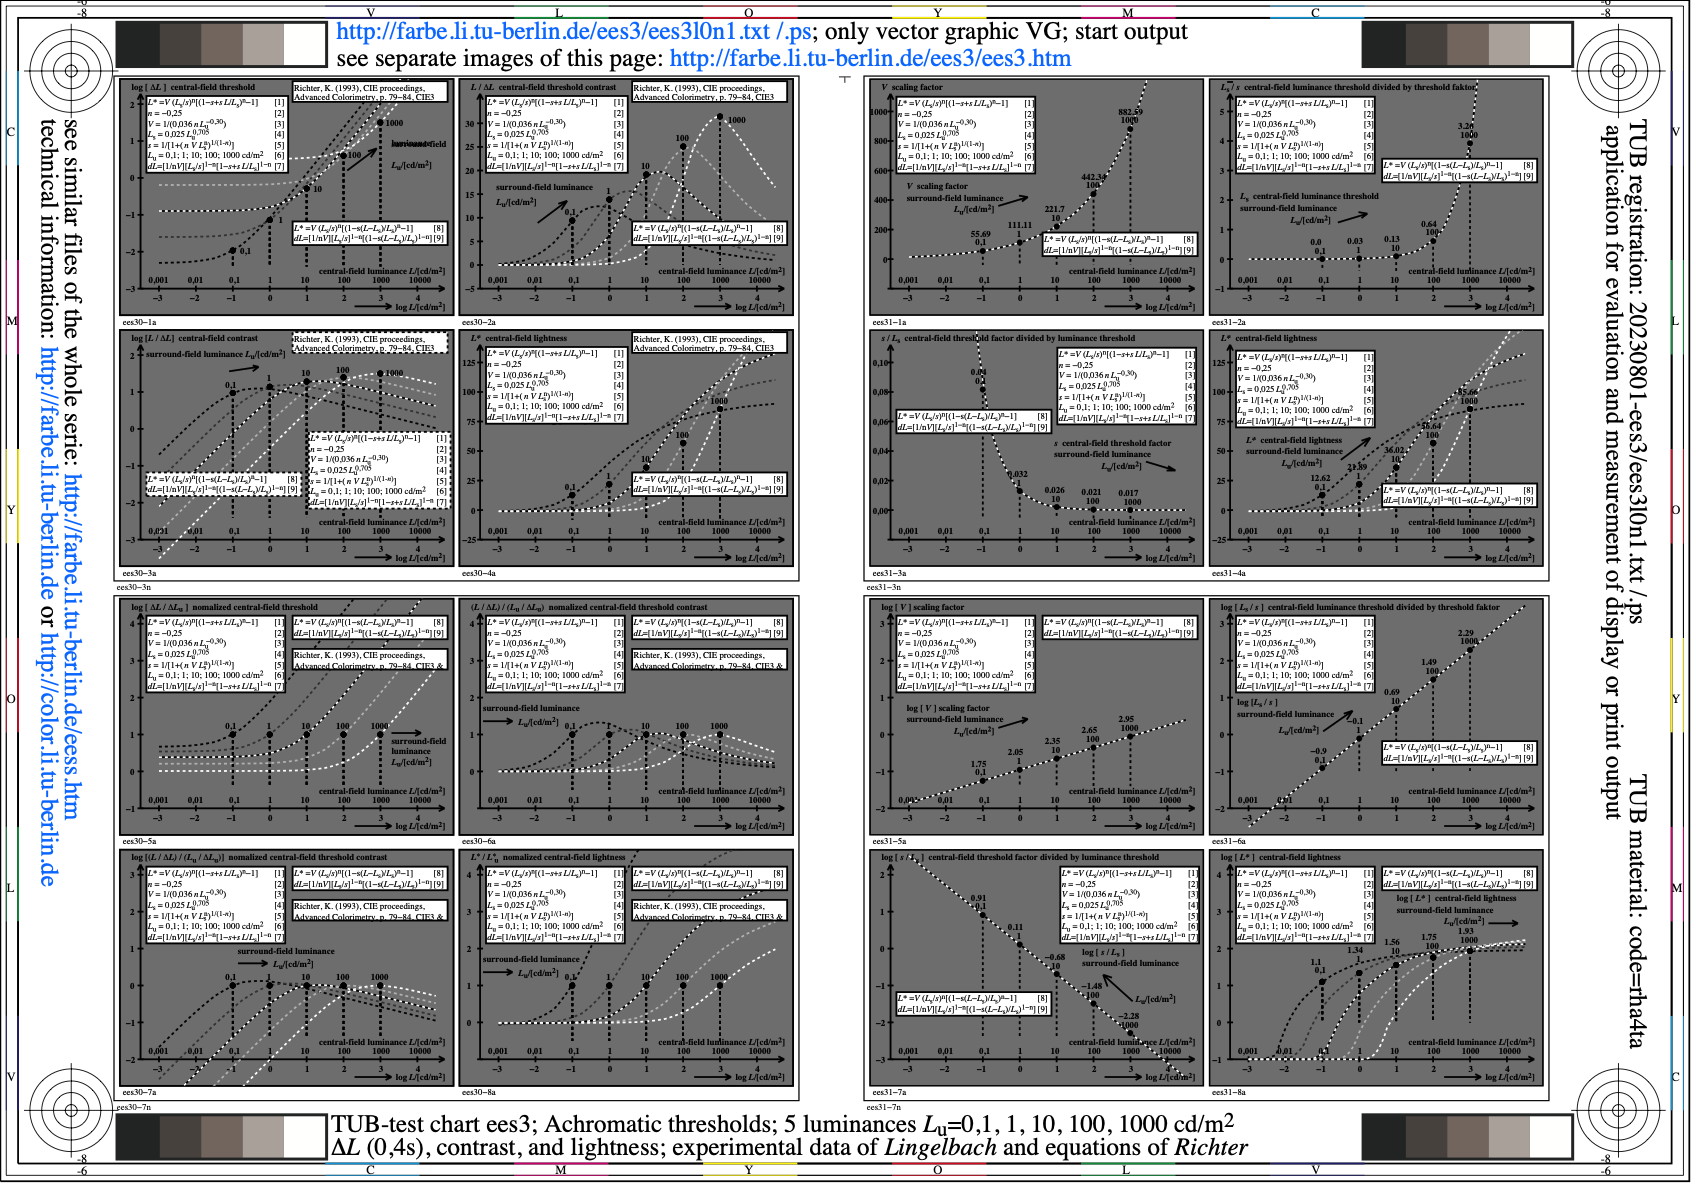
Image ees3l0n1.jpg: Output in format A6 of the file
ees3l0np.pdf, see
ees3l0n1.
PS /
TXT /
PDF /
jpg
ees3: TUB-test chart ees3; Achromatic thresholds, 5 Lu on U
thresholds delta_L (0,4s), contrast and lightness;
experimental data of Lingelbach and Richter

Image ees4l0n1.jpg: Output in format A6 of the file
ees4l0np.pdf, see
ees4l0n1.
PS /
TXT /
PDF /
jpg
ees4: TUB-test chart ees4; Achromatic thresholds, 5 Lu & Lm on U
thresholds delta_L (0,4s), contrast and lightness;
experimental data of Lingelbach and Richter
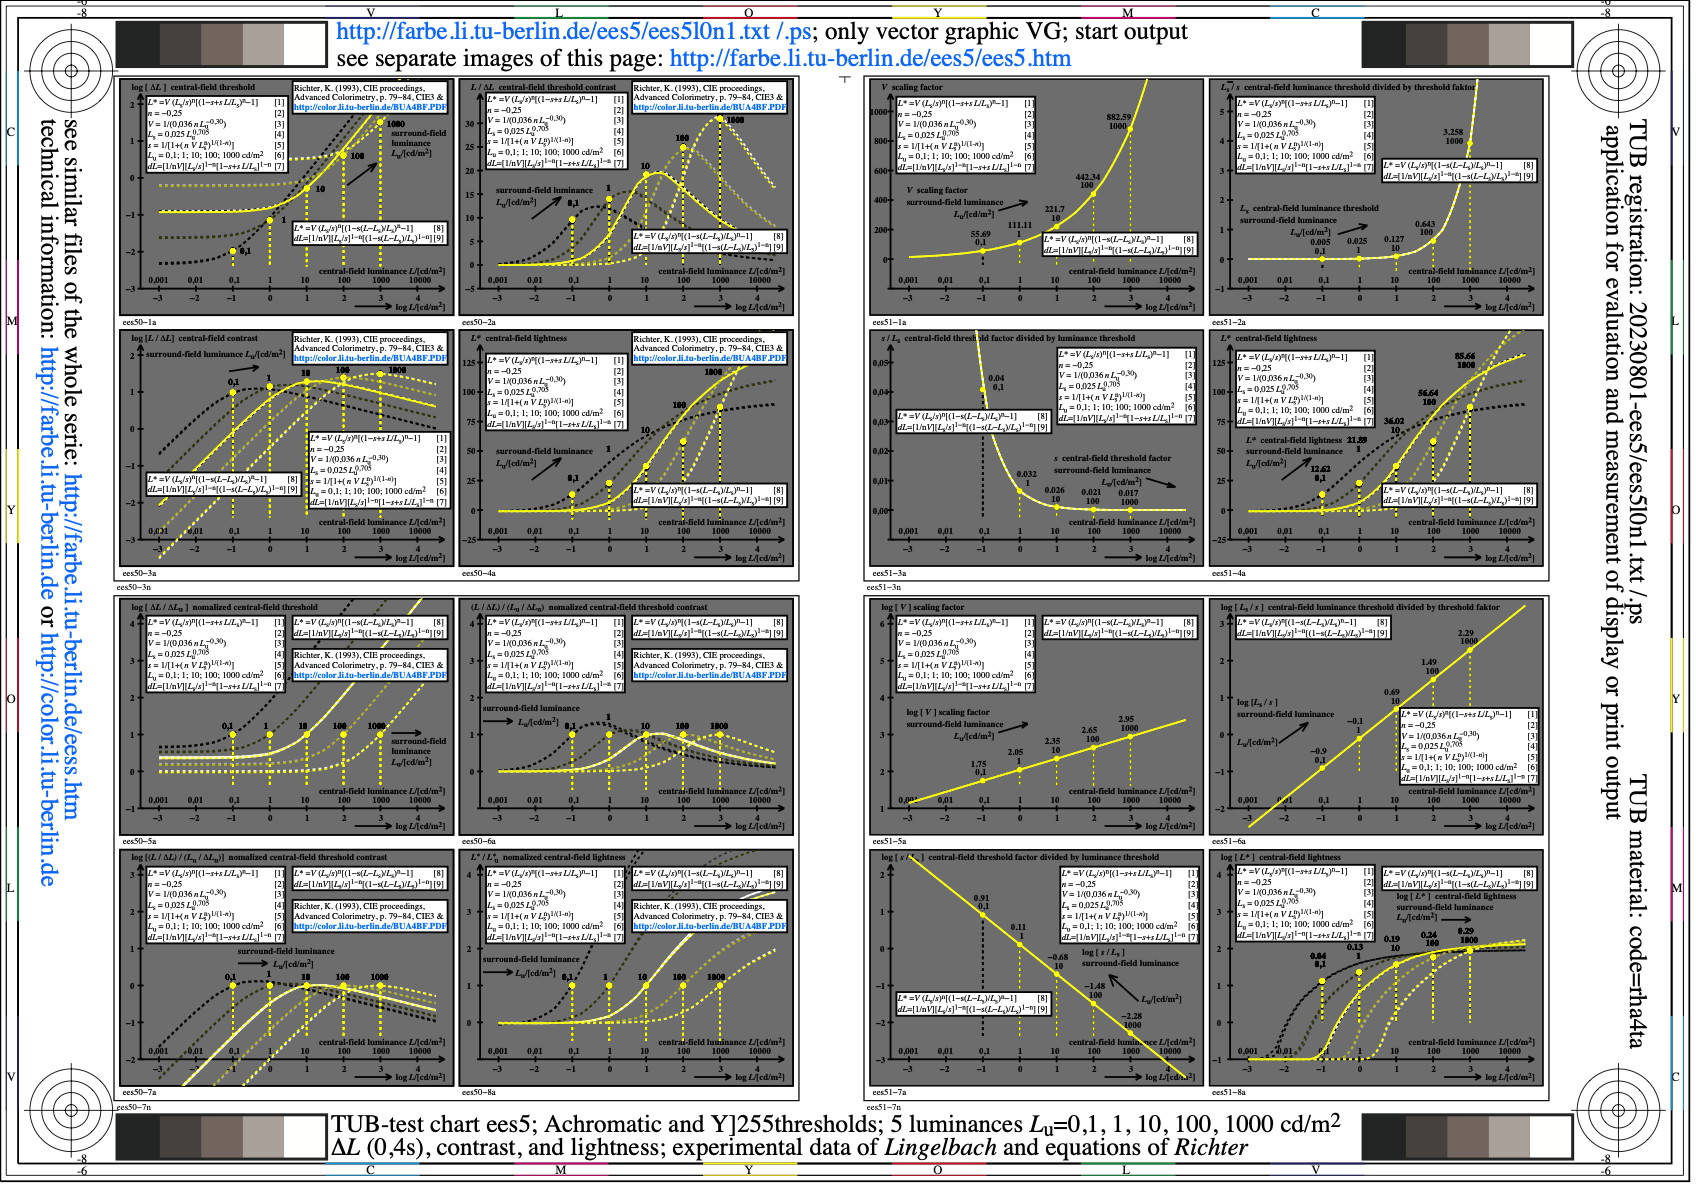
Image ees5l0n1.jpg: Output in format A6 of the file
ees5l0np.pdf, see
ees5l0n1.
PS /
TXT /
PDF /
jpg
ees5: TUB-test chart ees5; Achromatic and U&Y thresholds, 5 Lu
thresholds delta_L (0,4s), contrast and lightness;
experimental data of Lingelbach and Richter
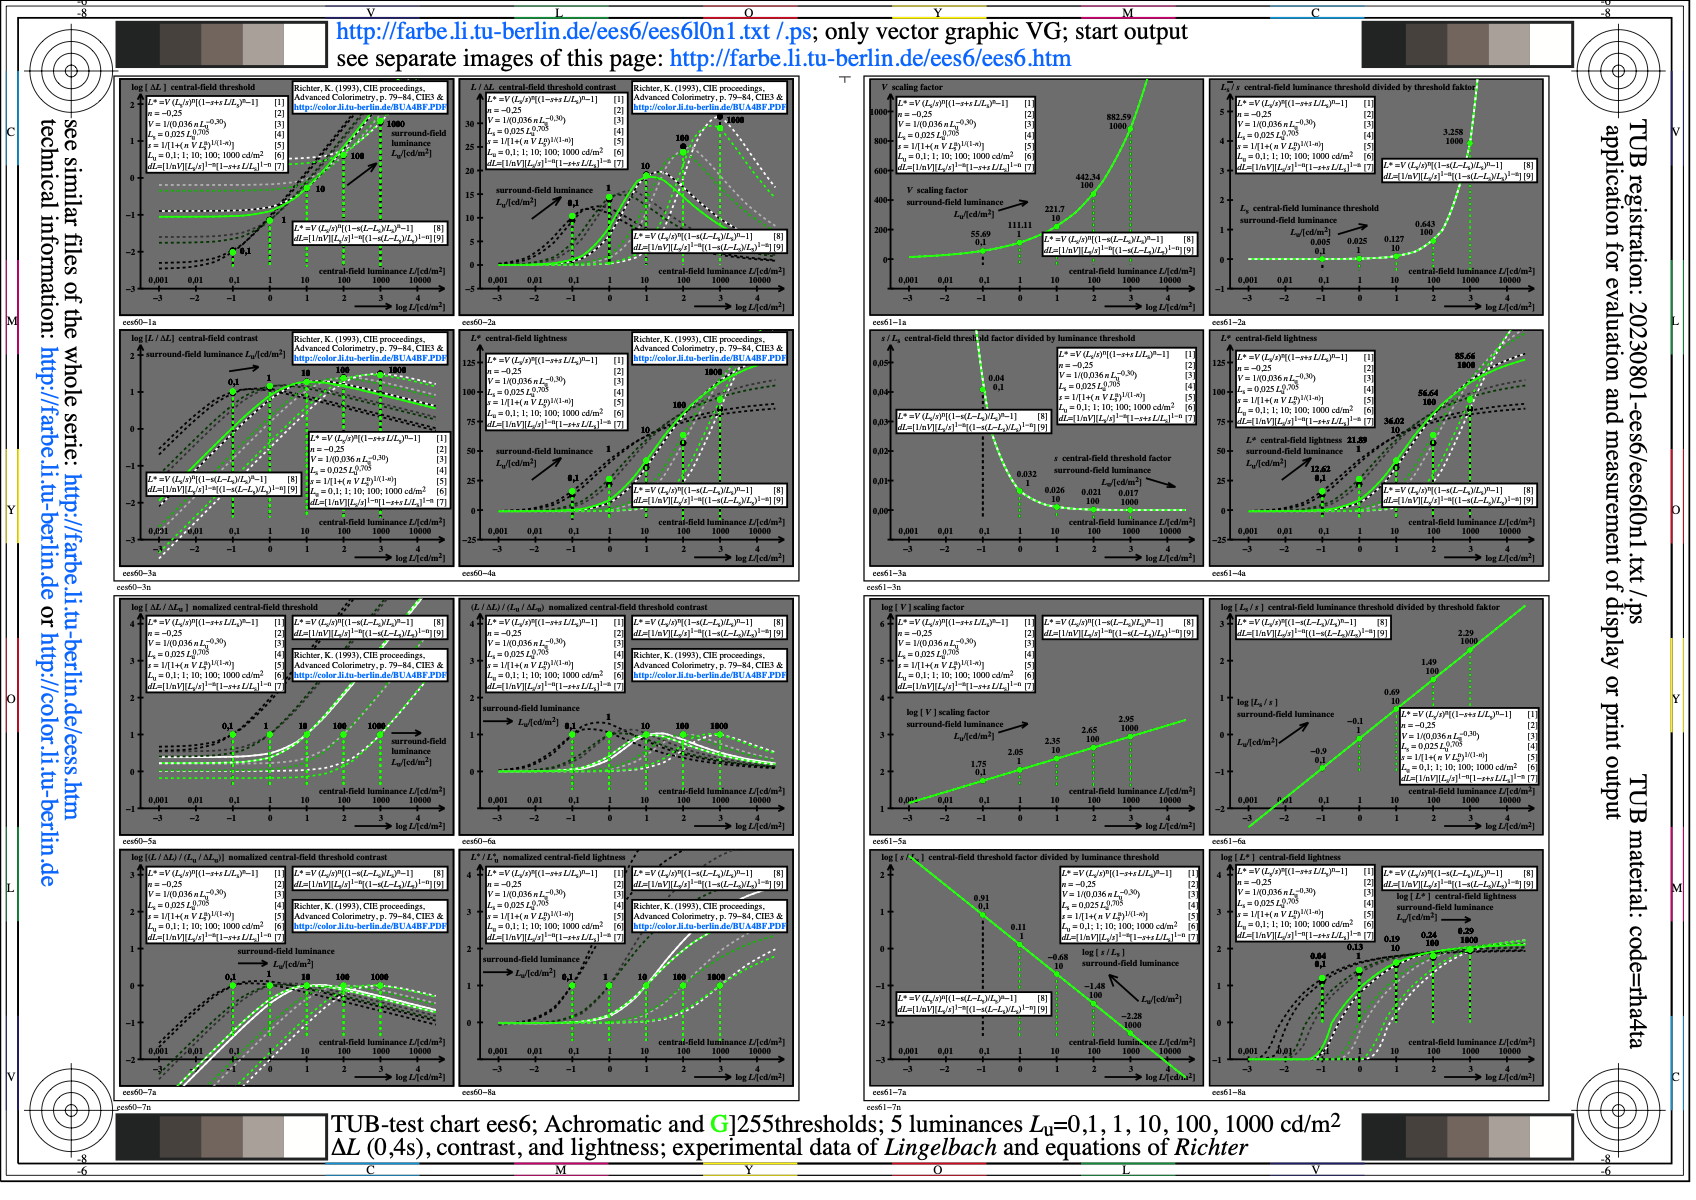
Image ees6l0n1.jpg: Output in format A6 of the file
ees6l0np.pdf, see
ees6l0n1.
PS /
TXT /
PDF /
jpg
ees6: TUB-test chart ees6; Achromatic amd U&G thresholds, 5 Lu
thresholds delta_L (0,4s), contrast and lightness;
experimental data of Lingelbach and Richter
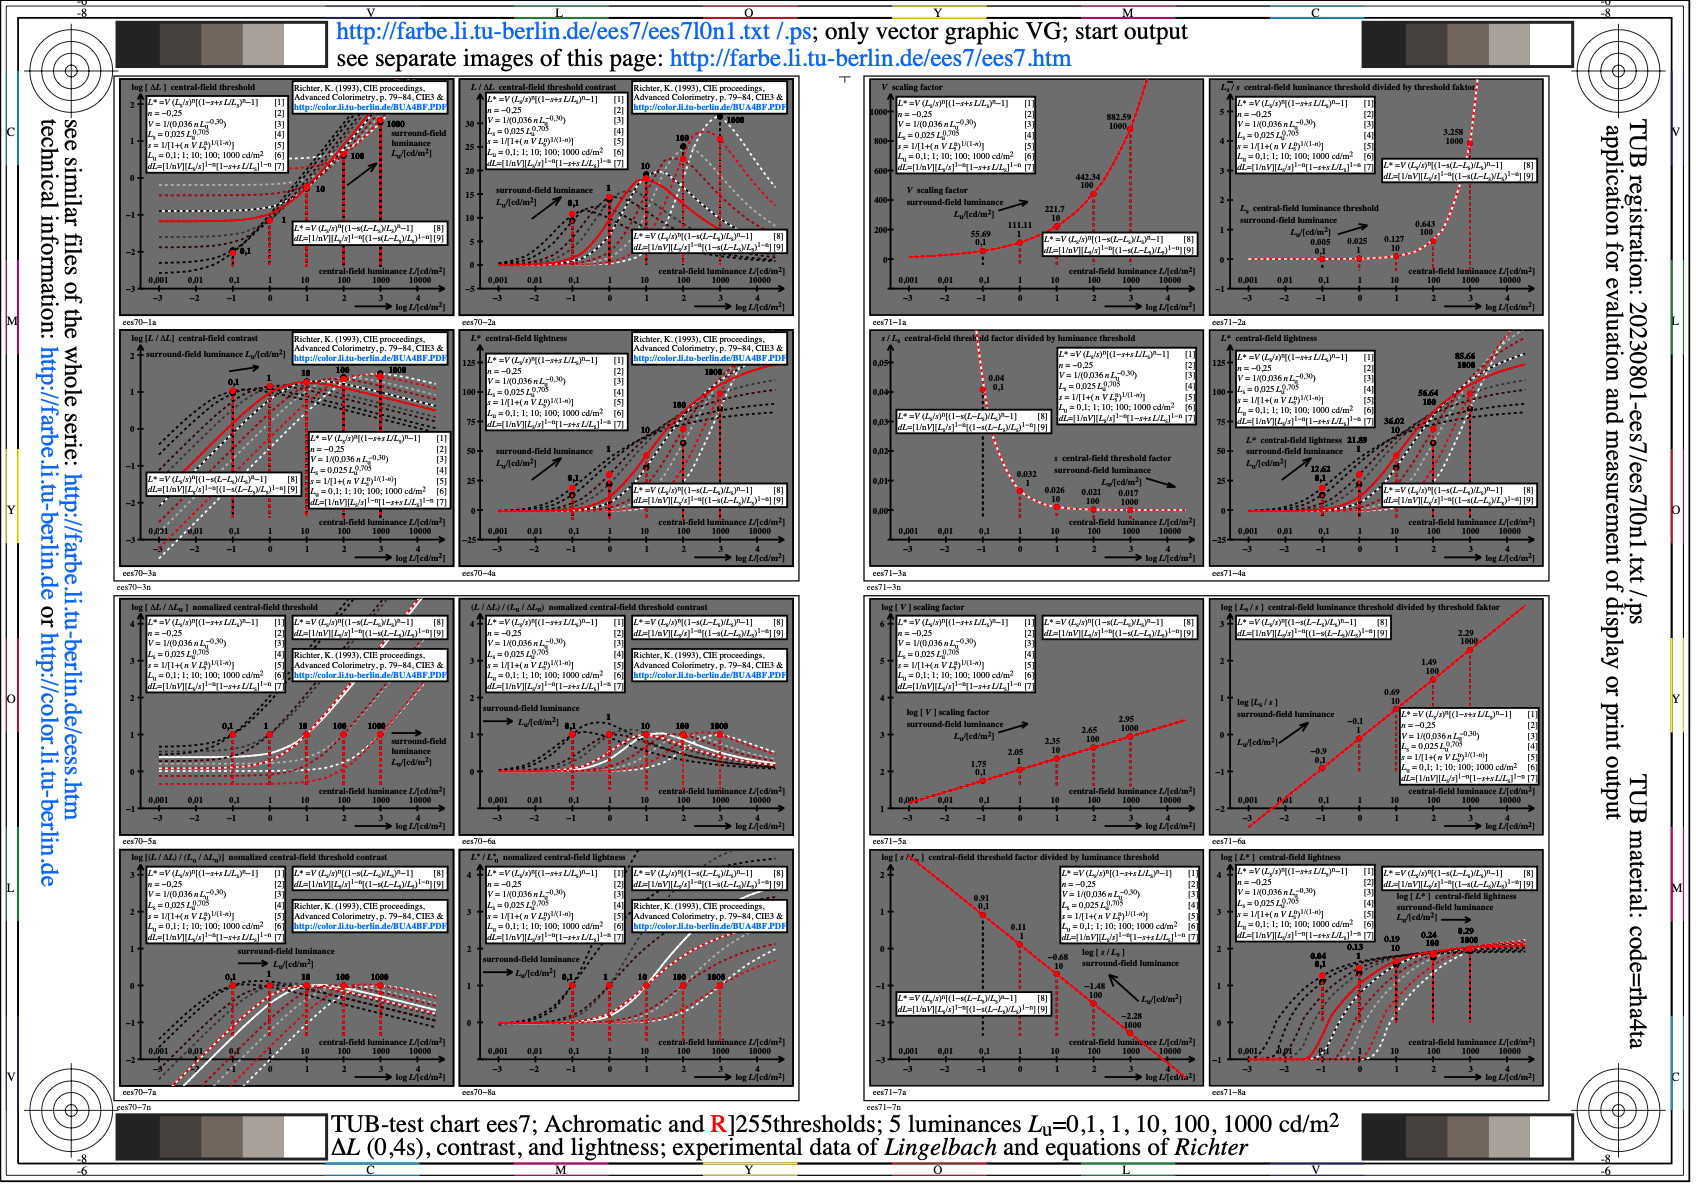
Image ees7l0n1.jpg: Output in format A6 of the file
ees7l0np.pdf, see
ees7l0n1.
PS /
TXT /
PDF /
jpg
ees7: TUB-test chart ees7; Achromatic and U&R thresholds, 5 Lu
thresholds delta_L (0,4s), contrast and lightness;
experimental data of Lingelbach and Richter
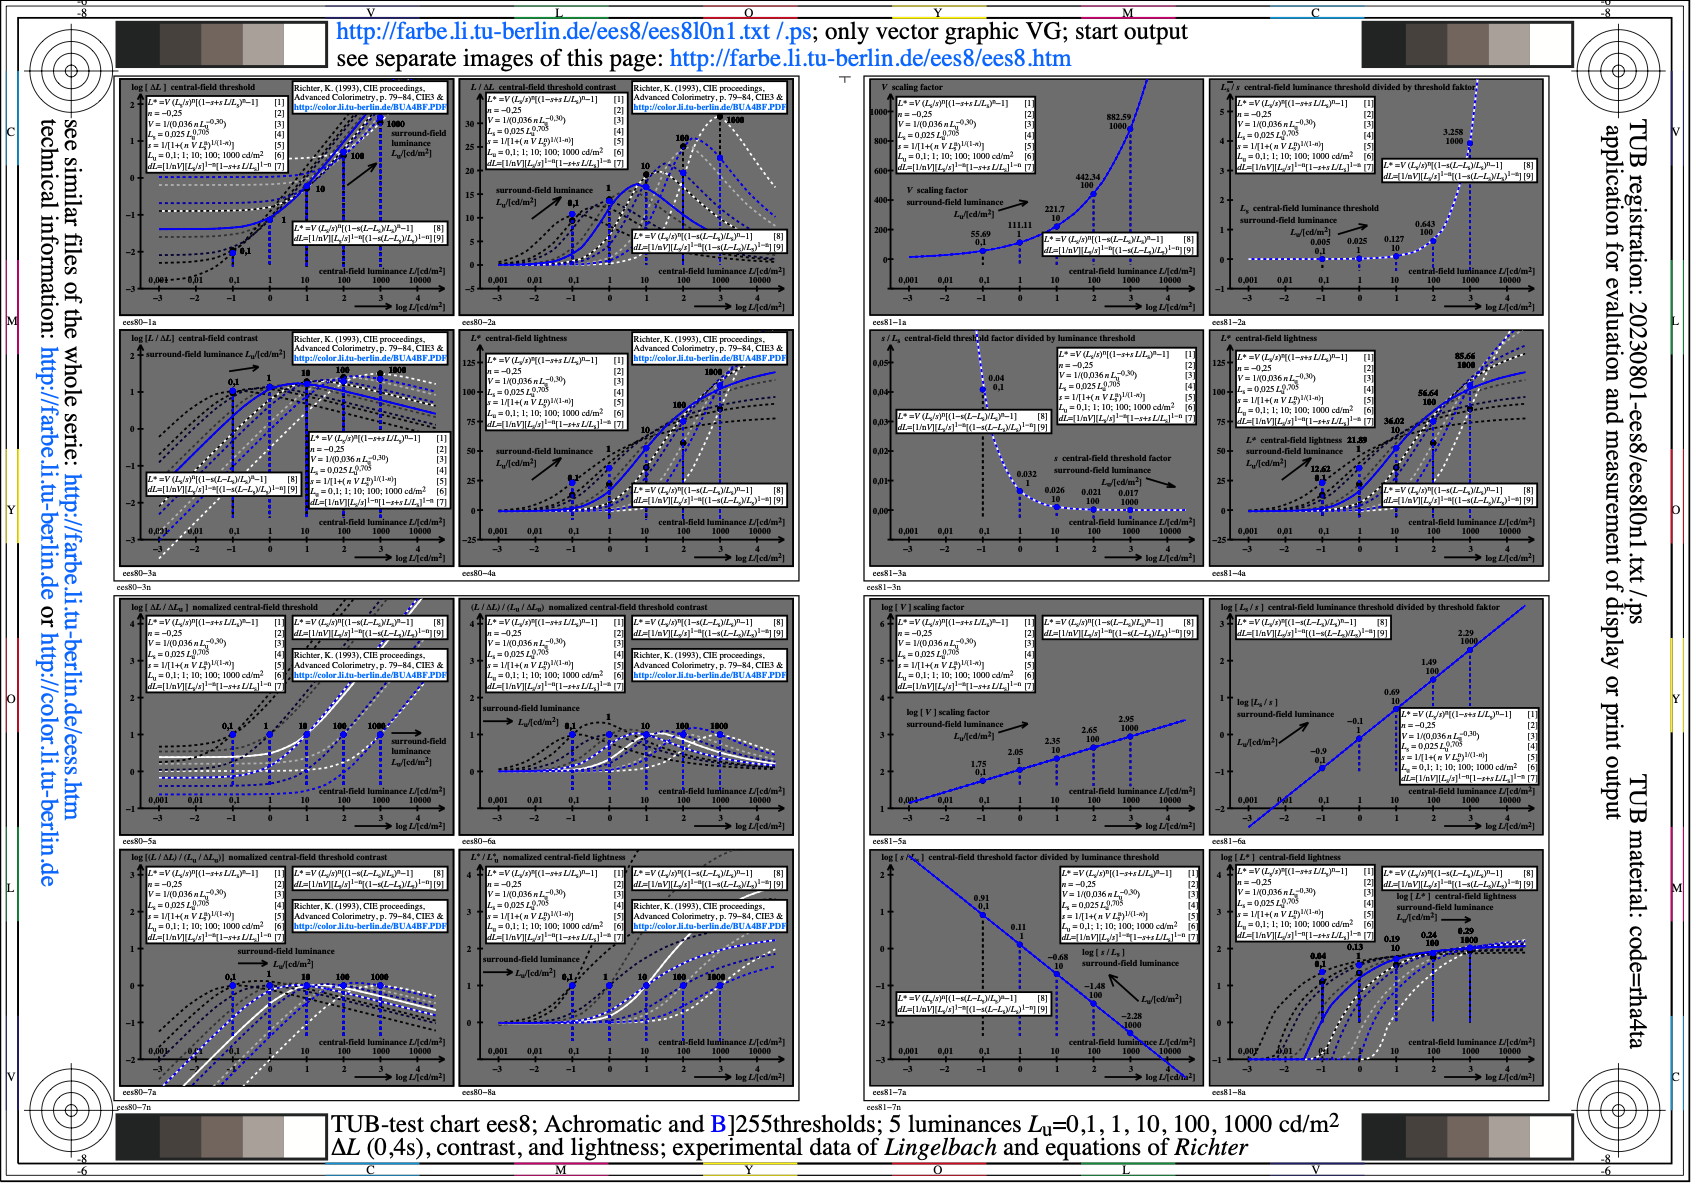
Image ees8l0n1.jpg: Output in format A6 of the file
ees8l0np.pdf, see
ees8l0n1.
PS /
TXT /
PDF /
jpg
ees8: TUB-test chart ees8; Achromatic and U&B thresholds, 5 Lu
thresholds delta_L (0,4s), contrast and lightness;
experimental data of Lingelbach and Richter
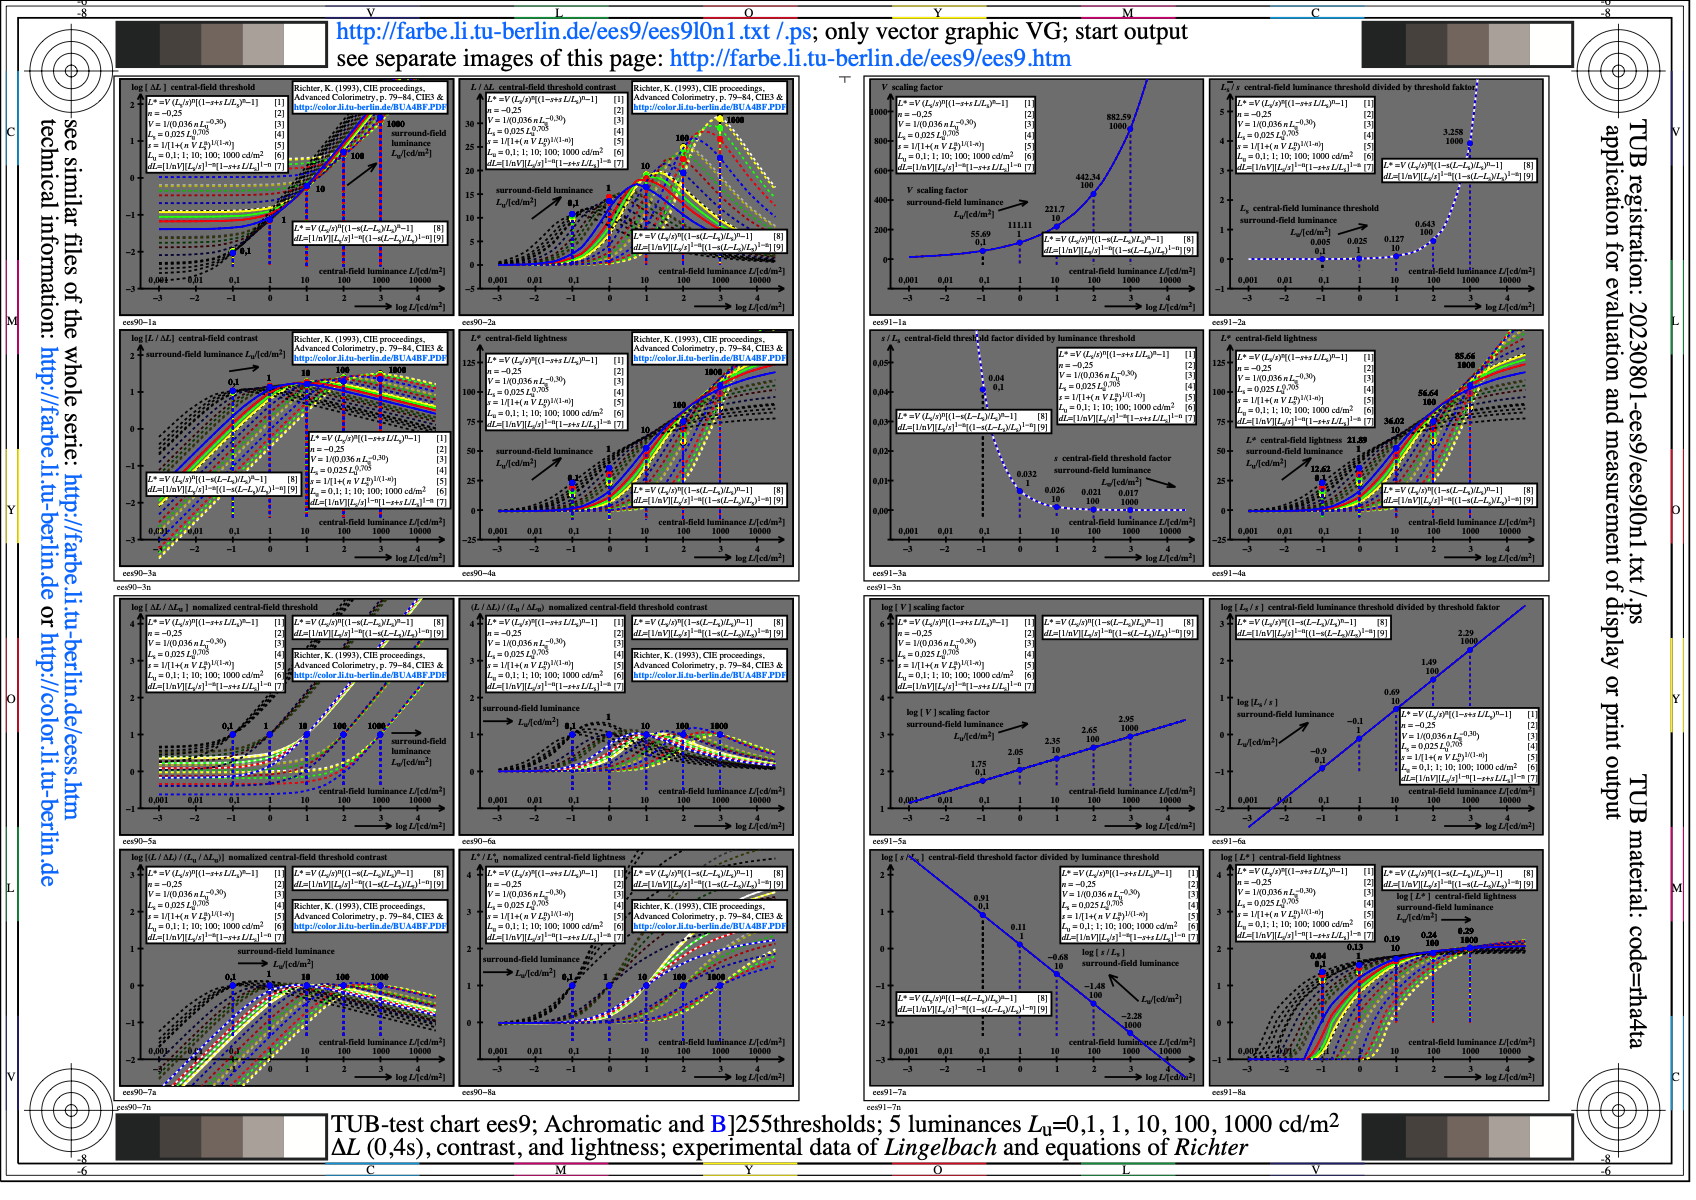
Image ees9l0n1.jpg: Output in format A6 of the file
ees9l0np.pdf, see
ees9l0n1.
PS /
TXT /
PDF /
jpg
ees9: TUB-test chart ees9; Achromatic and UYGRB thresholds, 5 Lu
thresholds delta_L (0,4s), contrast and lightness;
experimental data of Lingelbach and Richter
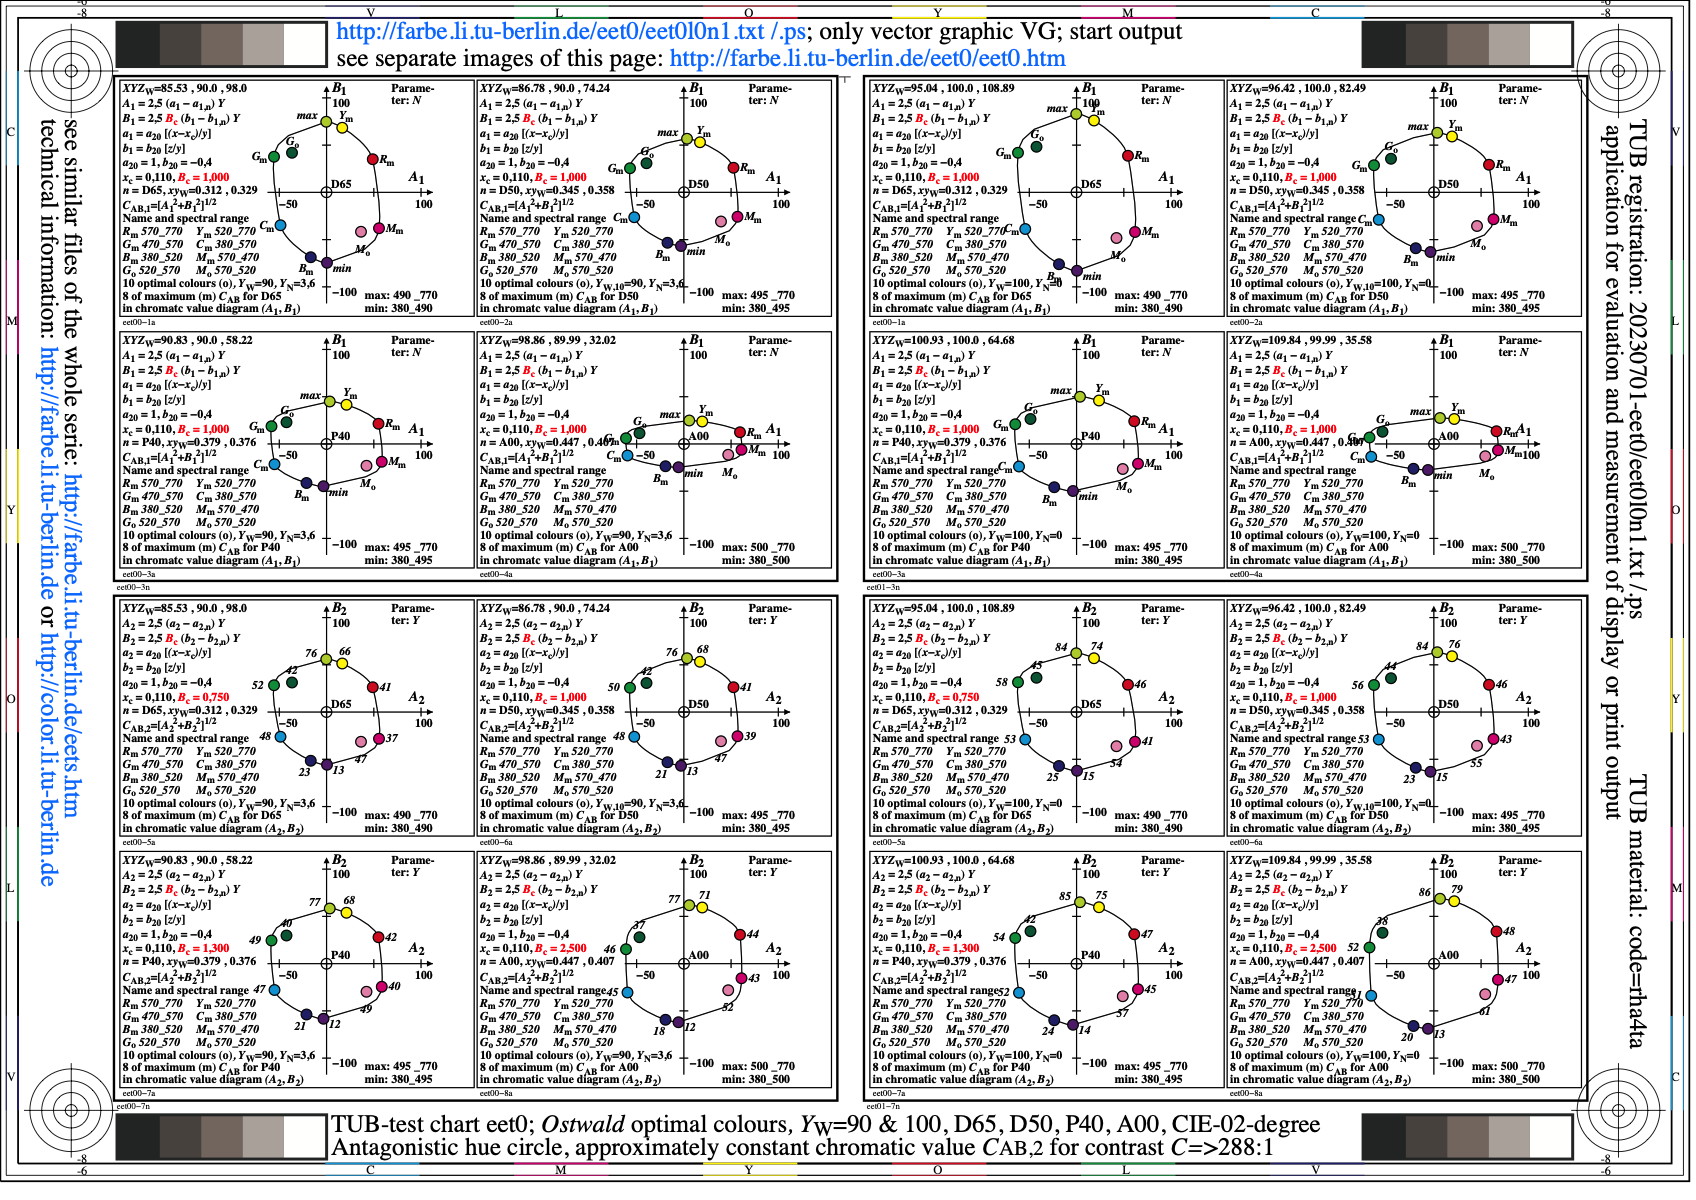
Image eet0l0n1.jpg: Output in format A6 of the file
eet0l0np.pdf, see
eet0l0n1.
PS /
TXT /
PDF /
jpg
eet0: TUB-test chart eet0; Antagonistic hue circle
Ostwald-optimal colours for D65, D50, P40, and A0
in diagrams (A1, B1) & (A2, B2), contrast C>288:

Image eet1l0n1.jpg: Output in format A6 of the file
eet1l0np.pdf, see
eet1l0n1.
PS /
TXT /
PDF /
jpg
eet1: TUB-test chart eet1; Chromatic adaptation TUBLAB2 model
Ostwald optimal colours, Yw=100, for 8 illuminants:
P65 (6500K), P60, P55, P50, P45, P40, P35, P30 (3000K)
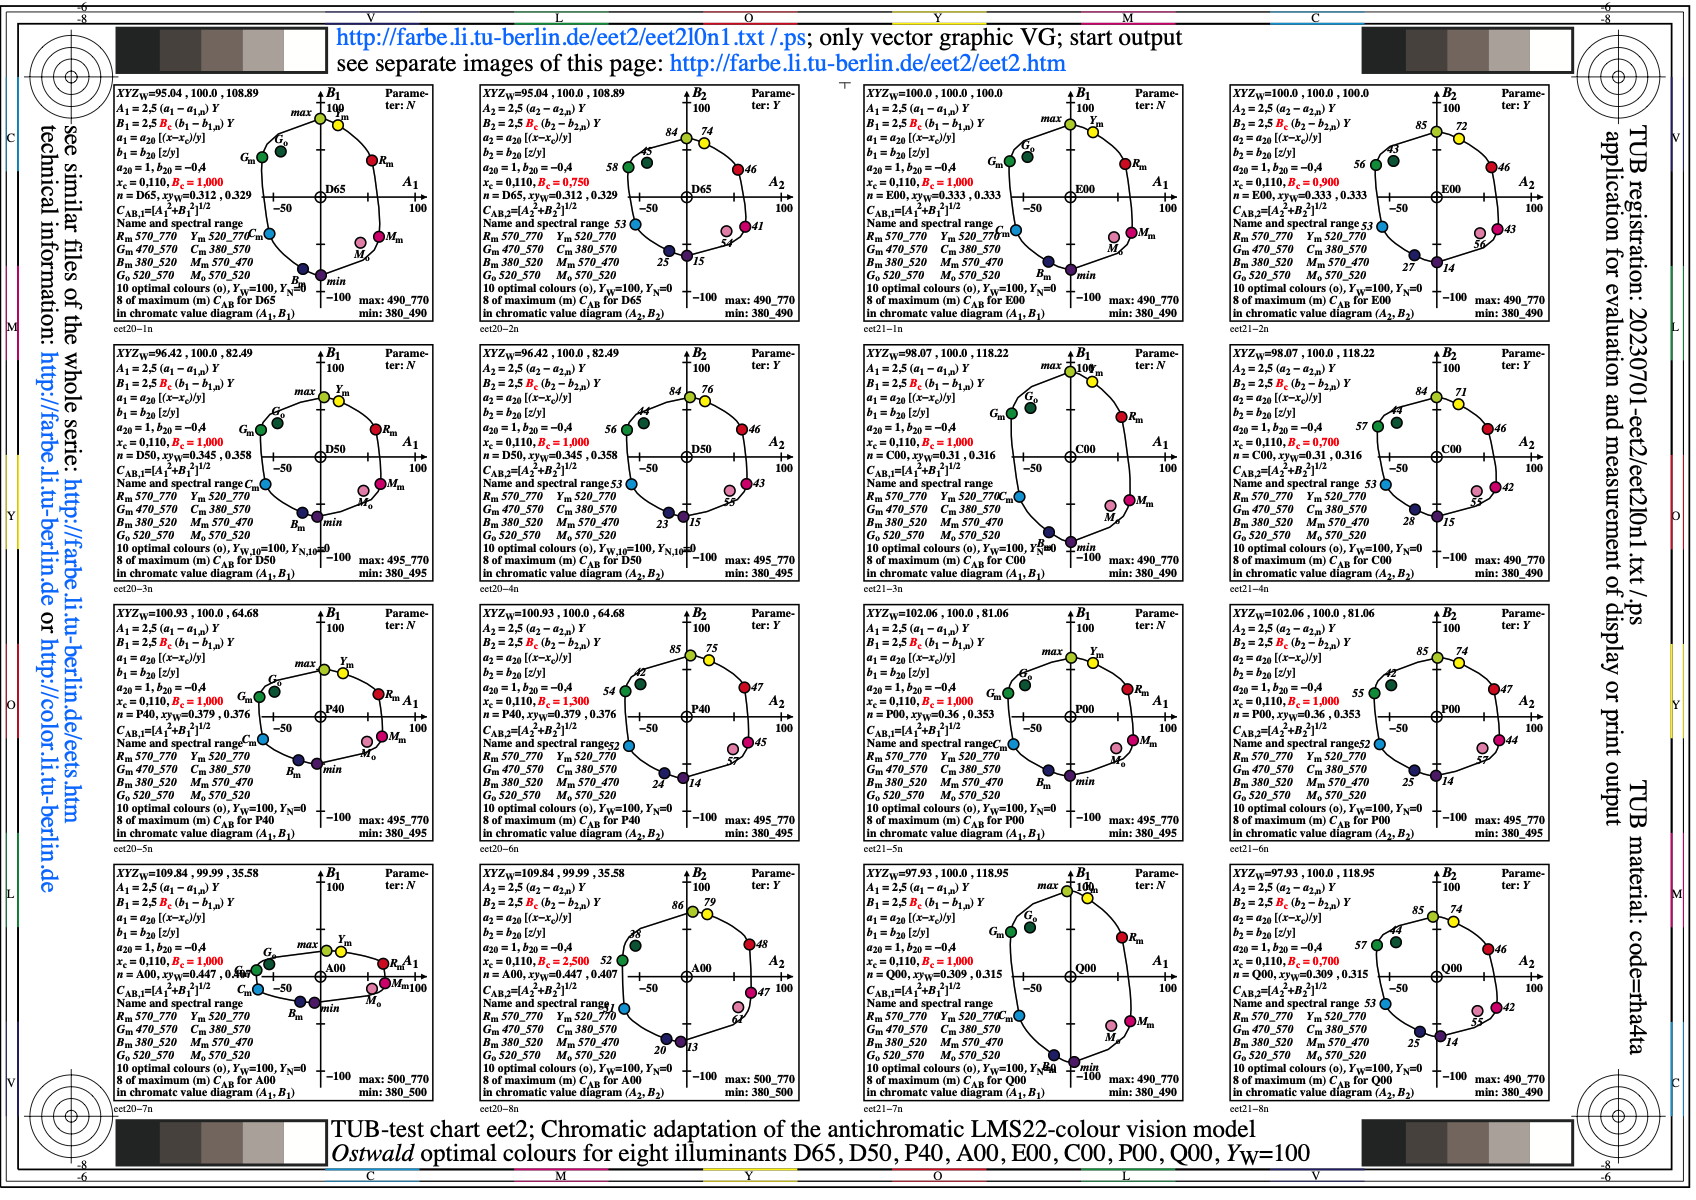
Image eet2l0n1.jpg: Output in format A6 of the file
eet2l0np.pdf, see
eet2l0n1.
PS /
TXT /
PDF /
jpg
eet2: TUB-test chart eet2; Chromatic adaptation, TUBLAB2 model
Ostwald optimal colours, Yw=100, for 8 illuminants:
D65 (6500K), D50, P40 (4000K), A00, E00, C00, P00, Q0
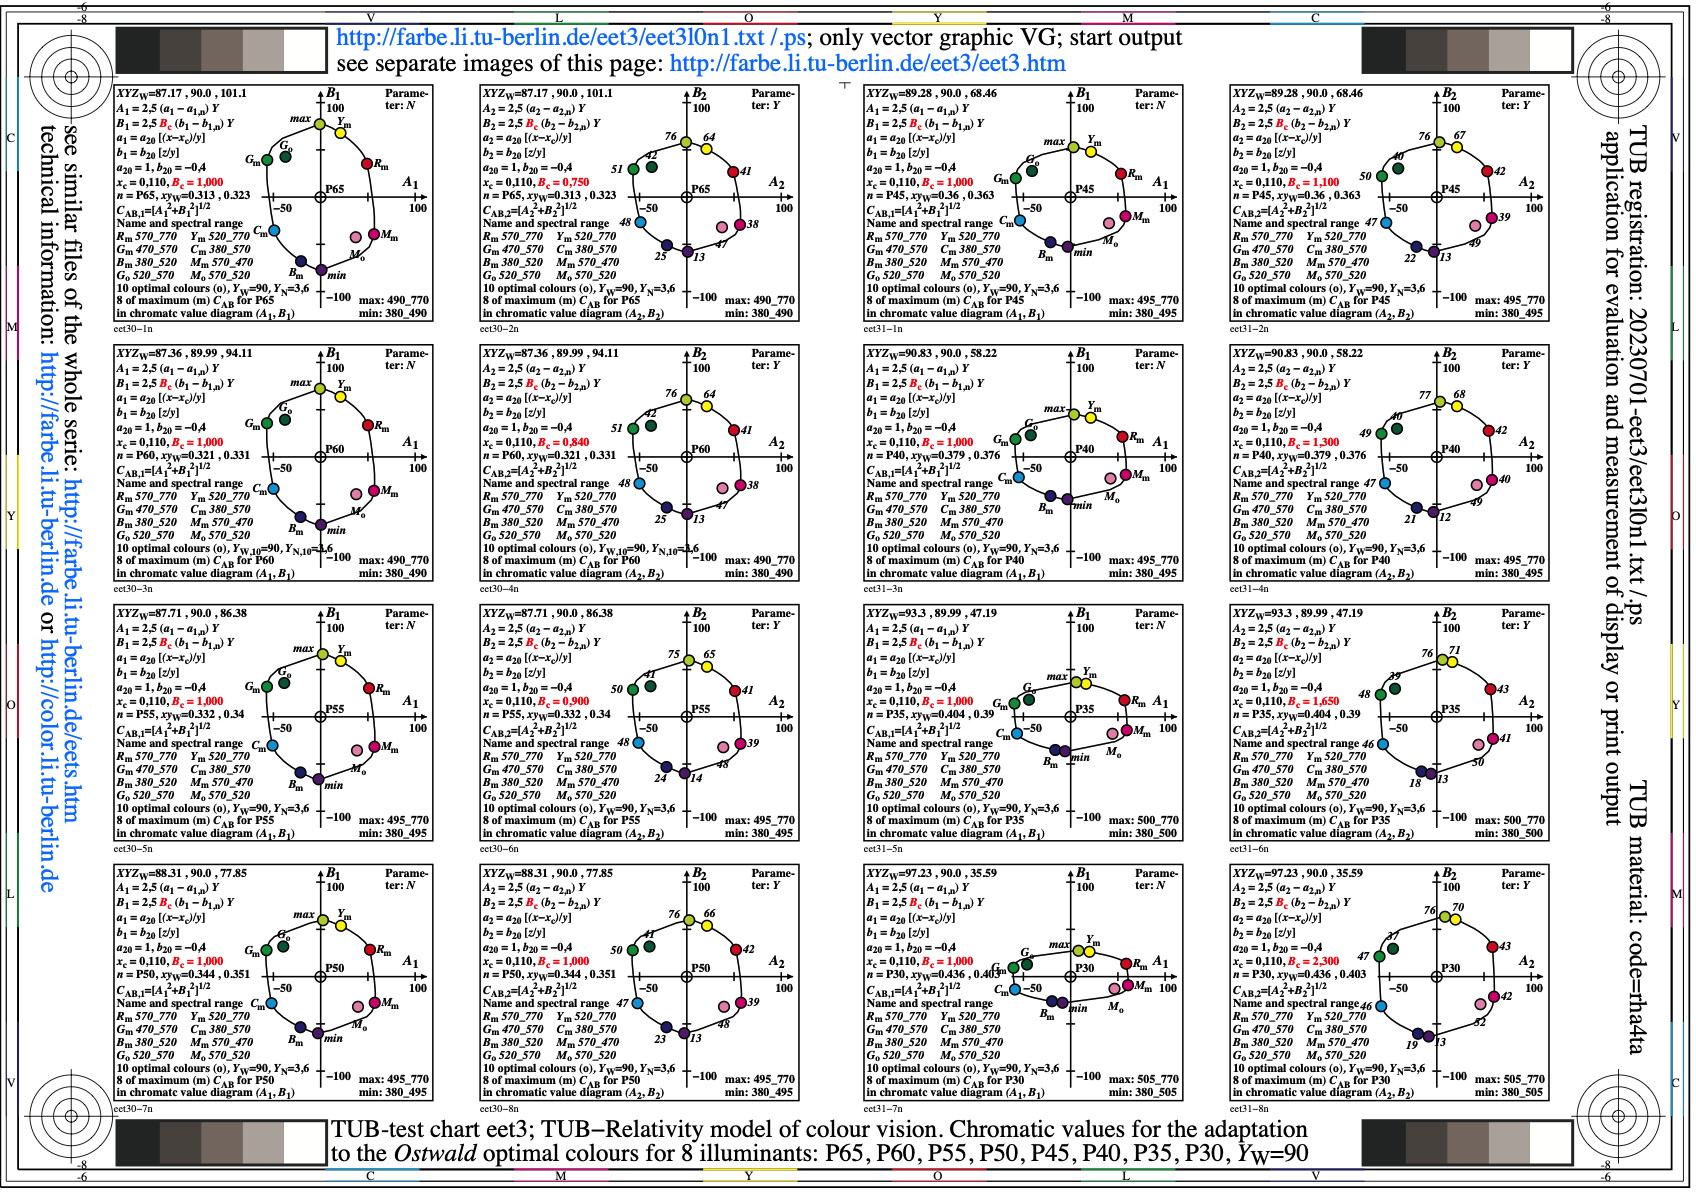
Image eet3l0n1.jpg: Output in format A6 of the file
eet3l0np.pdf, see
eet3l0n1.
PS /
TXT /
PDF /
jpg
eet3: TUB-test chart eet3; Chromatic adaptation TUBLAB2 model
Ostwald optimal colours, Yw=90, for 8 illuminants:
P65 (6500K), P60, P55, P50, P45, P40, P35, P30 (3000K)
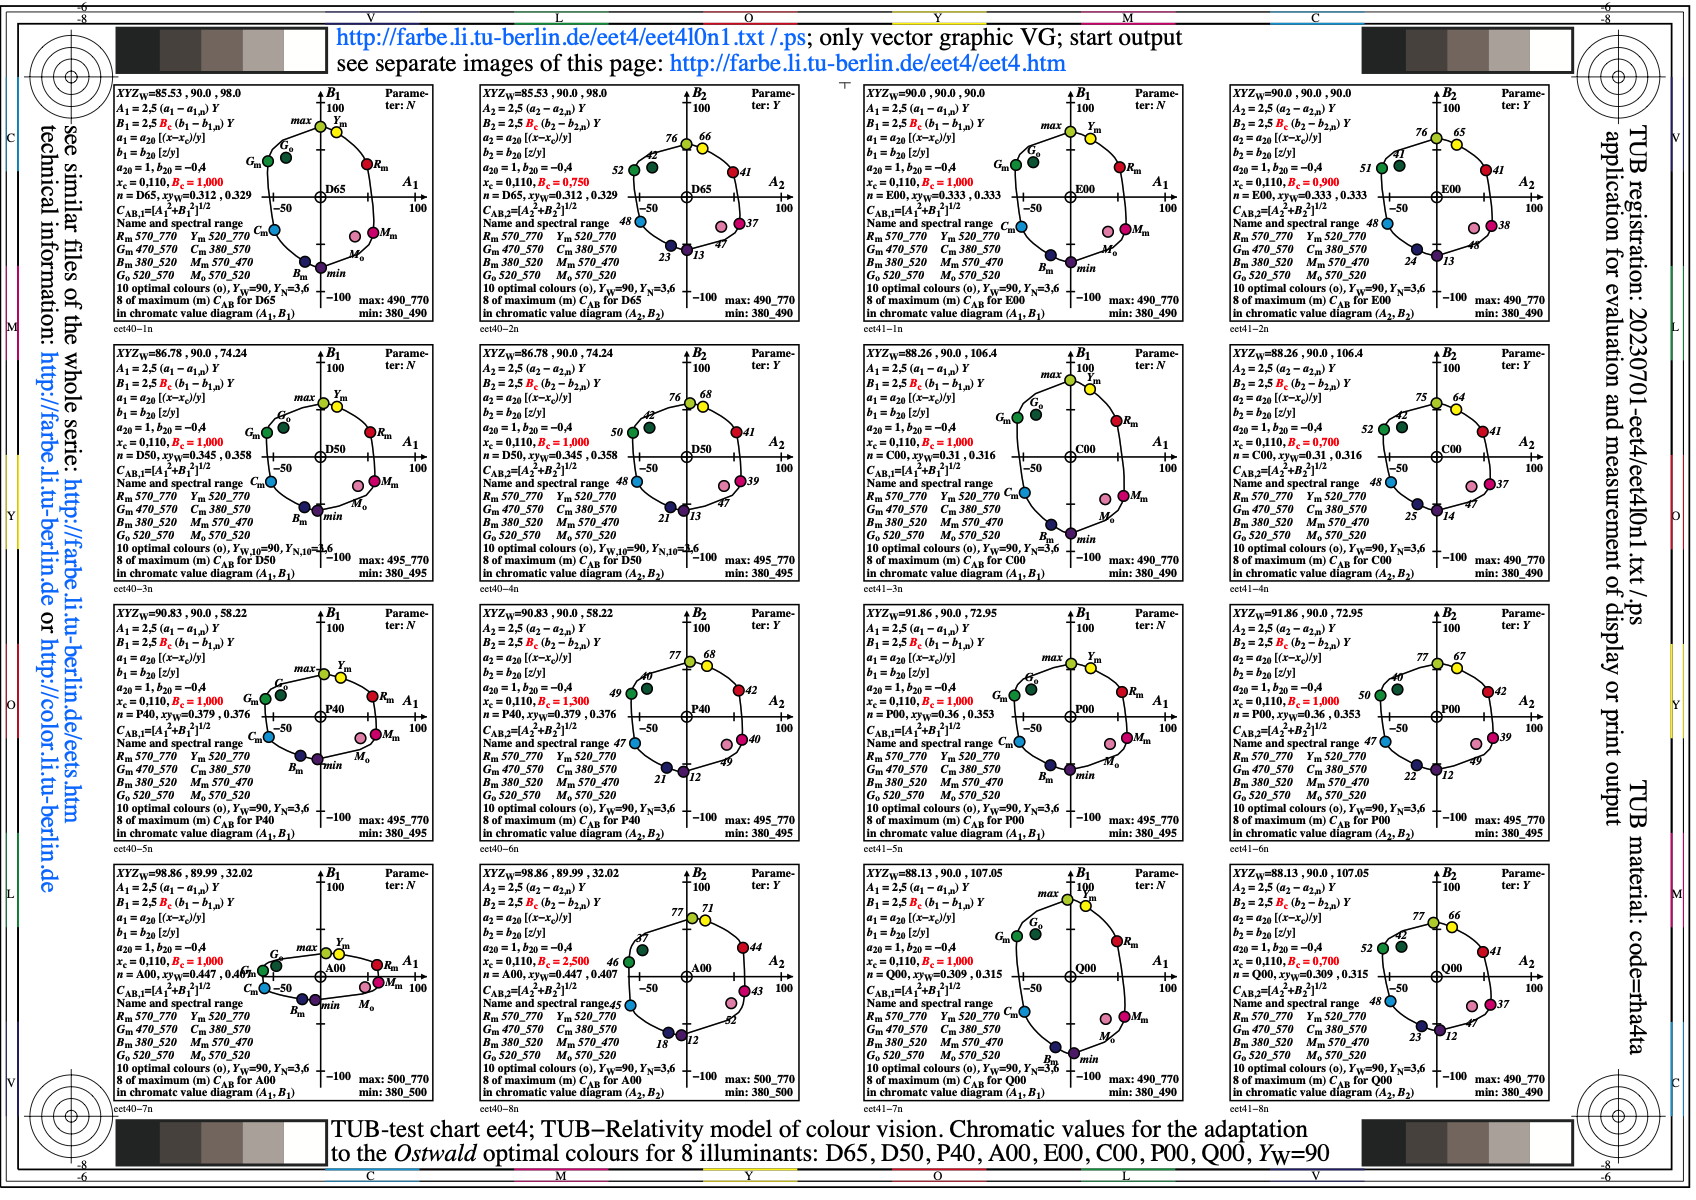
Image eet4l0n1.jpg: Output in format A6 of the file
eet4l0np.pdf, see
eet4l0n1.
PS /
TXT /
PDF /
jpg
eet4: TUB-test chart eet4; Chromatic adaptation, TUBLAB2 model
Ostwald optimal colours, Yw=90, for 8 illuminants:
D65 (6500K), D50, P40 (4000K), A00, E00, C00, P00, Q0
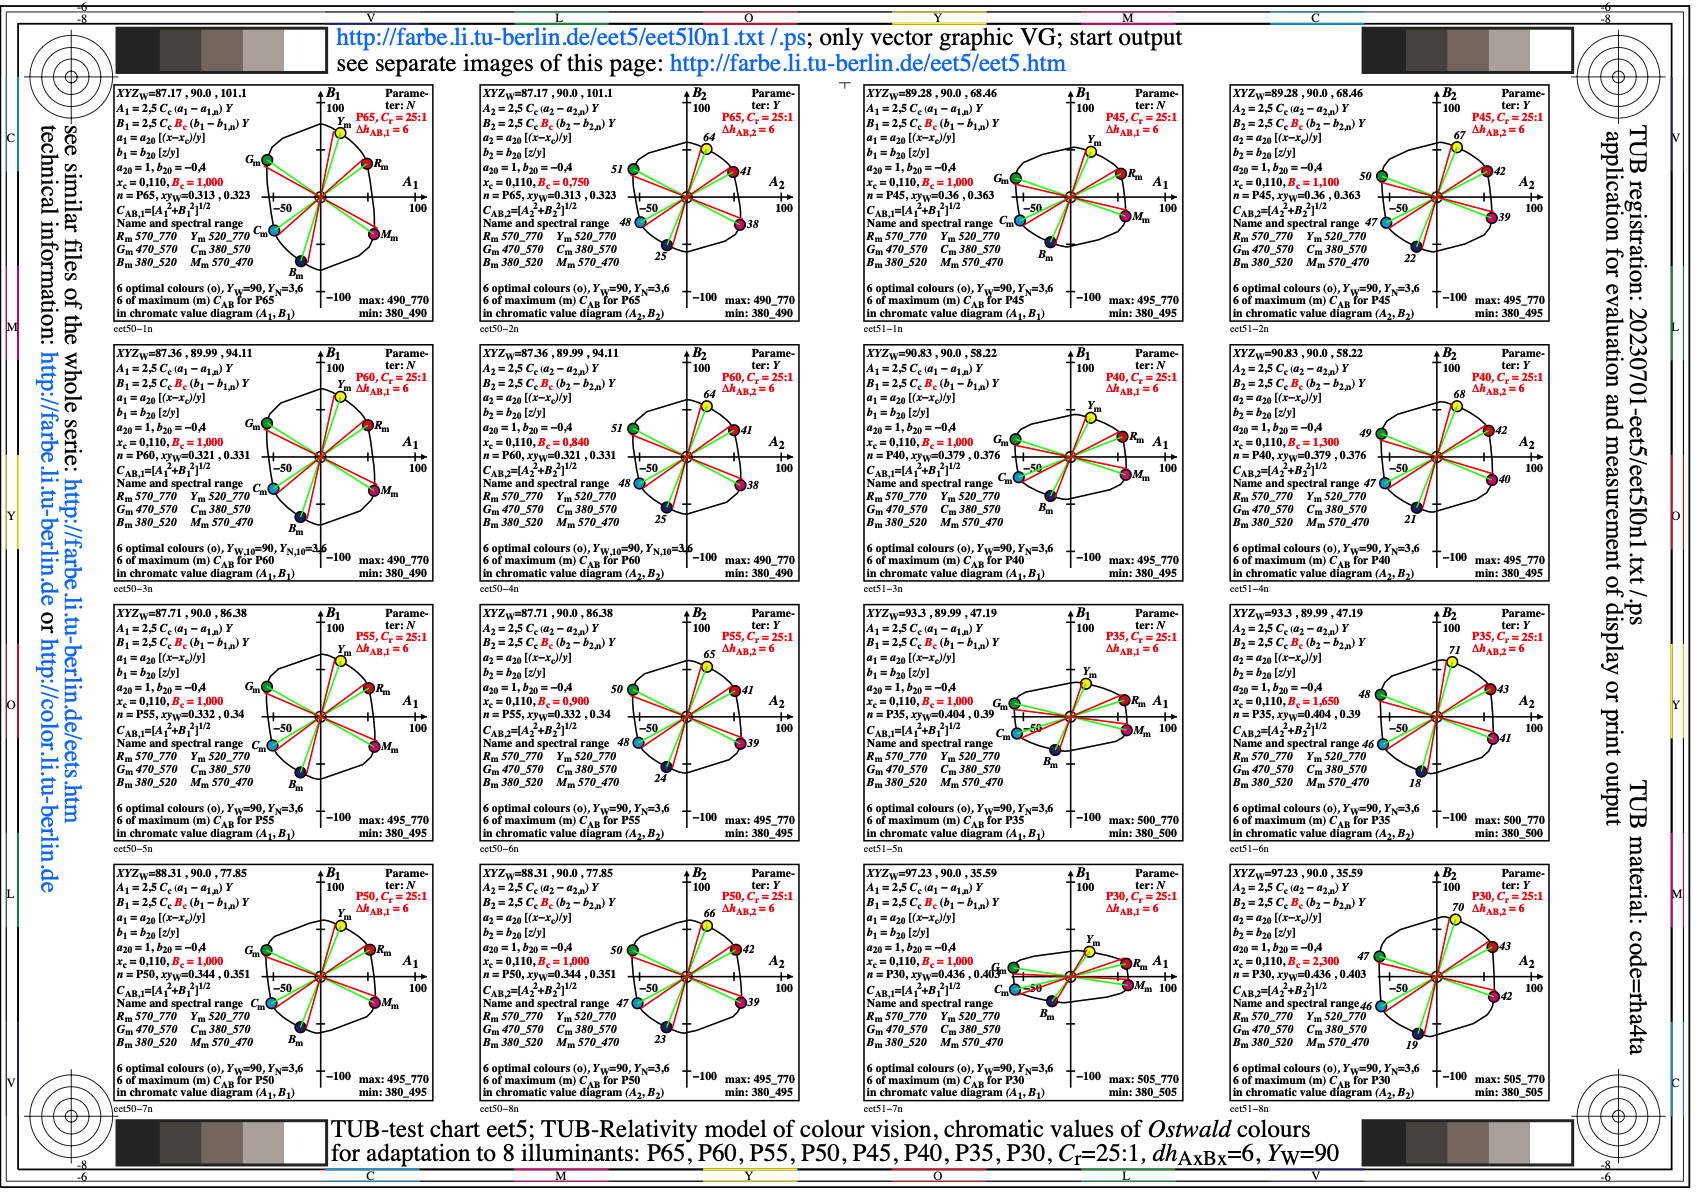
Image eet5l0n1.jpg: Output in format A6 of the file
eet5l0np.pdf, see
eet5l0n1.
PS /
TXT /
PDF /
jpg
eet5: TUB-test chart eet5; Chromatic adaptation: TUBLAB2 model
Ostwald optimal colours, Yw=90, dhA2B2=6, 8 illuminants:
P65 (6500K), P60, P55, P50, P45, P40, P35, P30, (3000K)
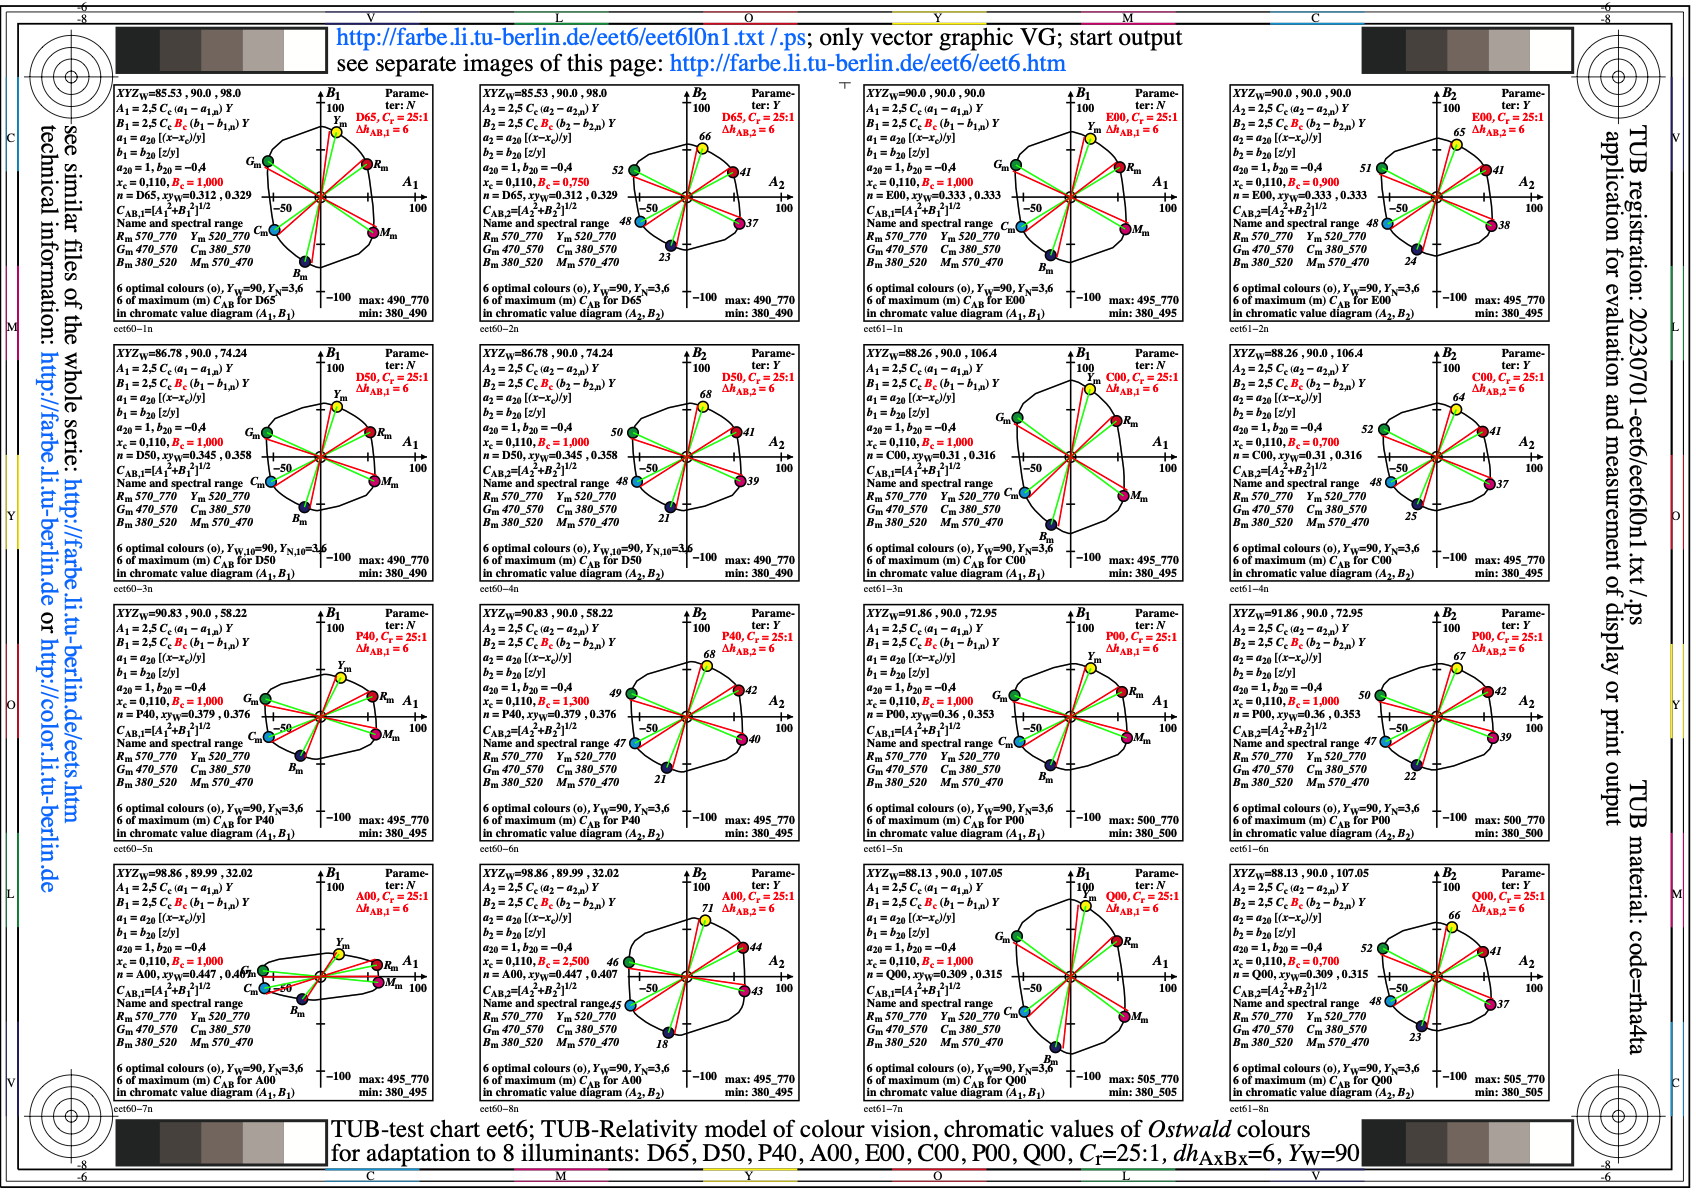
Image eet6l0n1.jpg: Output in format A6 of the file
eet6l0np.pdf, see
eet6l0n1.
PS /
TXT /
PDF /
jpg
eet6: TUB-test chart eet6; Chromatic adaptation: TUBLAB2 model
Ostwald optimal colours, Yw=90, dhA2B2=6, 8 illuminants:
D65 (6500K), D50, P40 (4000K), A00, E00, C00, P00, Q0
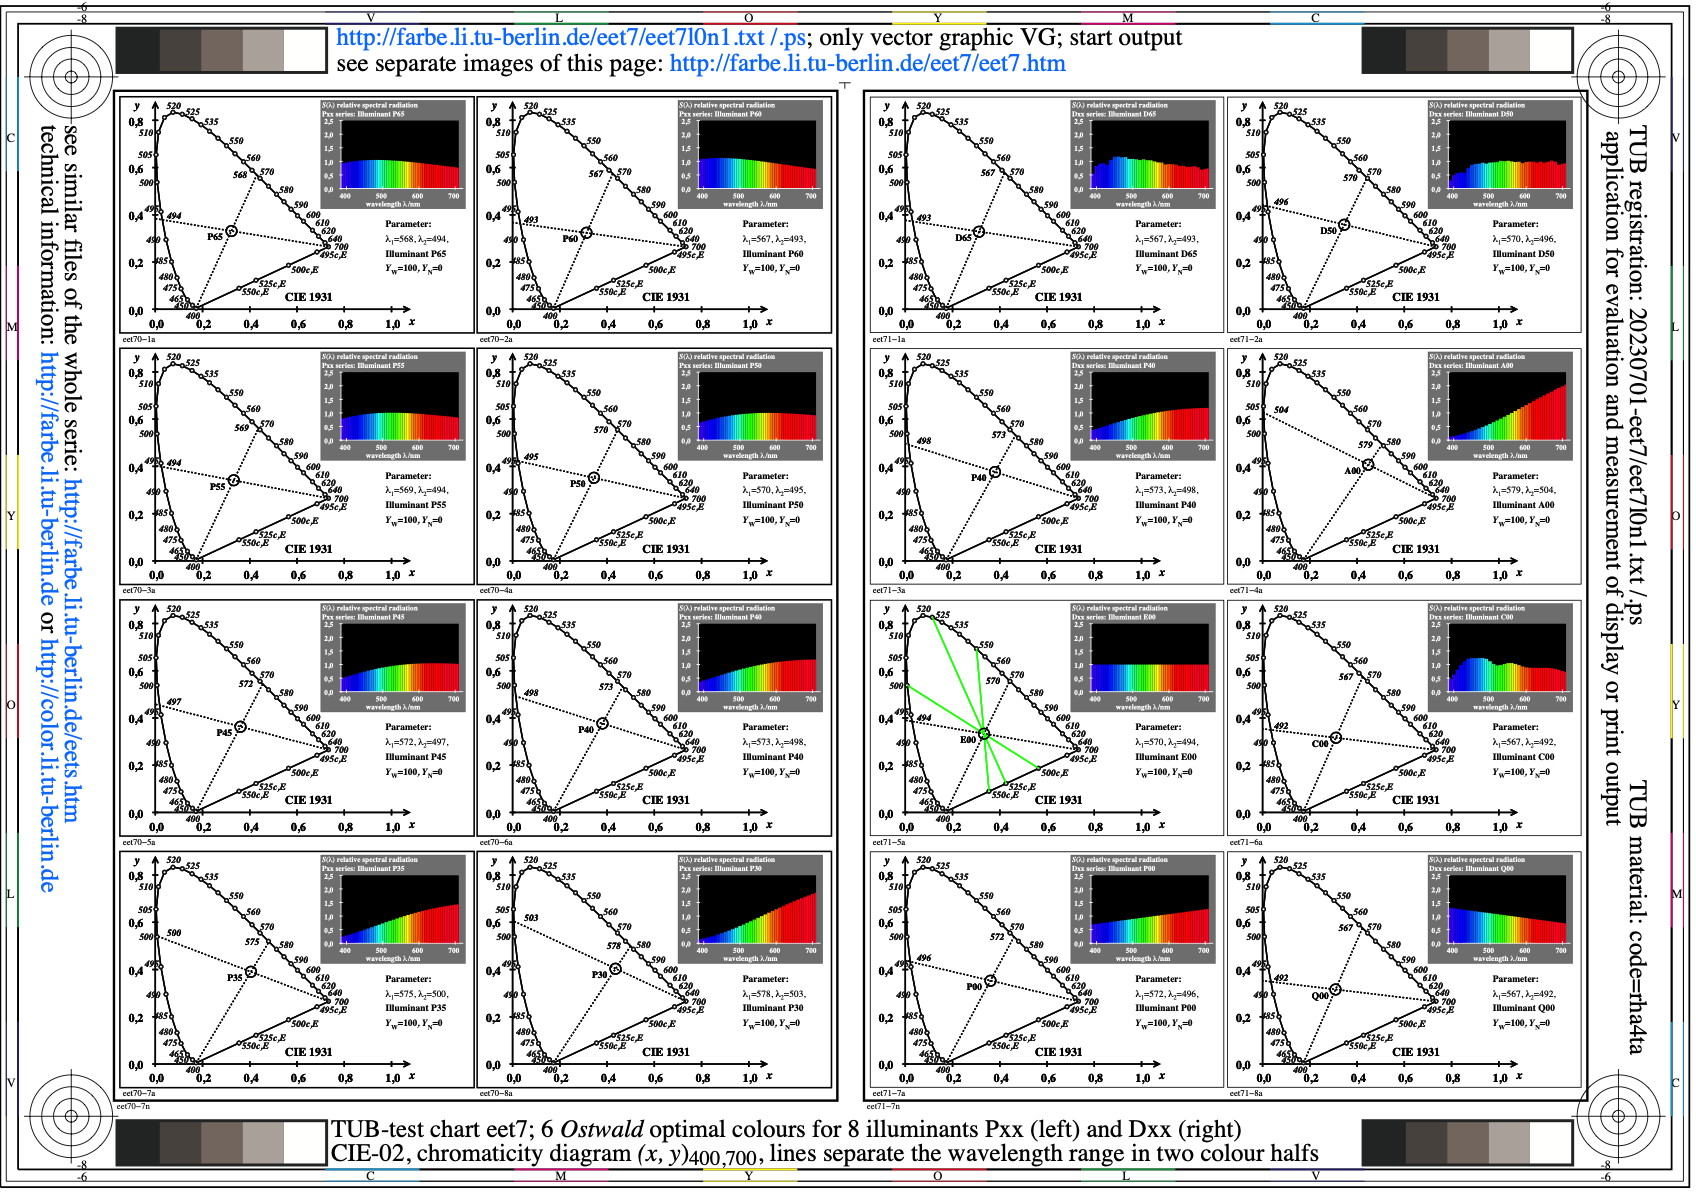
Image eet7l0n1.jpg: Output in format A6 of the file
eet7l0np.pdf, see
eet7l0n1.
PS /
TXT /
PDF /
jpg
eet7: TUB-test chart eet7; 8 spectral radiations of Pxx and Dxx
and Dxx for calculation of Ostwald optimal colours;
wavelength limits by (x,y)400,700; CIE 02-degree observer
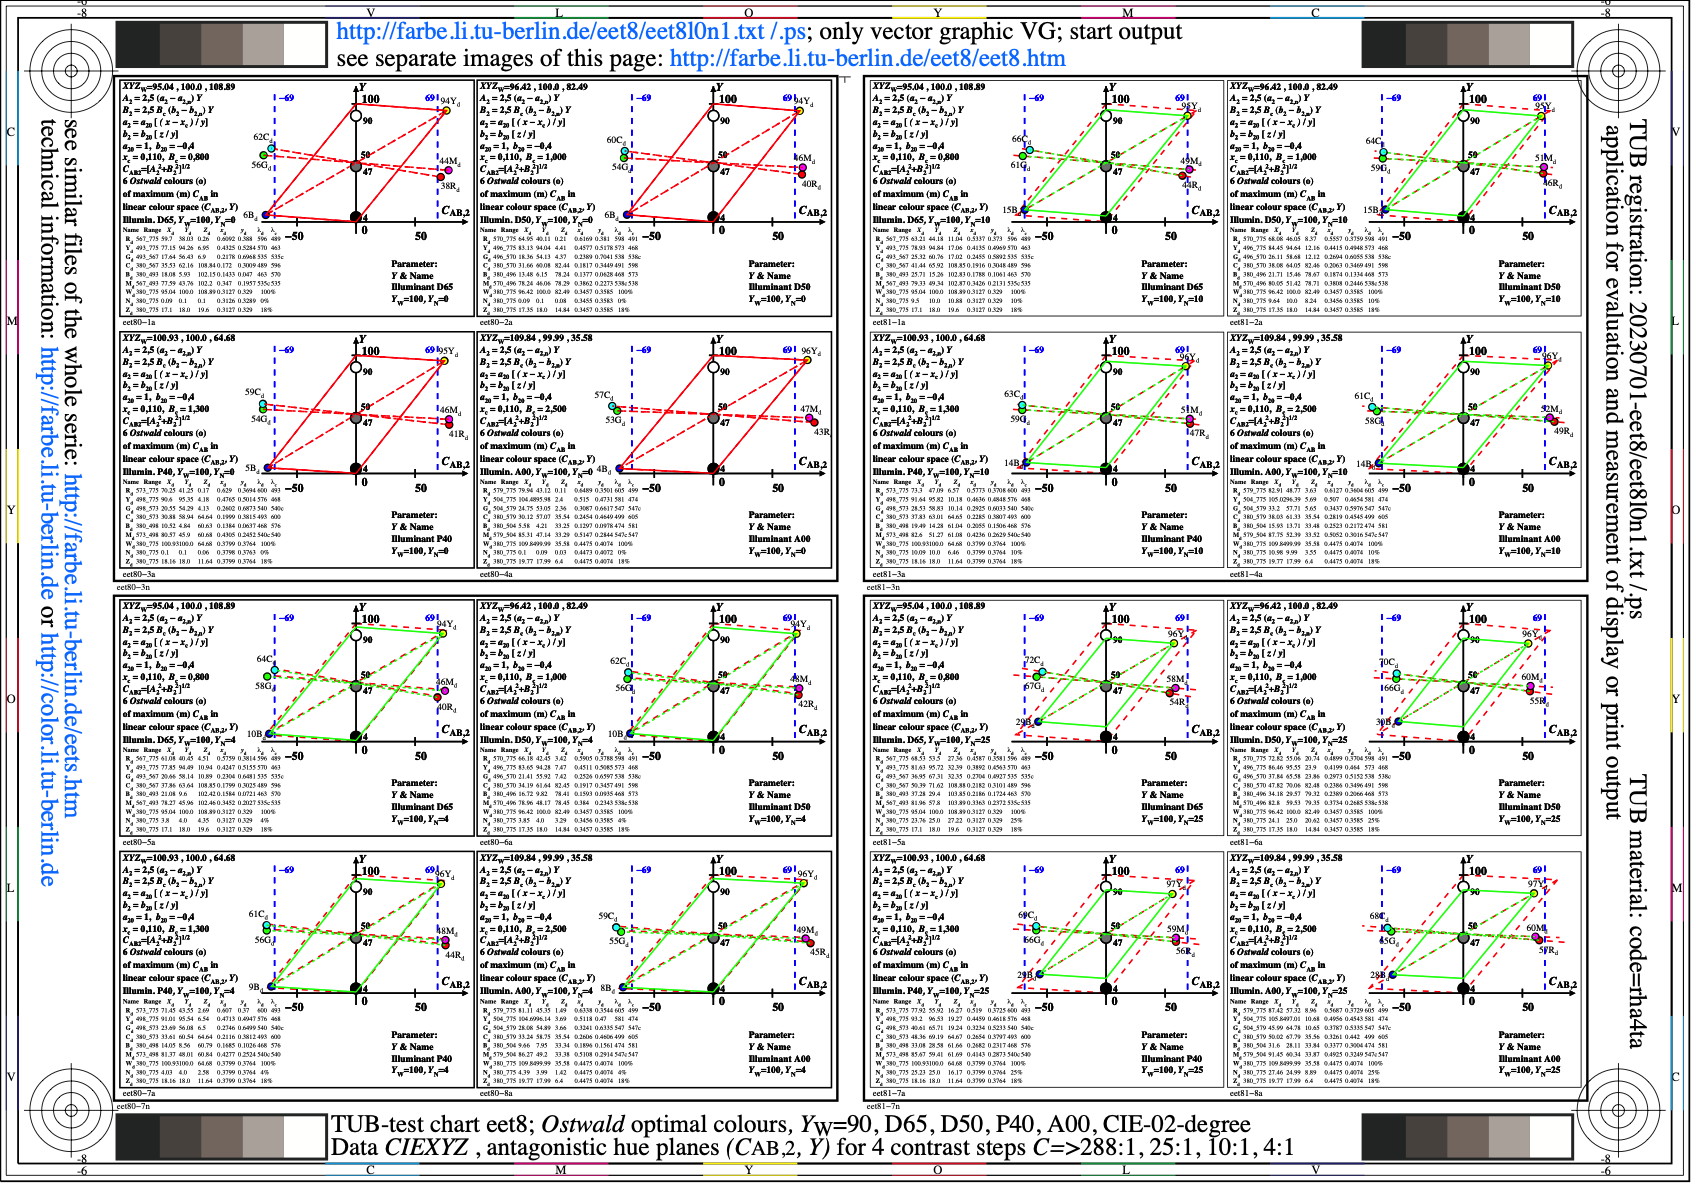
Image eet8l0n1.jpg: Output in format A6 of the file
eet8l0np.pdf, see
eet8l0n1.
PS /
TXT /
PDF /
jpg
eet8: TUB-test chart eet8; Antagonistic hue planes of
Ostwald-optimal colours for D65, D50, P40, and A0
in diagrams (CAB,2, Y) for 4 contrasts
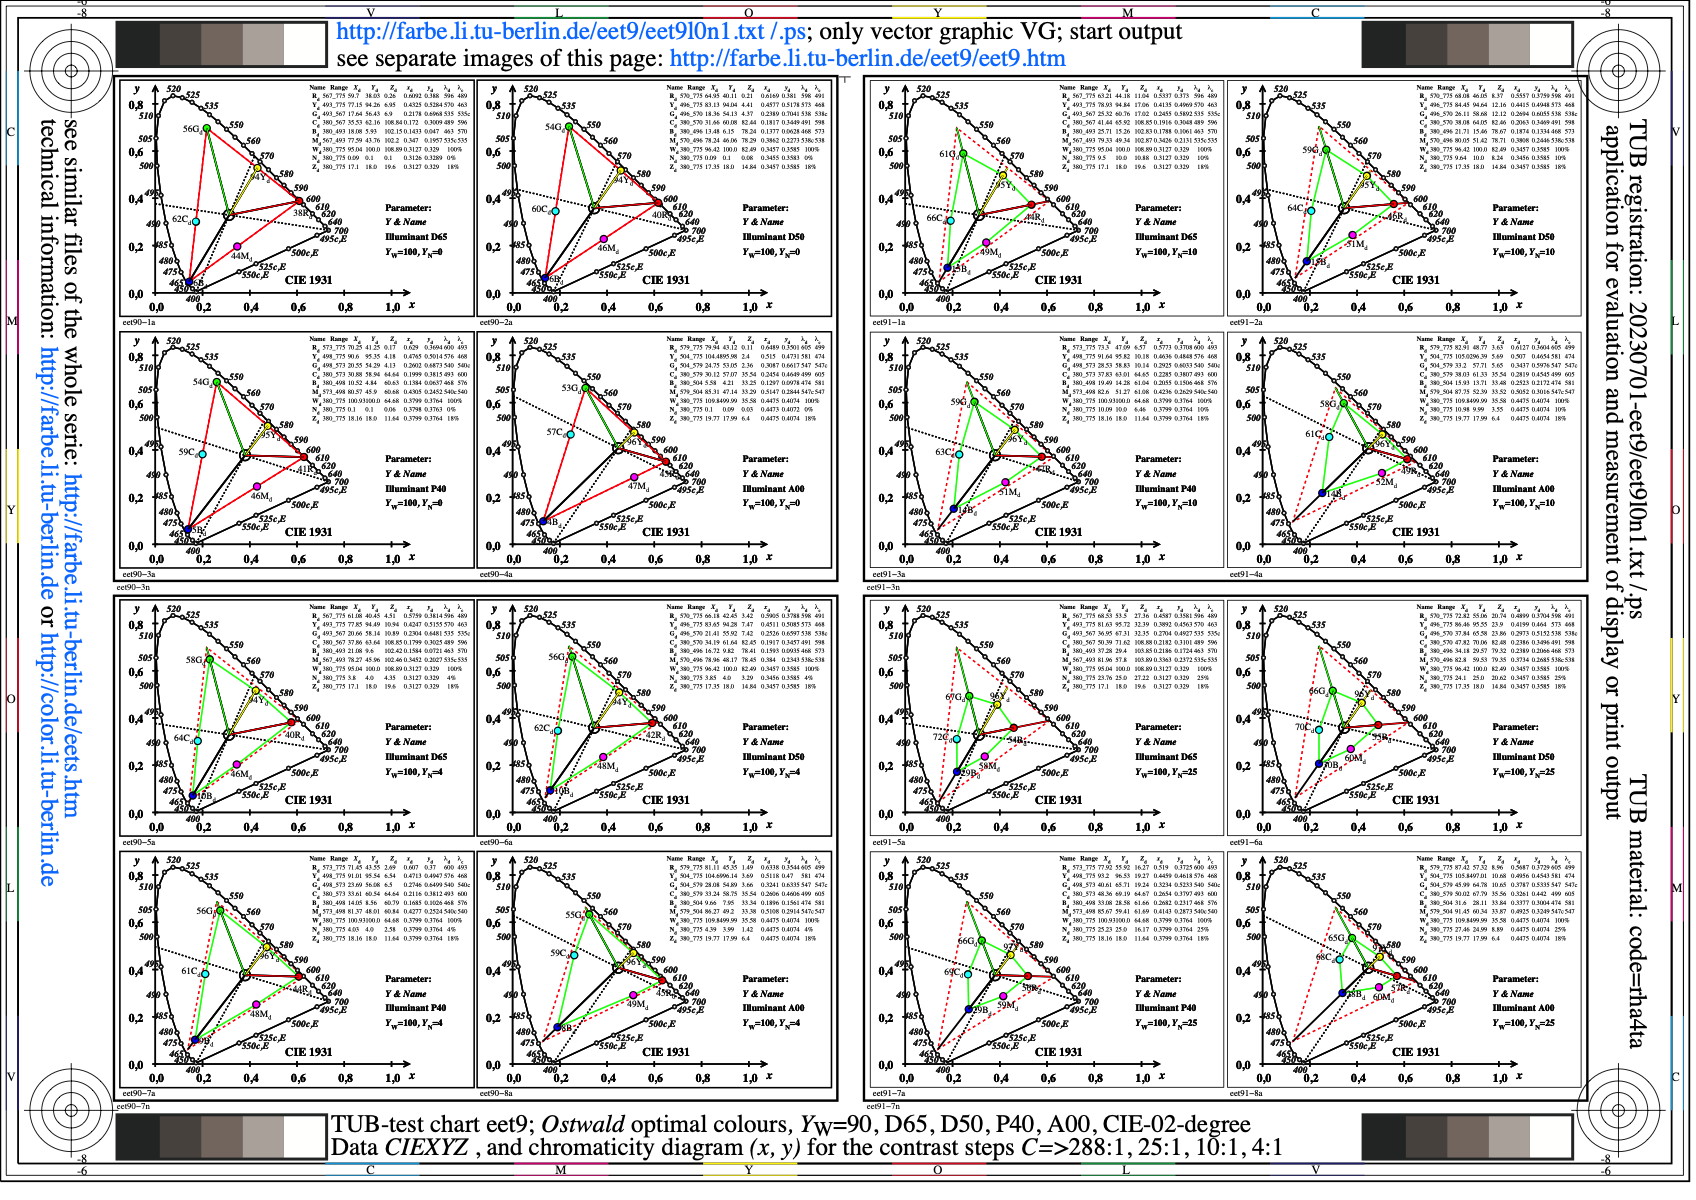
Image eet9l0n1.jpg: Output in format A6 of the file
eet9l0np.pdf, see
eet9l0n1.
PS /
TXT /
PDF /
jpg
eet9: TUB-test chart eet9; Antagonistic basic colour of
Ostwald-optimal colours for D65, D50, P40, and A0
in chromaticity diagram (x, y) for 4 contrasts
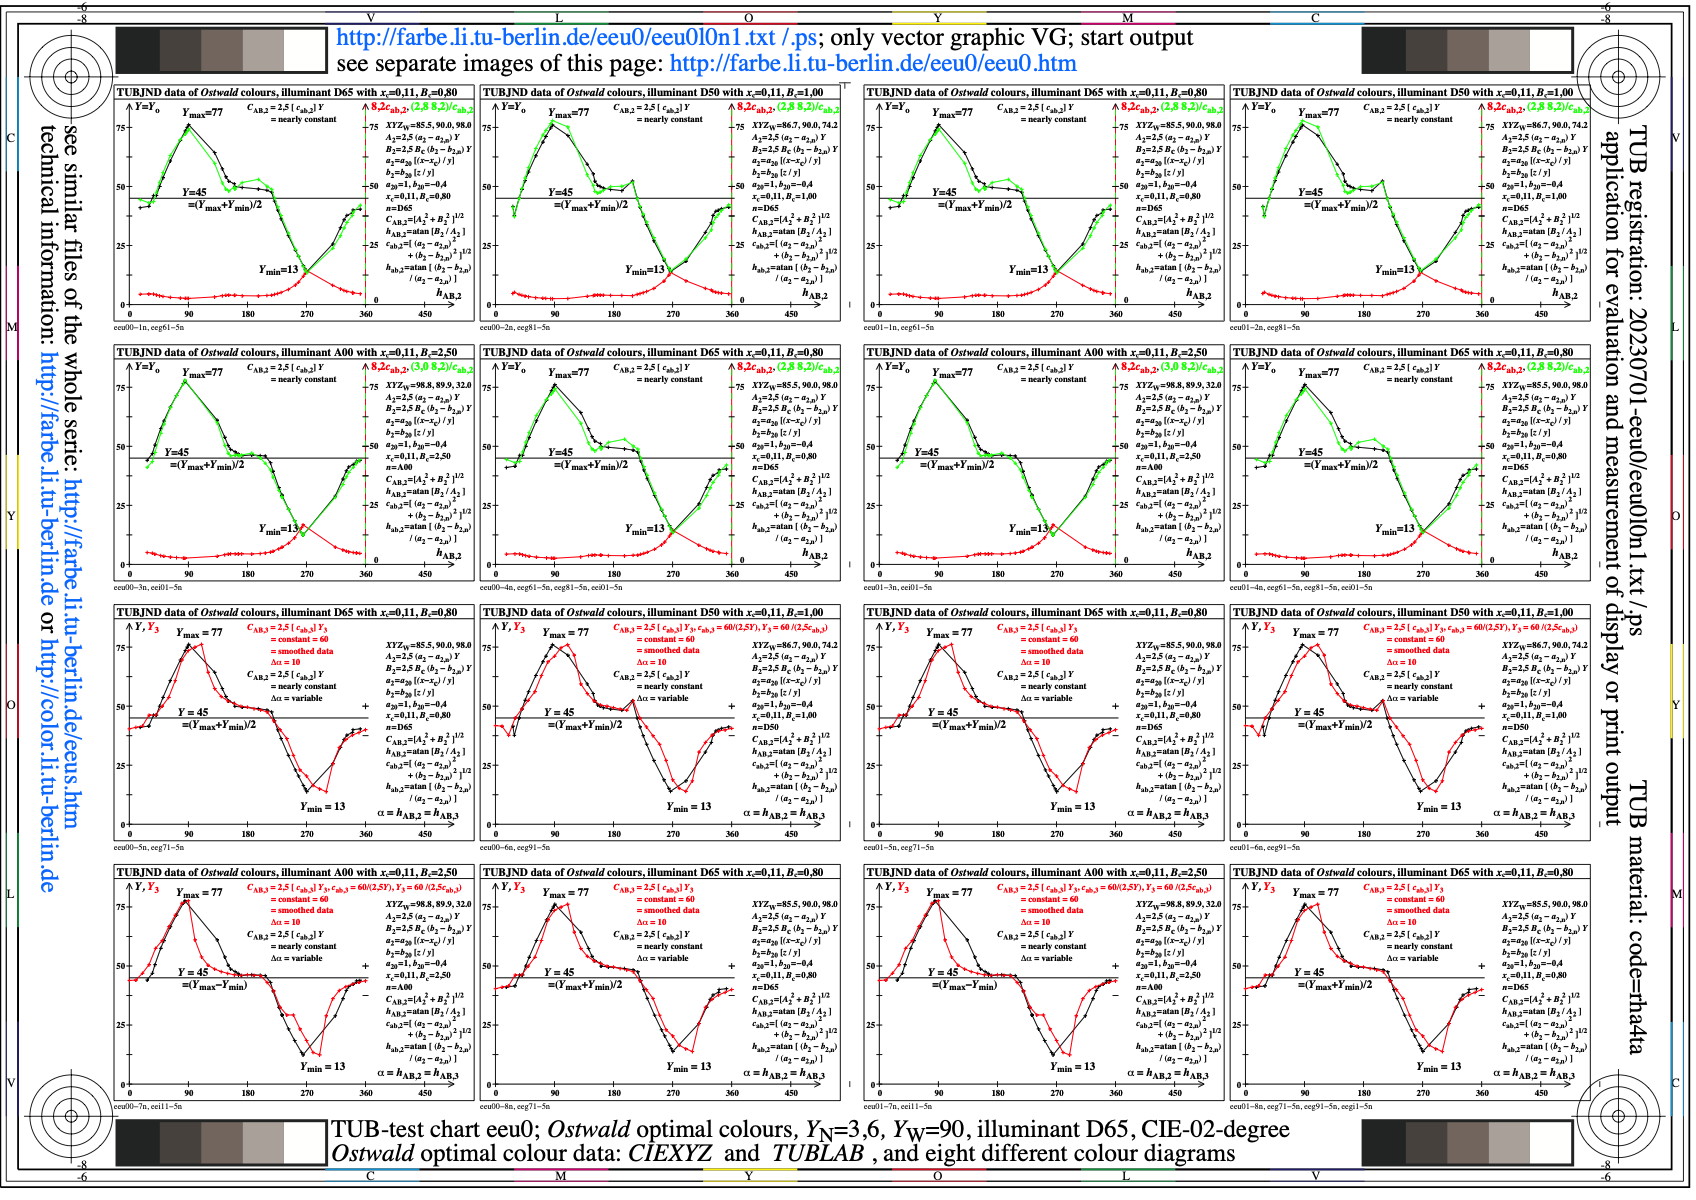
Image eeu0l0n1.jpg: Output in format A6 of the file
eeu0l0np.pdf, see
eeu0l0n1.
PS /
TXT /
PDF /
jpg
eeu0: TUB-test chart eeu0; Ostwald-optimal colours
YN=3,6, YW=90, D65, D50 und A00, CIE 02 degree
CIE_Yo and TUB_cab,2 data as function of hue
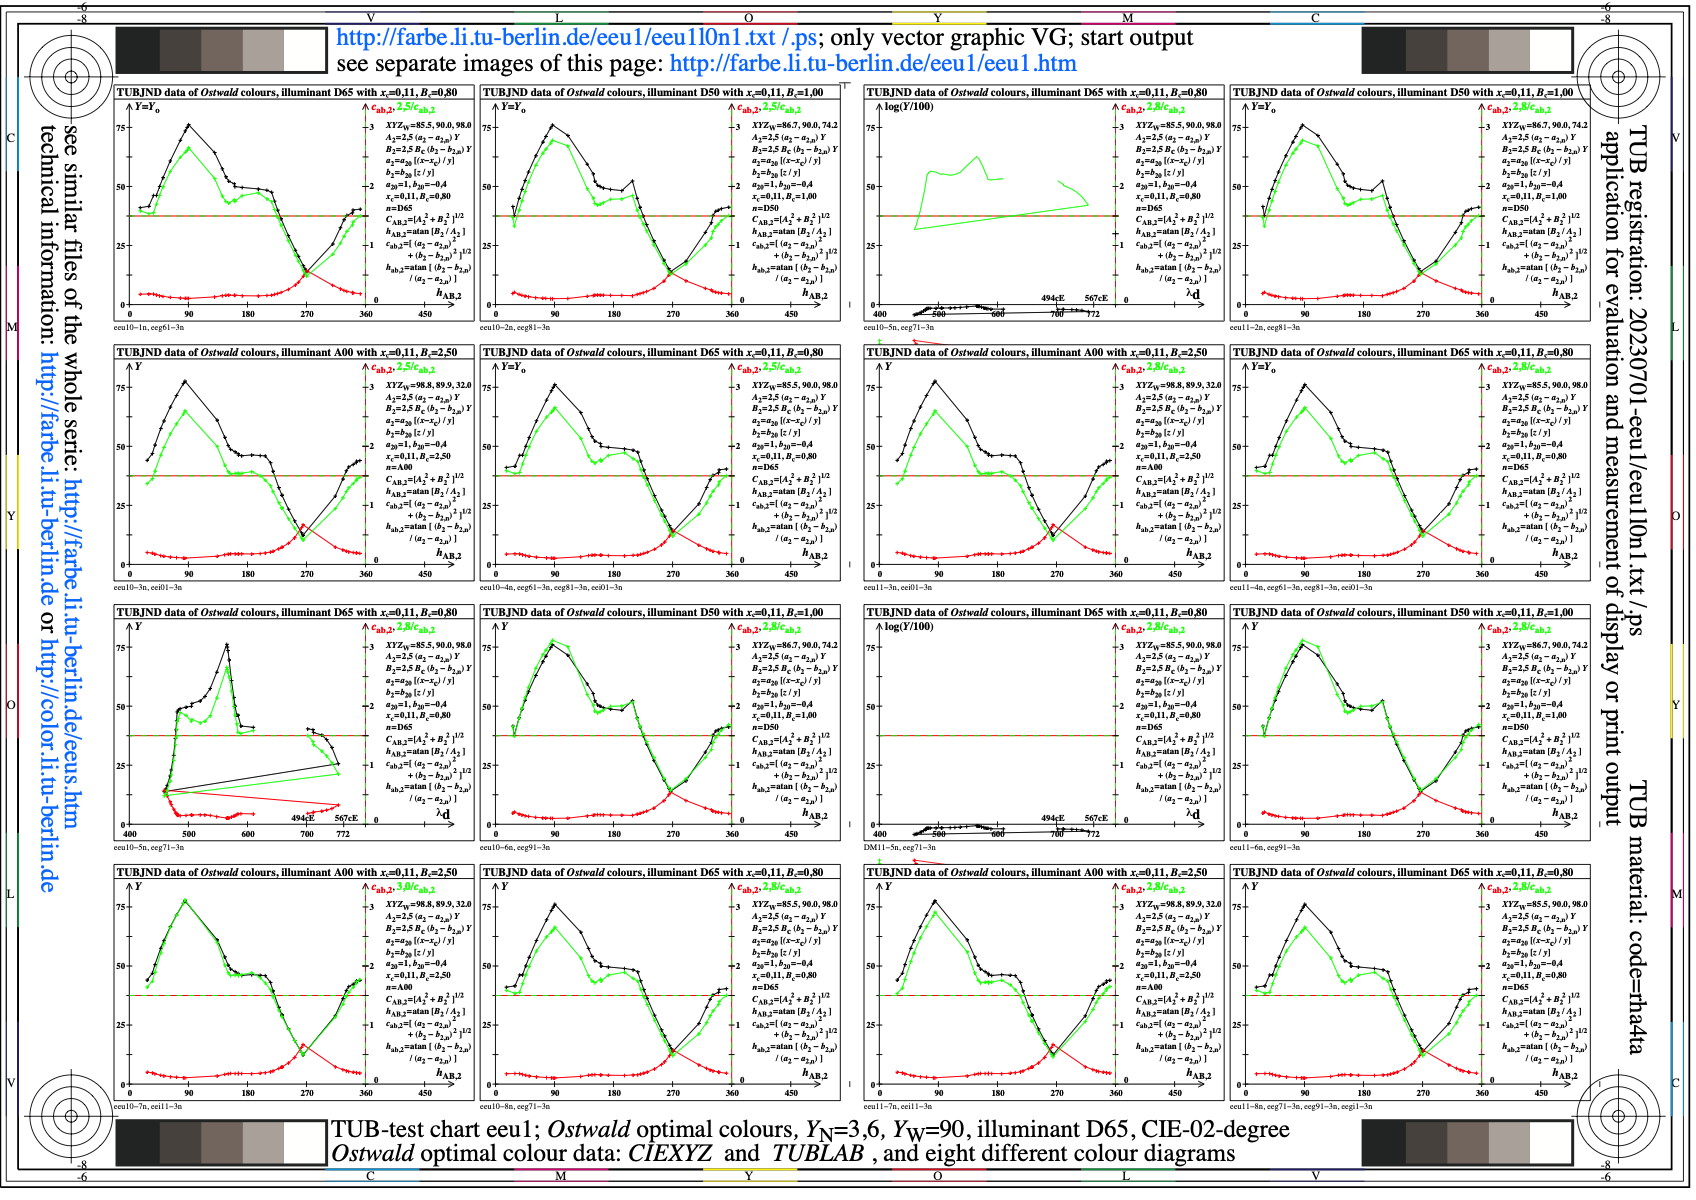
Image eeu1l0n1.jpg: Output in format A6 of the file
eeu1l0np.pdf, see
eeu1l0n1.
PS /
TXT /
PDF /
jpg
eeu1: TUB-test chart eeu1; Ostwald-optimal colours
YN=3,6, YW=90, D65, D50 und A00, CIE 02 degree
CIE_Yo and TUB_cab,2 data as function of hue
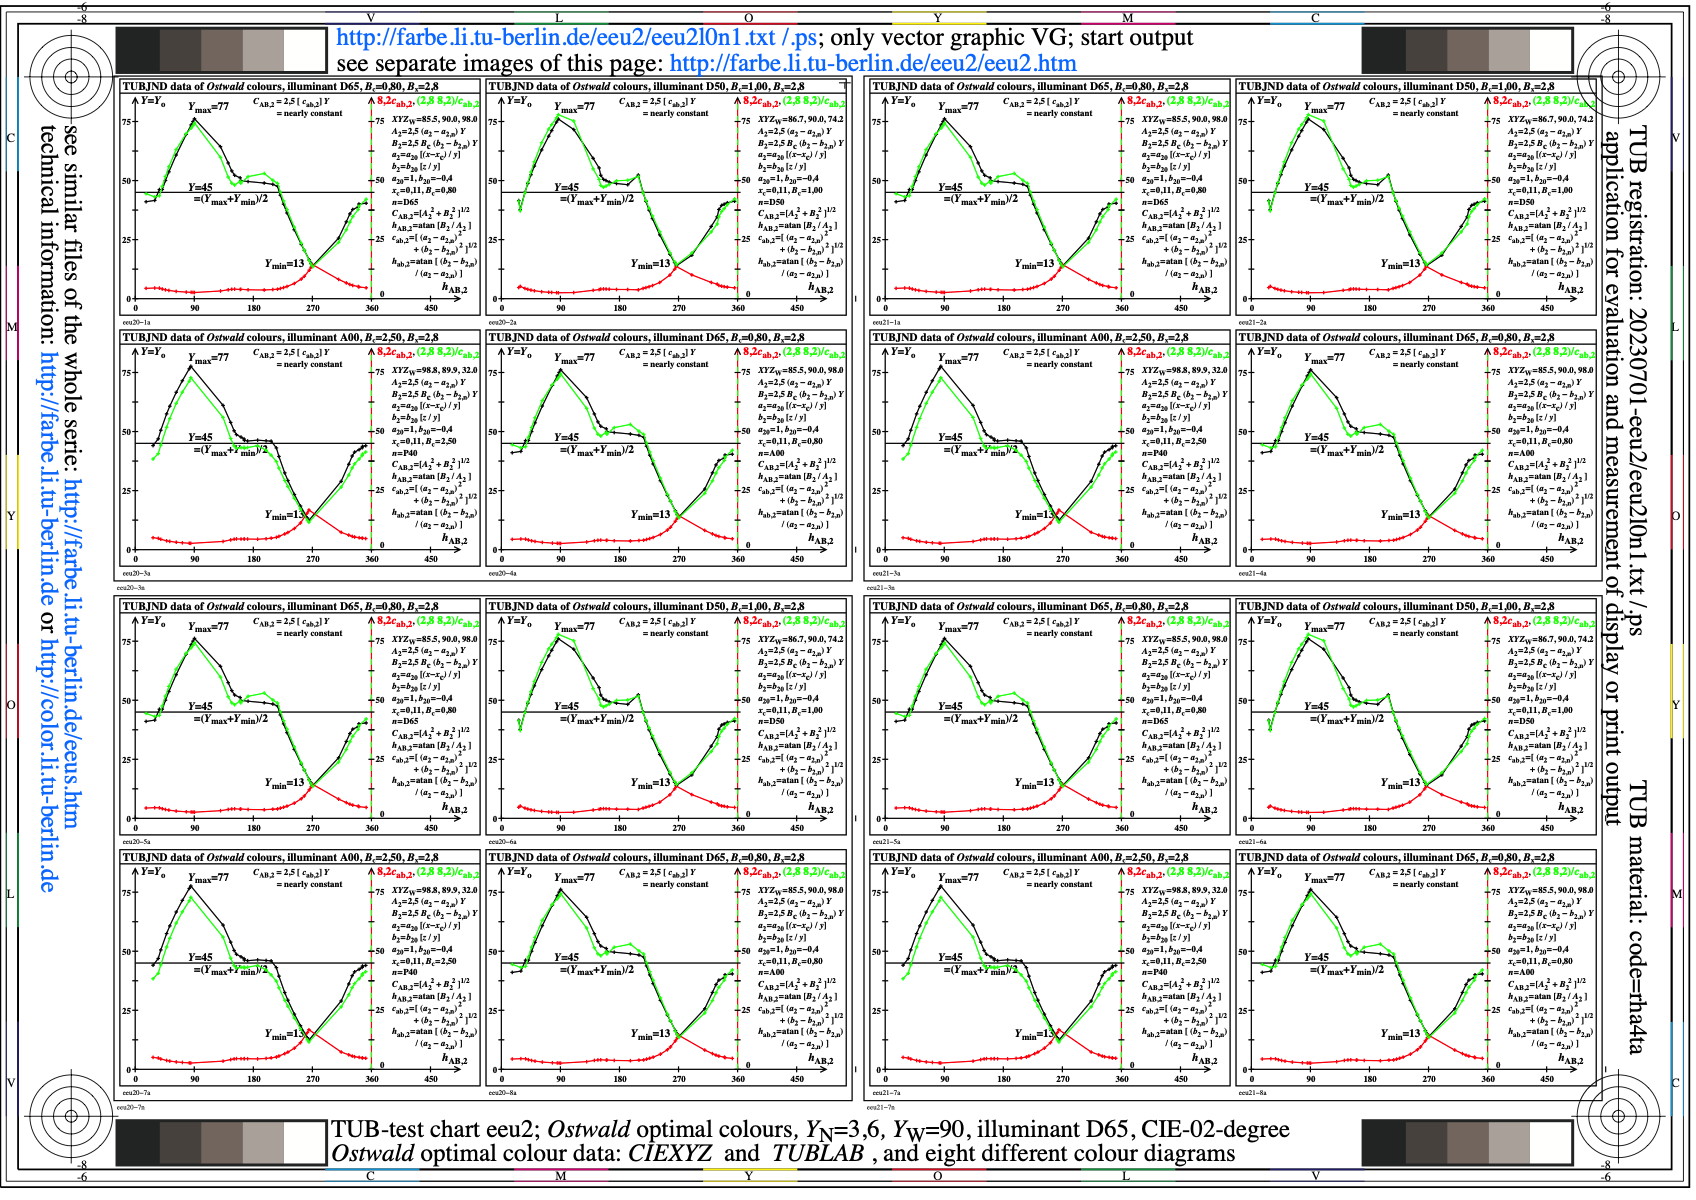
Image eeu2l0n1.jpg: Output in format A6 of the file
eeu2l0np.pdf, see
eeu2l0n1.
PS /
TXT /
PDF /
jpg
eeu2: TUB-test chart eeu2; Ostwald-optimal colours
YN=3,6, YW=90, D65, D50 und A00, CIE 02 degree
CIE_Yo and TUB_cab,2 data as function of hue

Image eeu3l0n1.jpg: Output in format A6 of the file
eeu3l0np.pdf, see
eeu3l0n1.
PS /
TXT /
PDF /
jpg
eeu3: TUB-test chart eeu3; Ostwald-optimal colours
YN=3,6, YW=90, CIE illuminant D50, CIE 02 degree
Data CIE_XYZxy, TUB_YABCh2, dominant wavelength
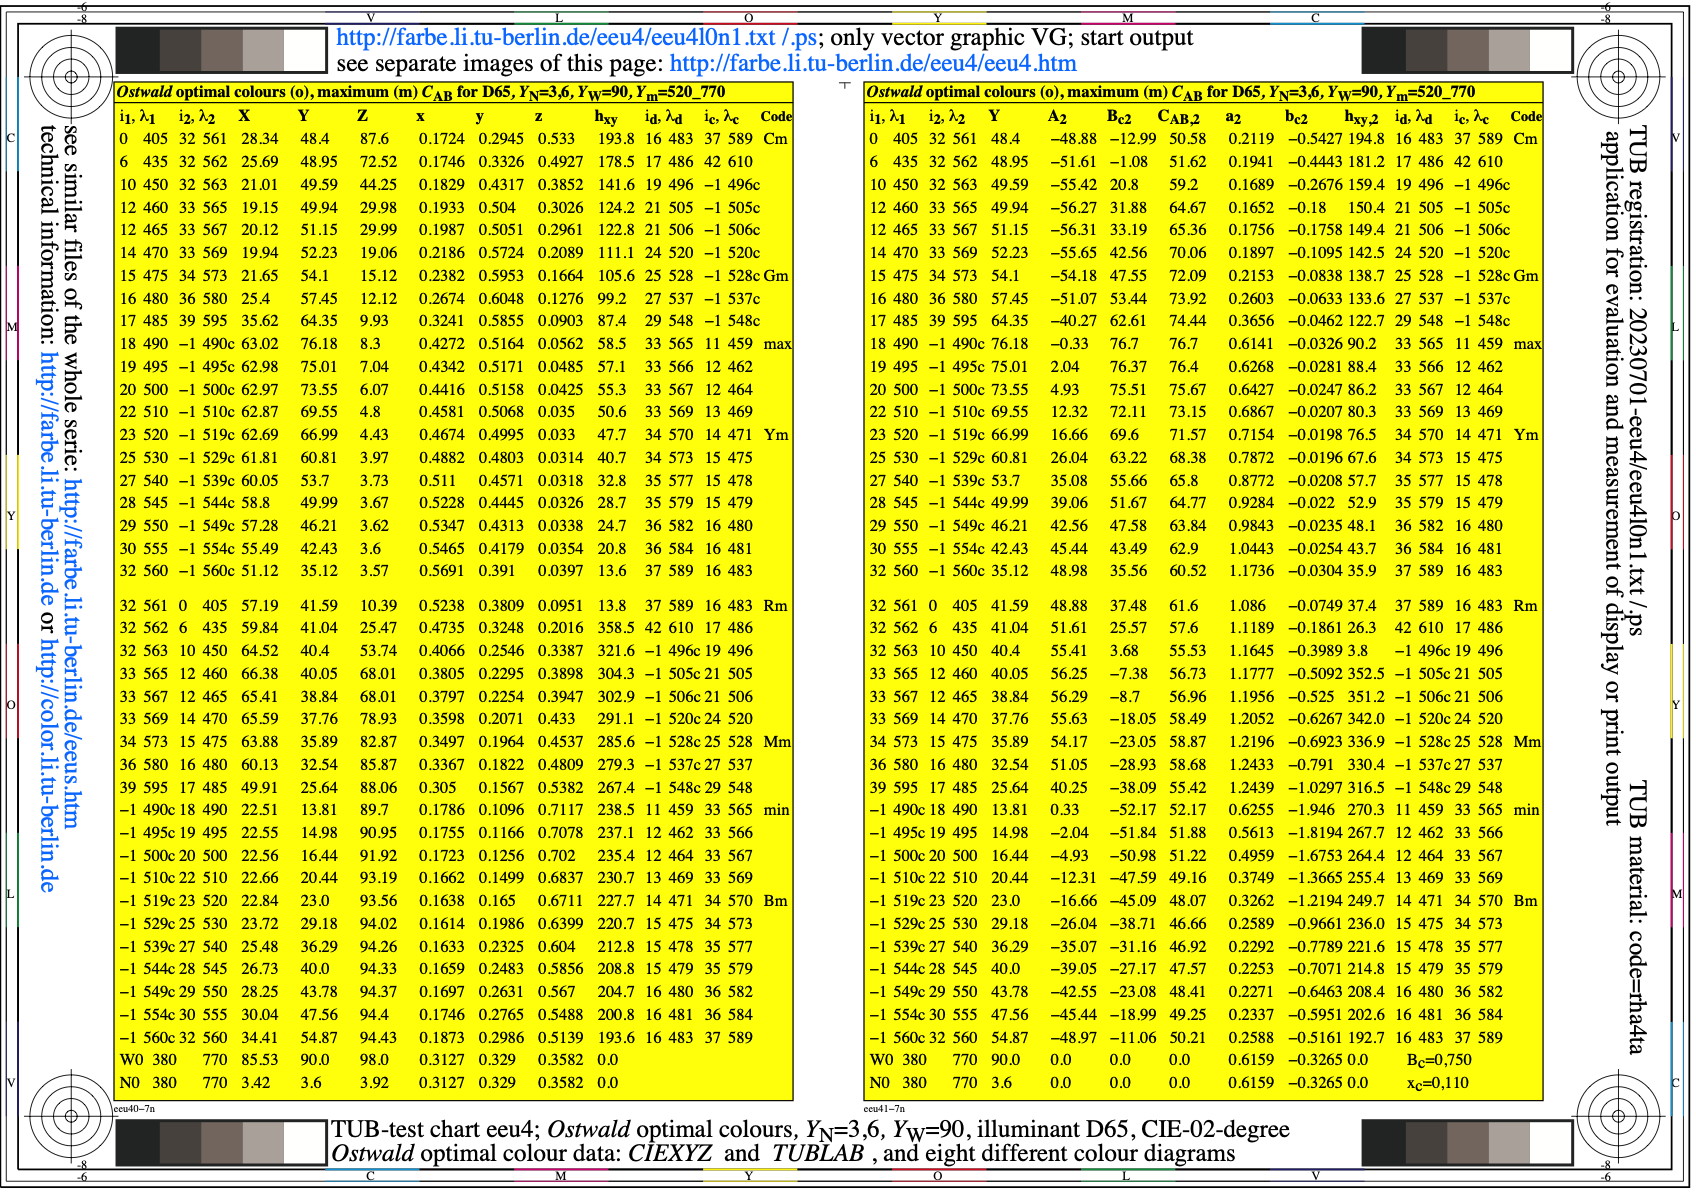
Image eeu4l0n1.jpg: Output in format A6 of the file
eeu4l0np.pdf, see
eeu4l0n1.
PS /
TXT /
PDF /
jpg
eeu4: TUB-test chart eeu4; Ostwald-optimal colours
YN=3,6, YW=90, CIE illuminant D65, CIE 02 degree
Data CIE_XYZxy, TUB_YABCh2 with wavelength limits
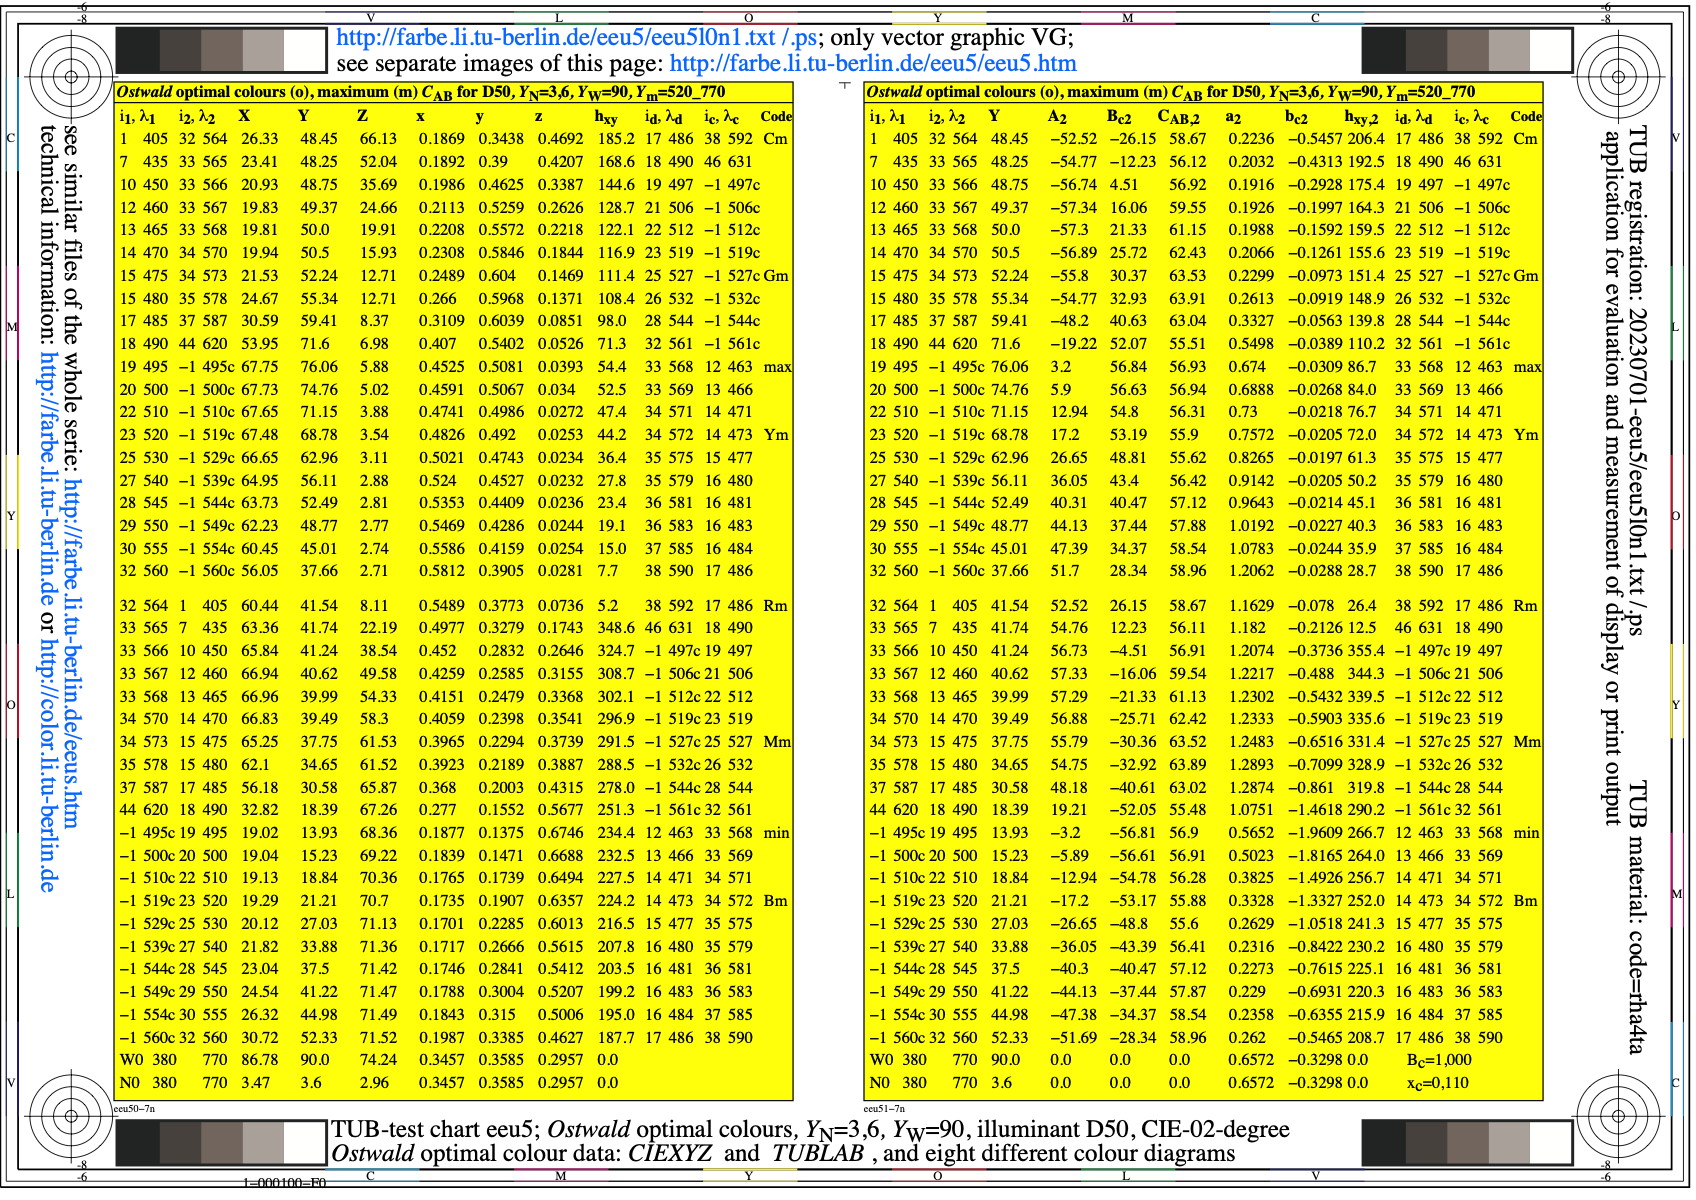
Image eeu5l0n1.jpg: Output in format A6 of the file
eeu5l0np.pdf, see
eeu5l0n1.
PS /
TXT /
PDF /
jpg
eeu5: TUB-test chart eeu5; Ostwald-optimal colours
YN=3,6, YW=90, CIE illuminant D50, CIE 02 degree
Data CIEXYZxy, TUB_YABCh2 with wavelength limits

Image eeu6l0n1.jpg: Output in format A6 of the file
eeu6l0np.pdf, see
eeu6l0n1.
PS /
TXT /
PDF /
jpg
eeu6: TUB-test chart eeu6; Ostwald-optimal colours
YN=3,6, YW=90, CIE illuminant A, CIE 02 degree
Data CIE_XYZxy, TUB_YABCh2 with wavelength limits
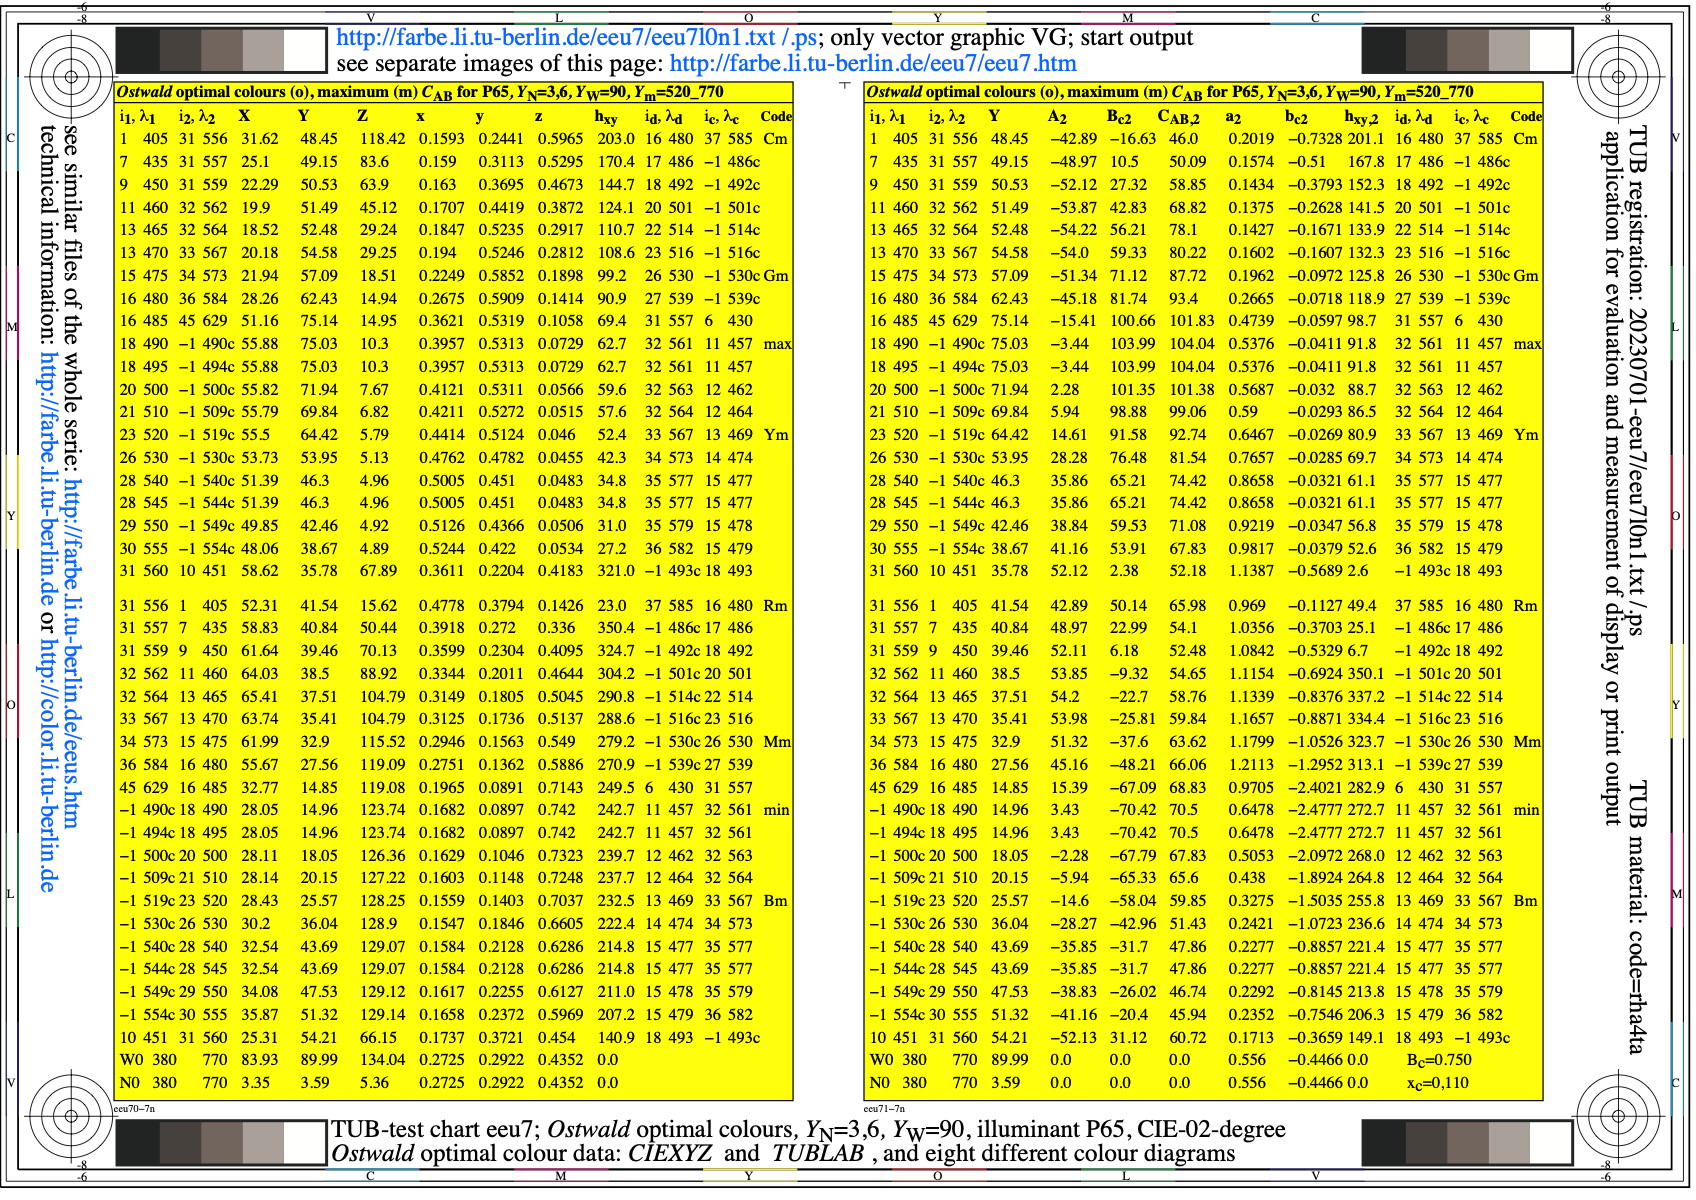
Image eeu7l0n1.jpg: Output in format A6 of the file
eeu7l0np.pdf, see
eeu7l0n1.
PS /
TXT /
PDF /
jpg
eeu7: TUB-test chart eeu7; Ostwald-optimal colours
YN=3,6, YW=90, Planck illuminant P65, CIE 02 deg
Data CIE_XYZxy, TUB_YABCh2 with wavelength limits
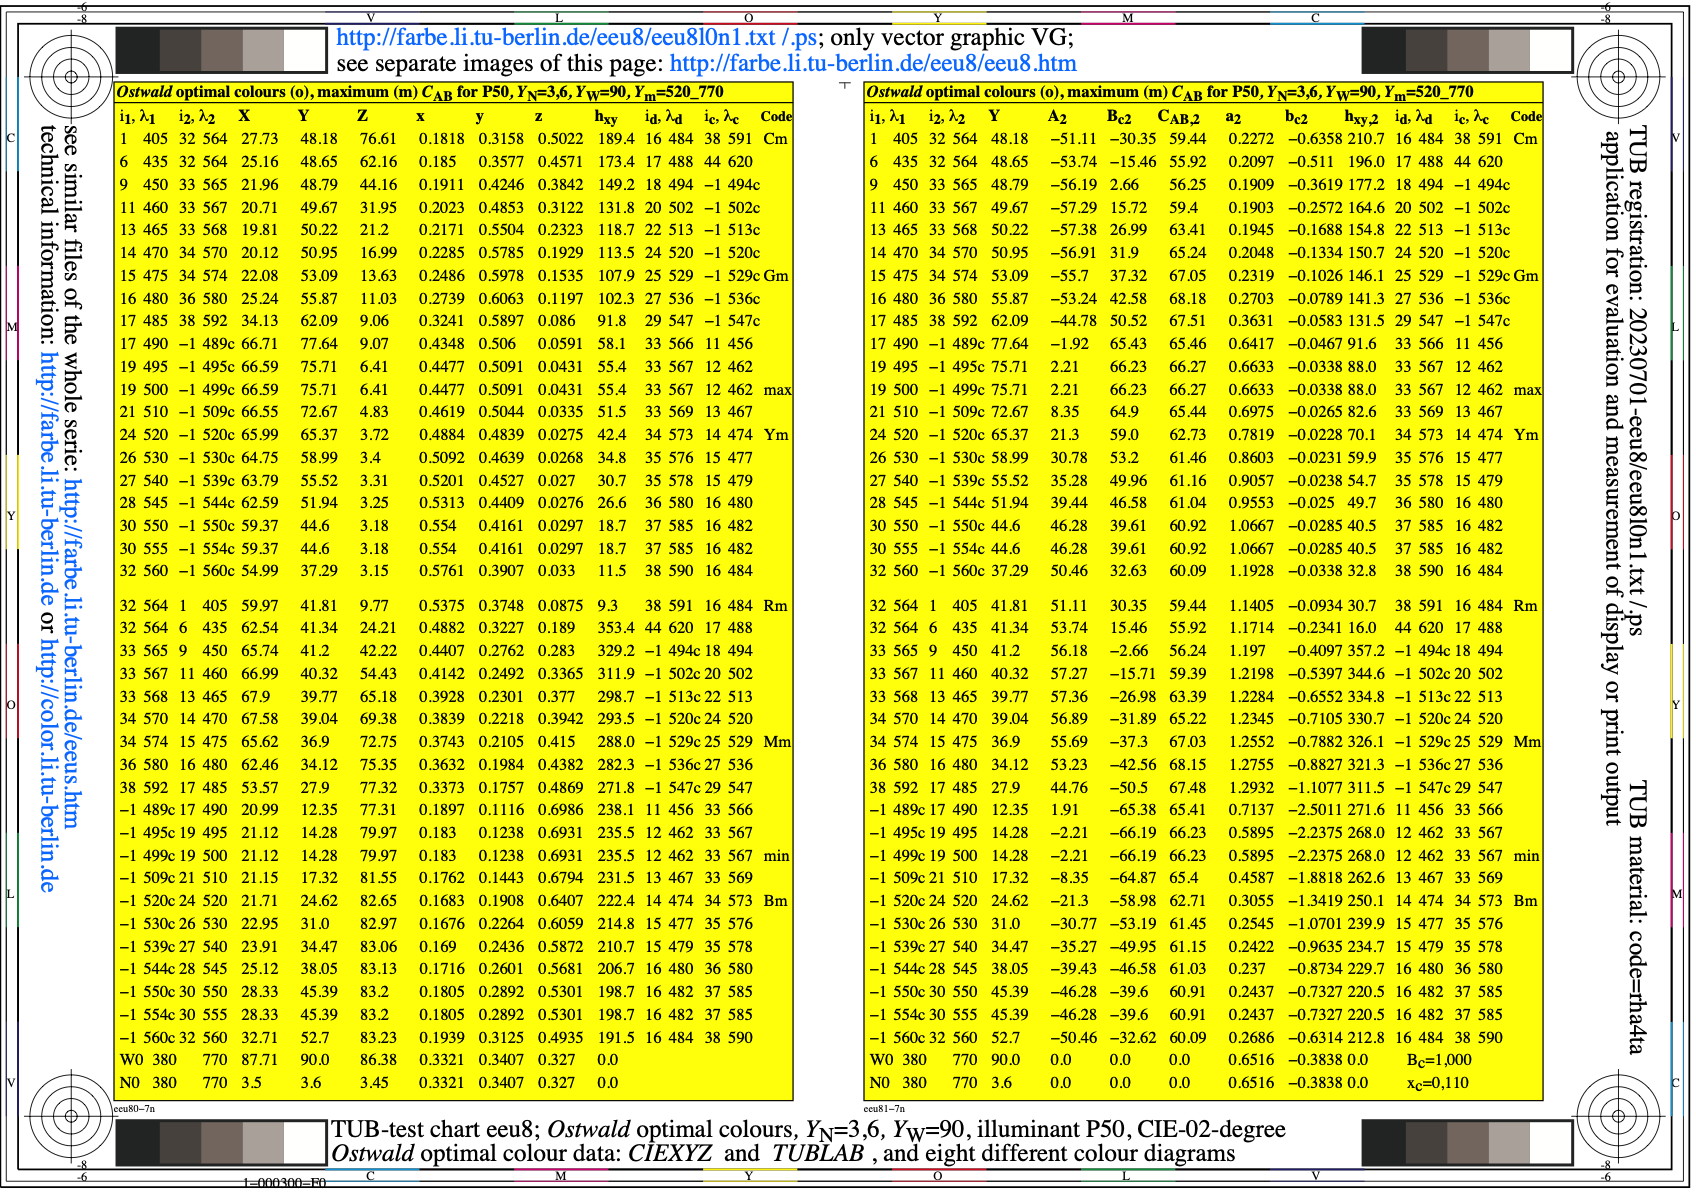
Image eeu8l0n1.jpg: Output in format A6 of the file
eeu8l0np.pdf, see
eeu8l0n1.
PS /
TXT /
PDF /
jpg
eeu8: TUB-test chart eeu8; Ostwald-optimal colours
YN=3,6, YW=90, Planck illuminant P50, CIE 02 deg
Data CIE_XYZxy, TUB_YABCh2 with wavelength limits
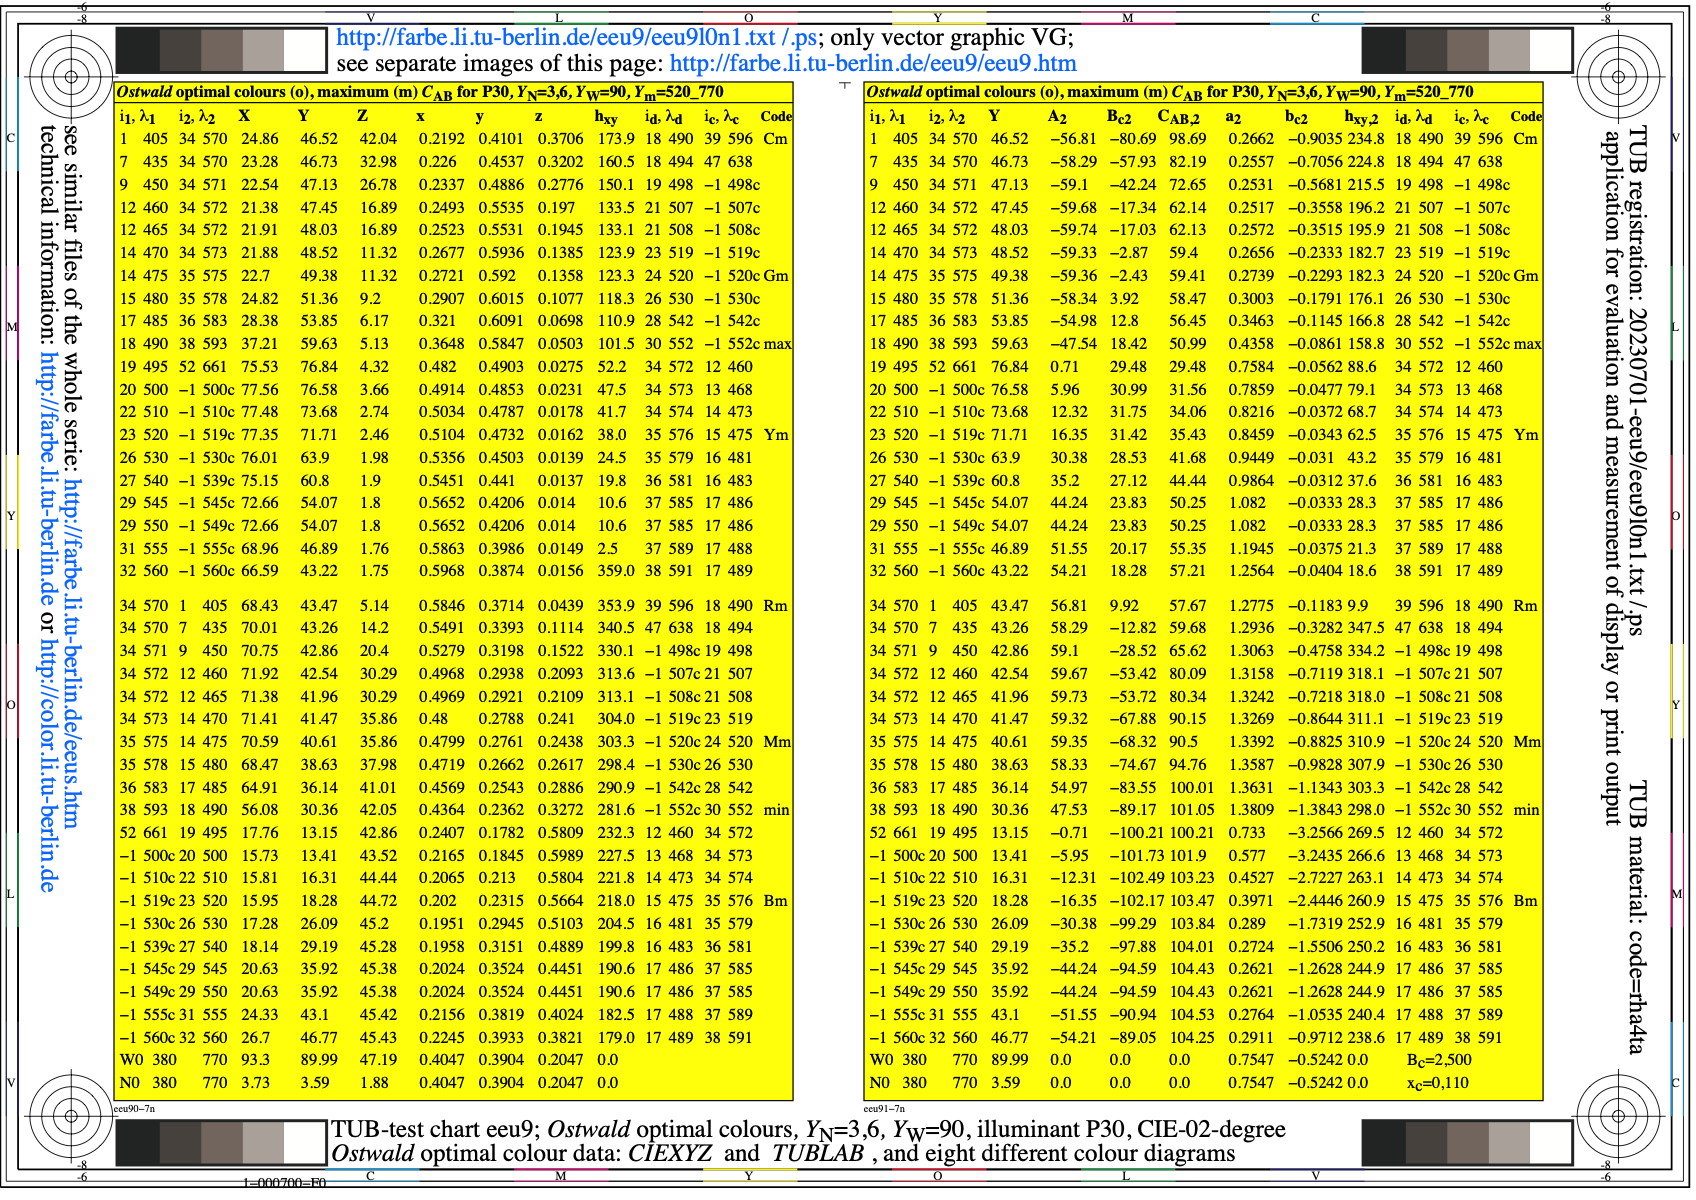
Image eeu9l0n1.jpg: Output in format A6 of the file
eeu9l0np.pdf, see
eeu9l0n1.
PS /
TXT /
PDF /
jpg
eeu9: TUB-test chart eeu9; 8 spectral radiations of Pxx and Dxx
YN=3,6, YW=90, Planck illuminant P30, CIE 02 deg
Data CIE_XYZxy, TUB_YABCh2 with wavelength limits
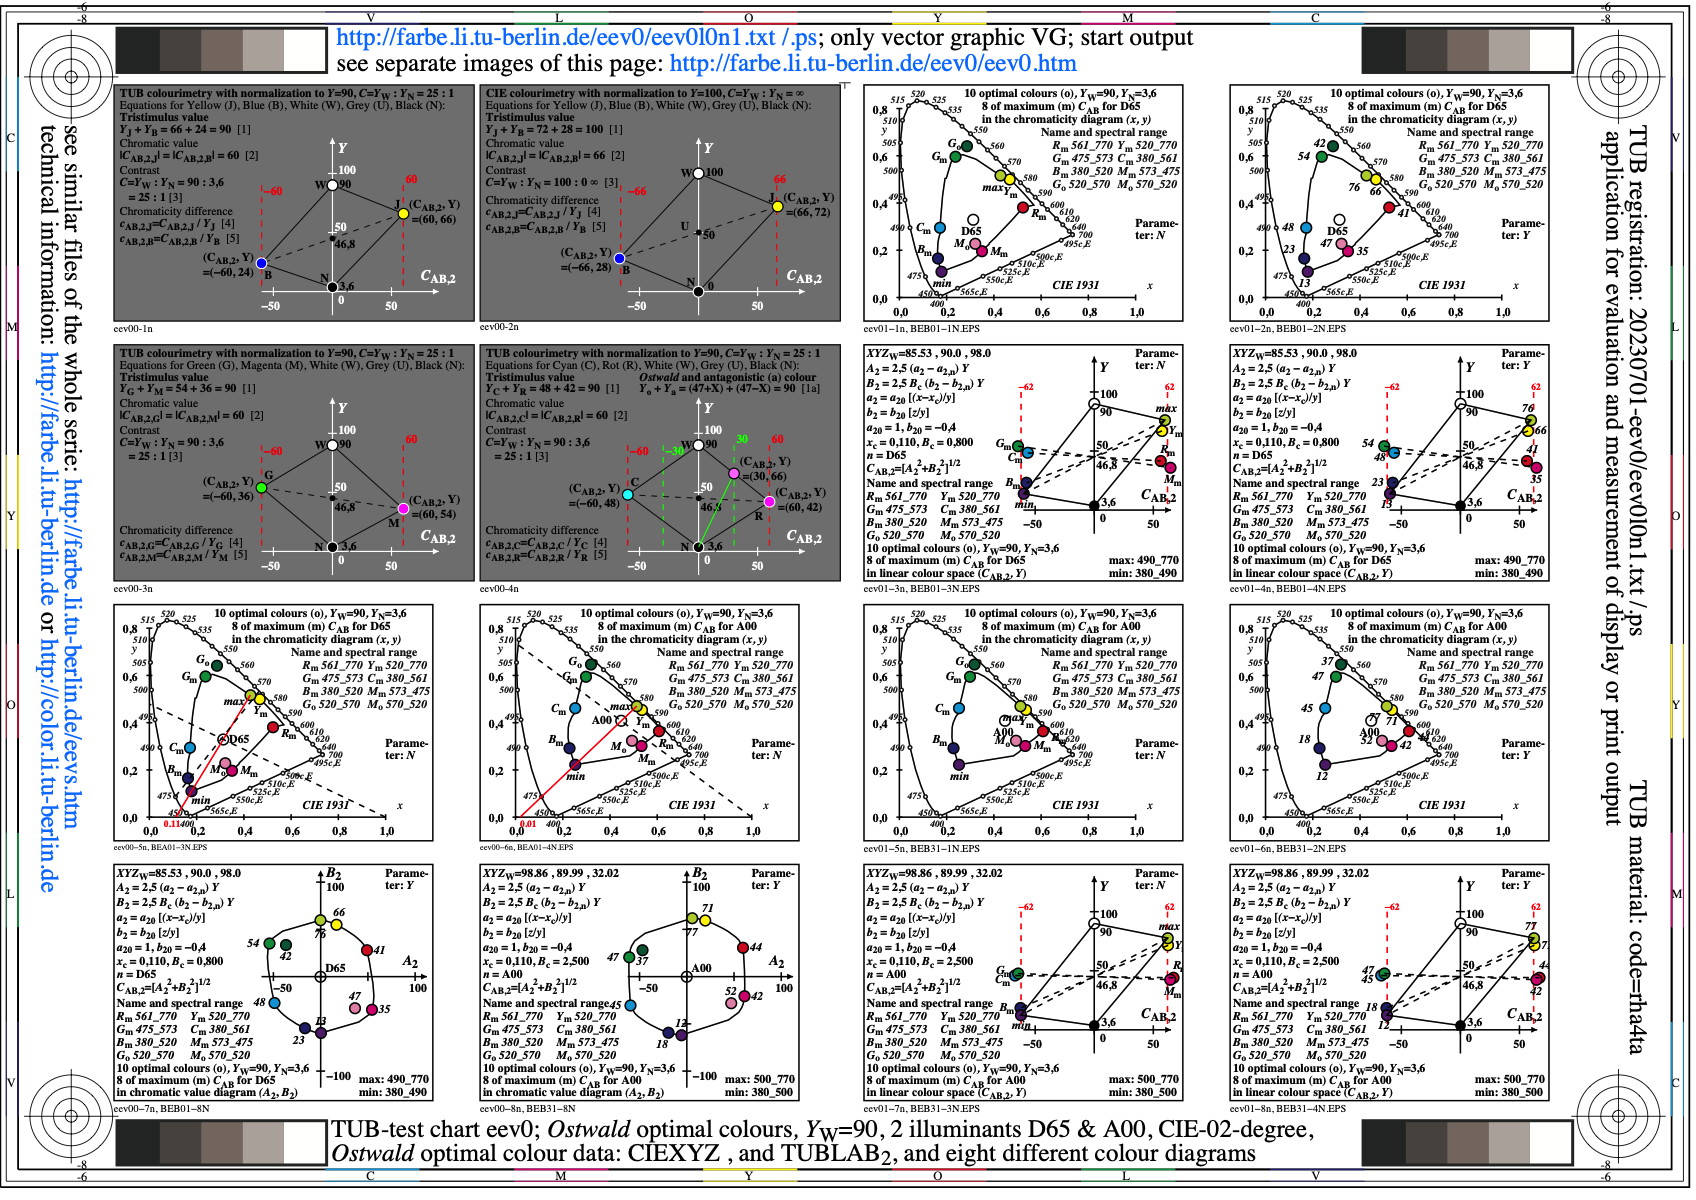
Image eev0l0n1.jpg: Output in format A6 of the file
eev0l0np.pdf, see
eev0l0n1.
PS /
TXT /
PDF /
jpg
eev0: TUB-test chart eev0; Ostwald-optimal colours
Yw=90, illuminants D65 and A, CIE 02 degree,
data CIEXYZ and TUBLAB2 in eigth different colour diagrams
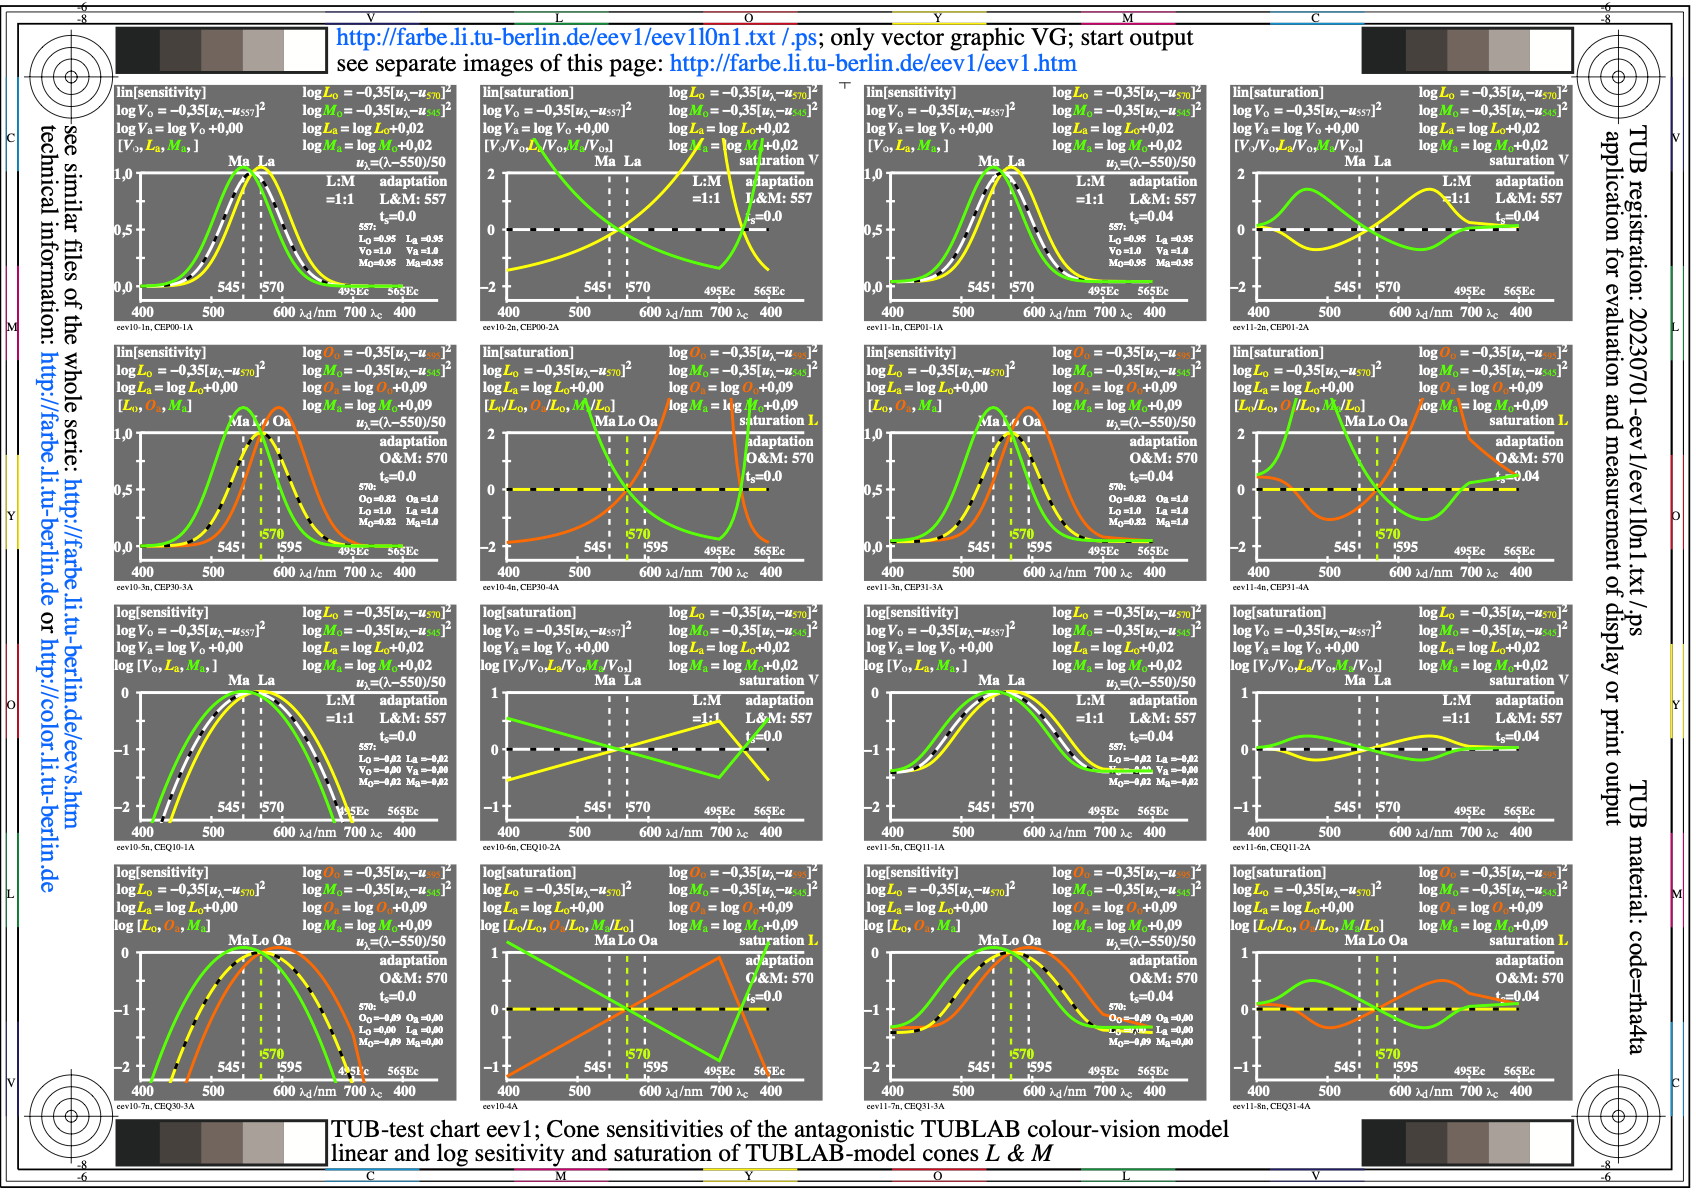
Image eev1l0n1.jpg: Output in format A6 of the file
eev1l0np.pdf, see
eev1l0n1.
PS /
TXT /
PDF /
jpg
eev1: TUB-test chart eev1; Cone sensitivities TUBLAB model
linear and logarithmic sensitivities and saturation
of TUBLAB-model cones L and M
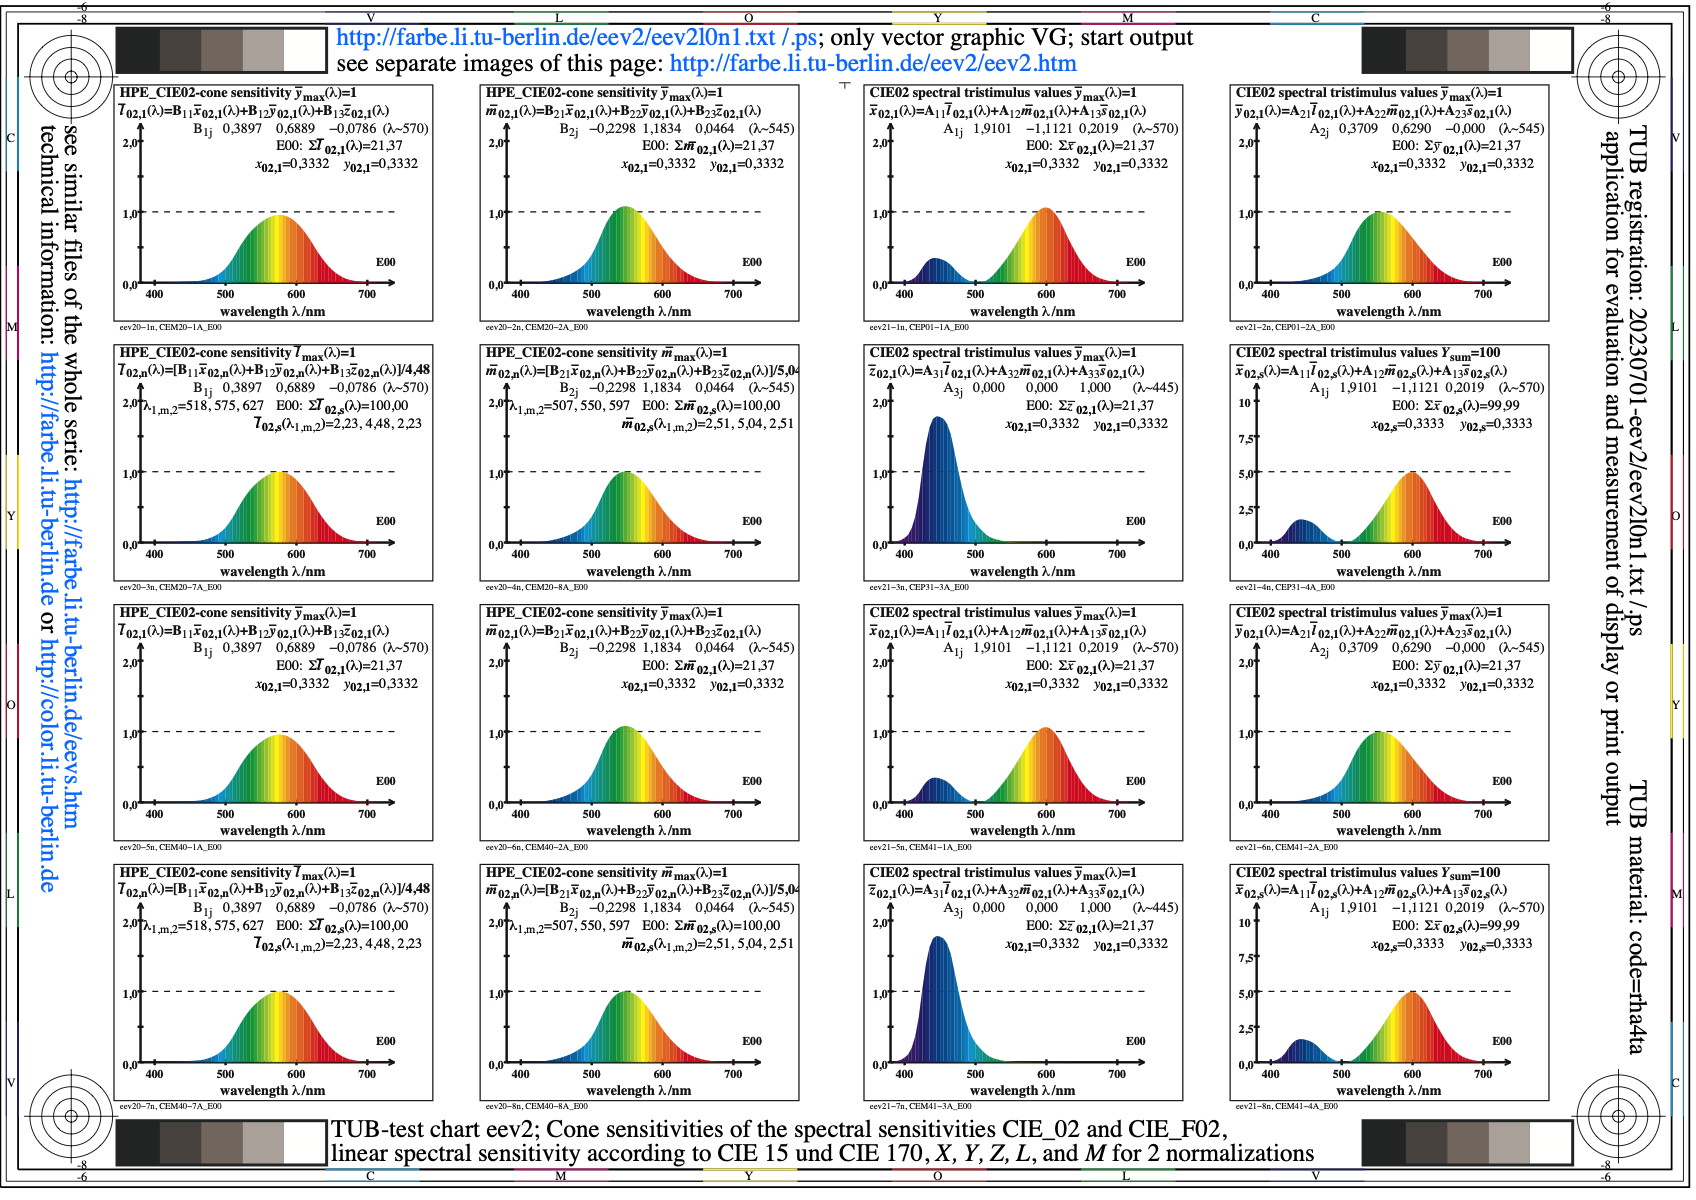
Image eev2l0n1.jpg: Output in format A6 of the file
eev2l0np.pdf, see
eev2l0n1.
PS /
TXT /
PDF /
jpg
eev2: TUB-test chart eev2; Cone sensitivities CIE_02 & CIE_F02
linear spectral sensitivities according to CIE 15 & CIE 170:
X, Y, Z, L, and M for two normalization
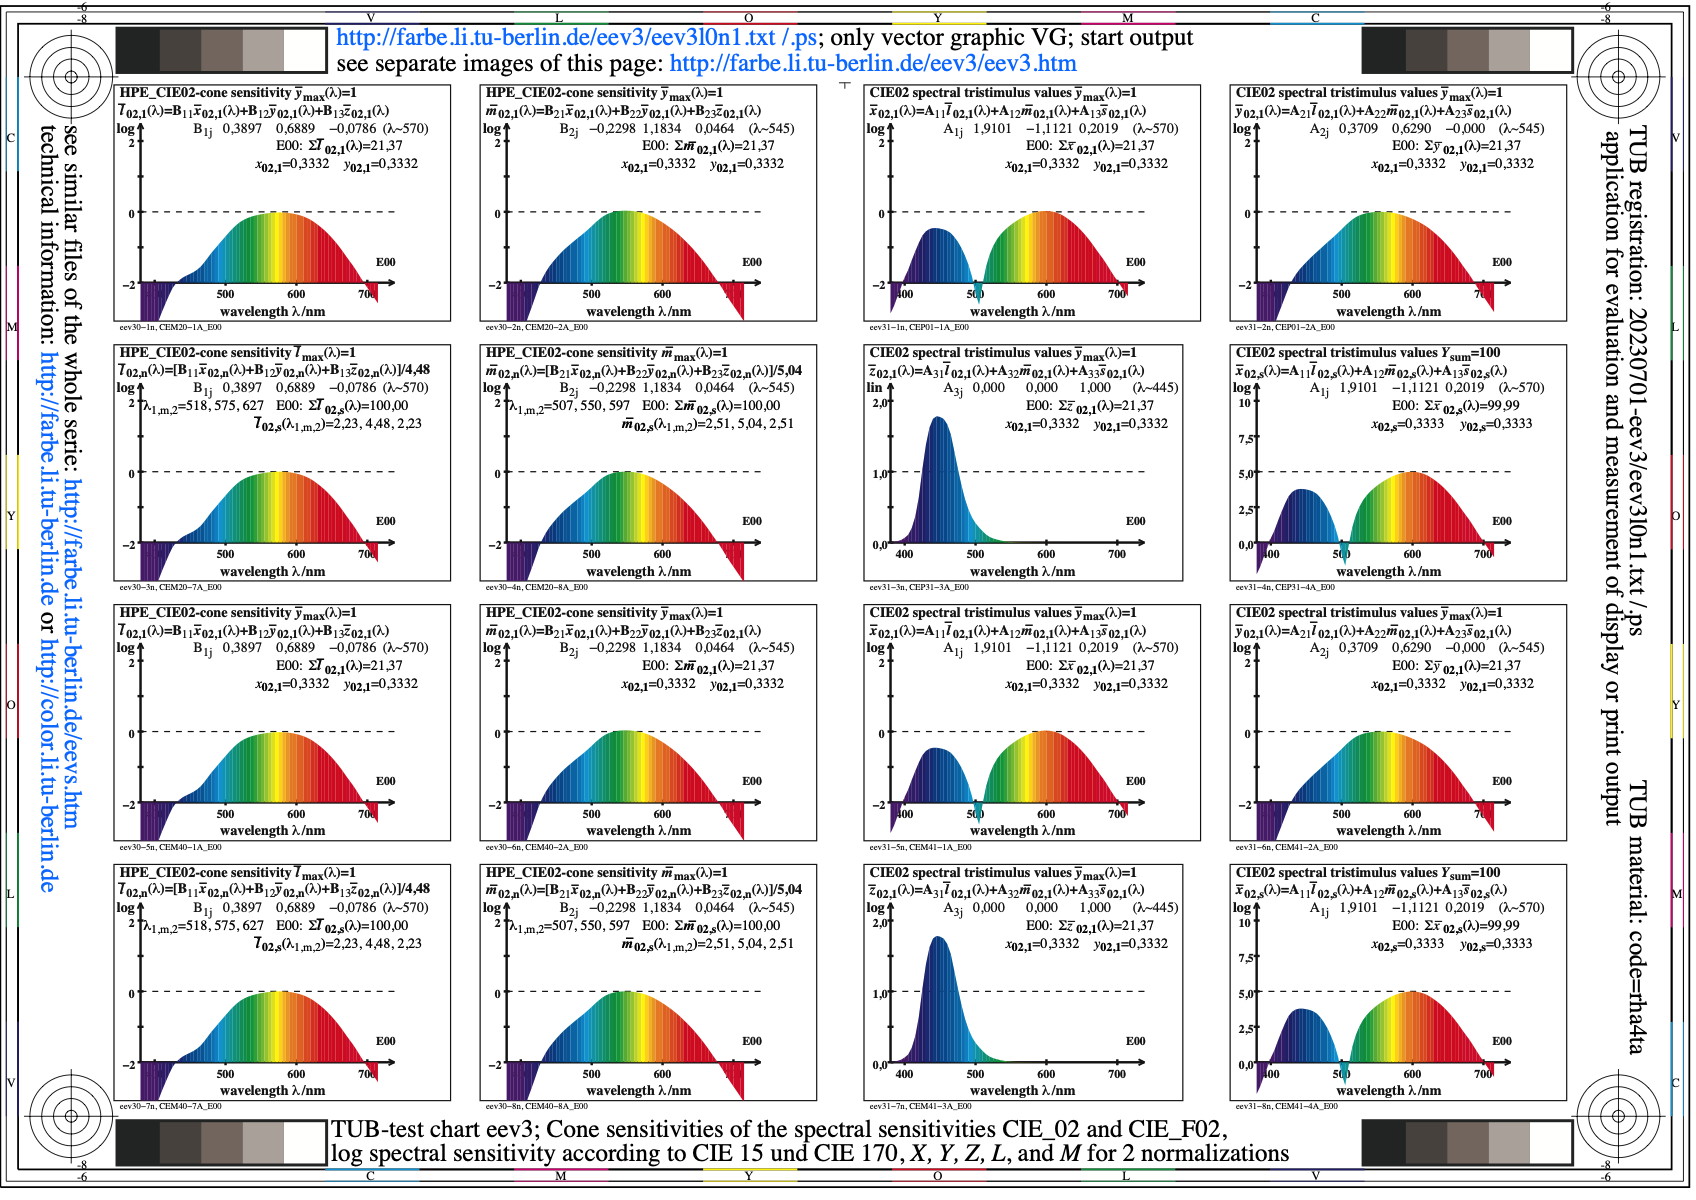
Image eev3l0n1.jpg: Output in format A6 of the file
eev3l0np.pdf, see
eev3l0n1.
PS /
TXT /
PDF /
jpg
eev3: TUB-test chart eev3; Cone sensitivities CIE_02 & CIE_F02
logar. spectral sensitivities according to CIE 15 & CIE 170:
X, Y, Z, L, and M for two normalization
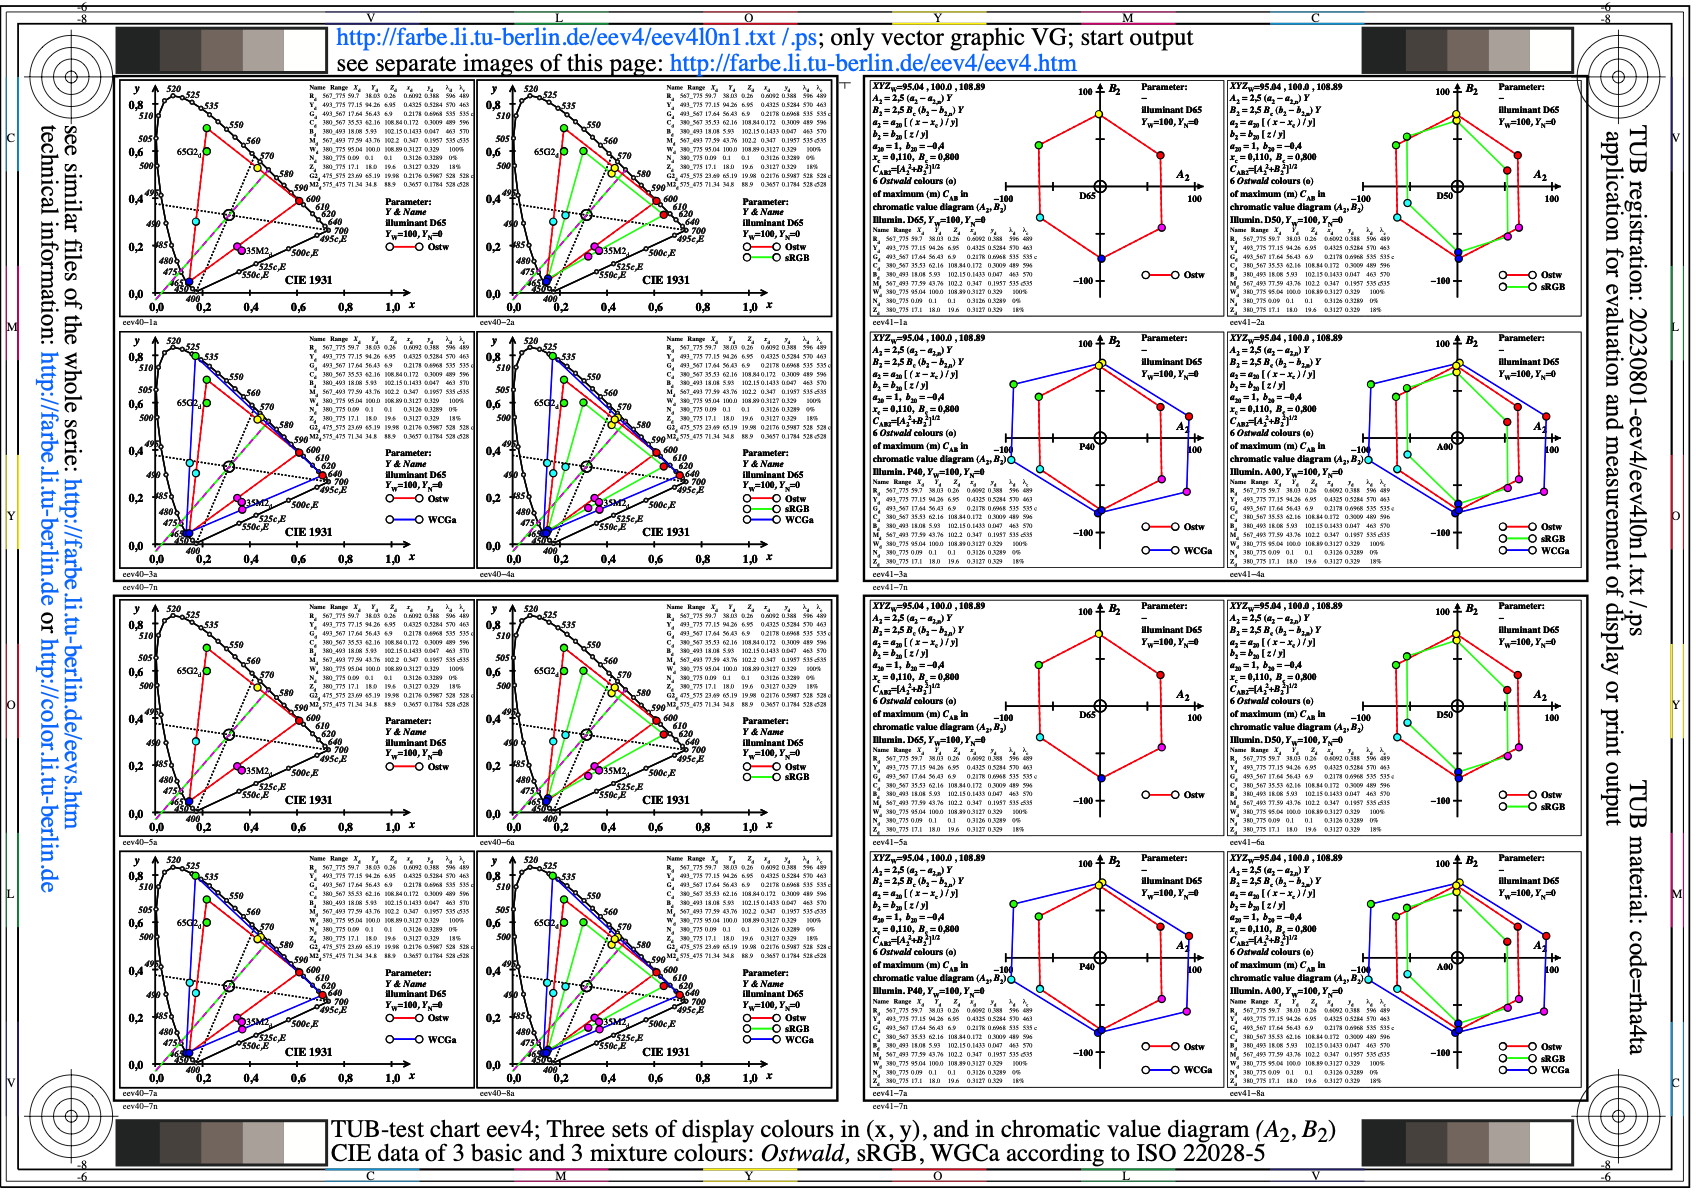
Image eev4l0n1.jpg: Output in format A6 of the file
eev4l0np.pdf, see
eev4l0n1.
PS /
TXT /
PDF /
jpg
eev4: TUB-test chart eev4; Three sets of display colours
in (x, y) and (A2, B2), 3 basic and mixture
colours: Ostwald, sRGB, WCGa according to ISO 22028-5
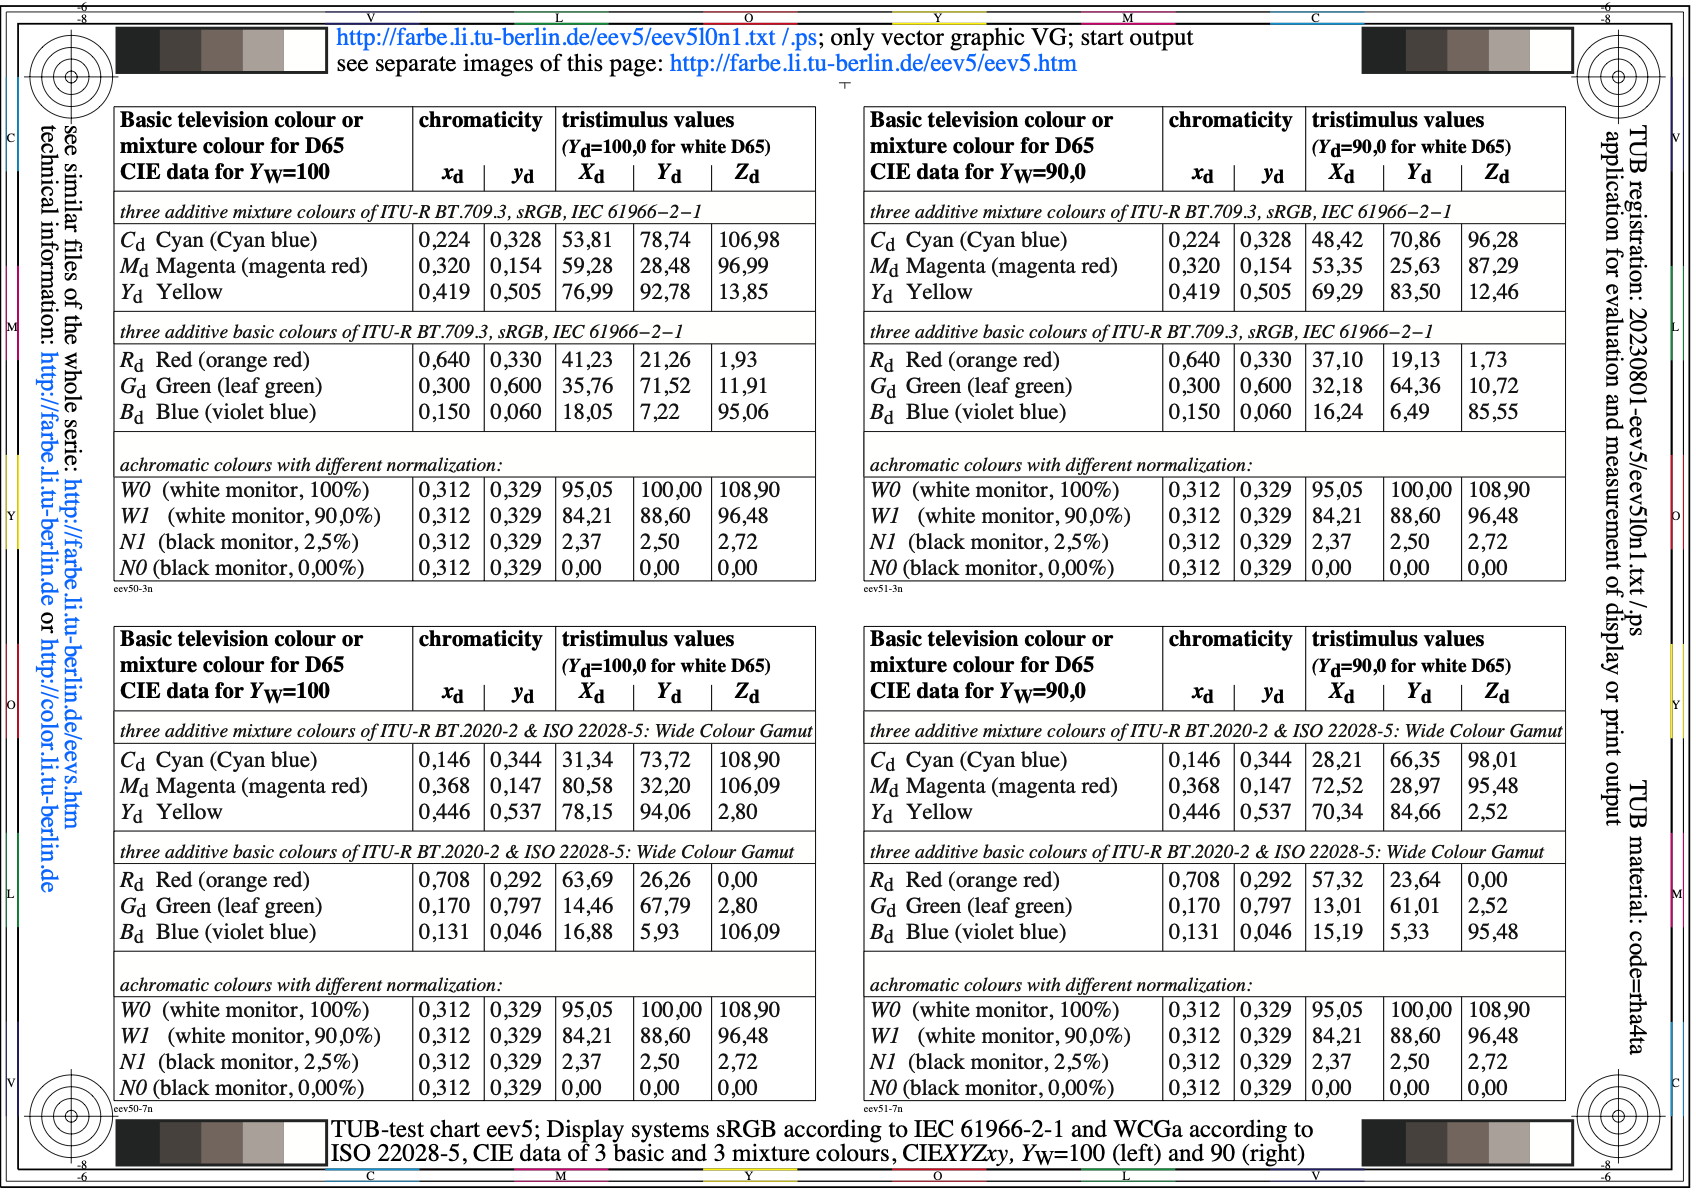
Image eev5l0n1.jpg: Output in format A6 of the file
eev5l0np.pdf, see
eev5l0n1.
PS /
TXT /
PDF /
jpg
eev5: TUB-test chart eev5; Colour-display systems
sRGB according IEC 61966-2-1, WCGa according to ISO 22028-5,
3 basic and mixture colours: CIEXYZxy, Y=100 and 90
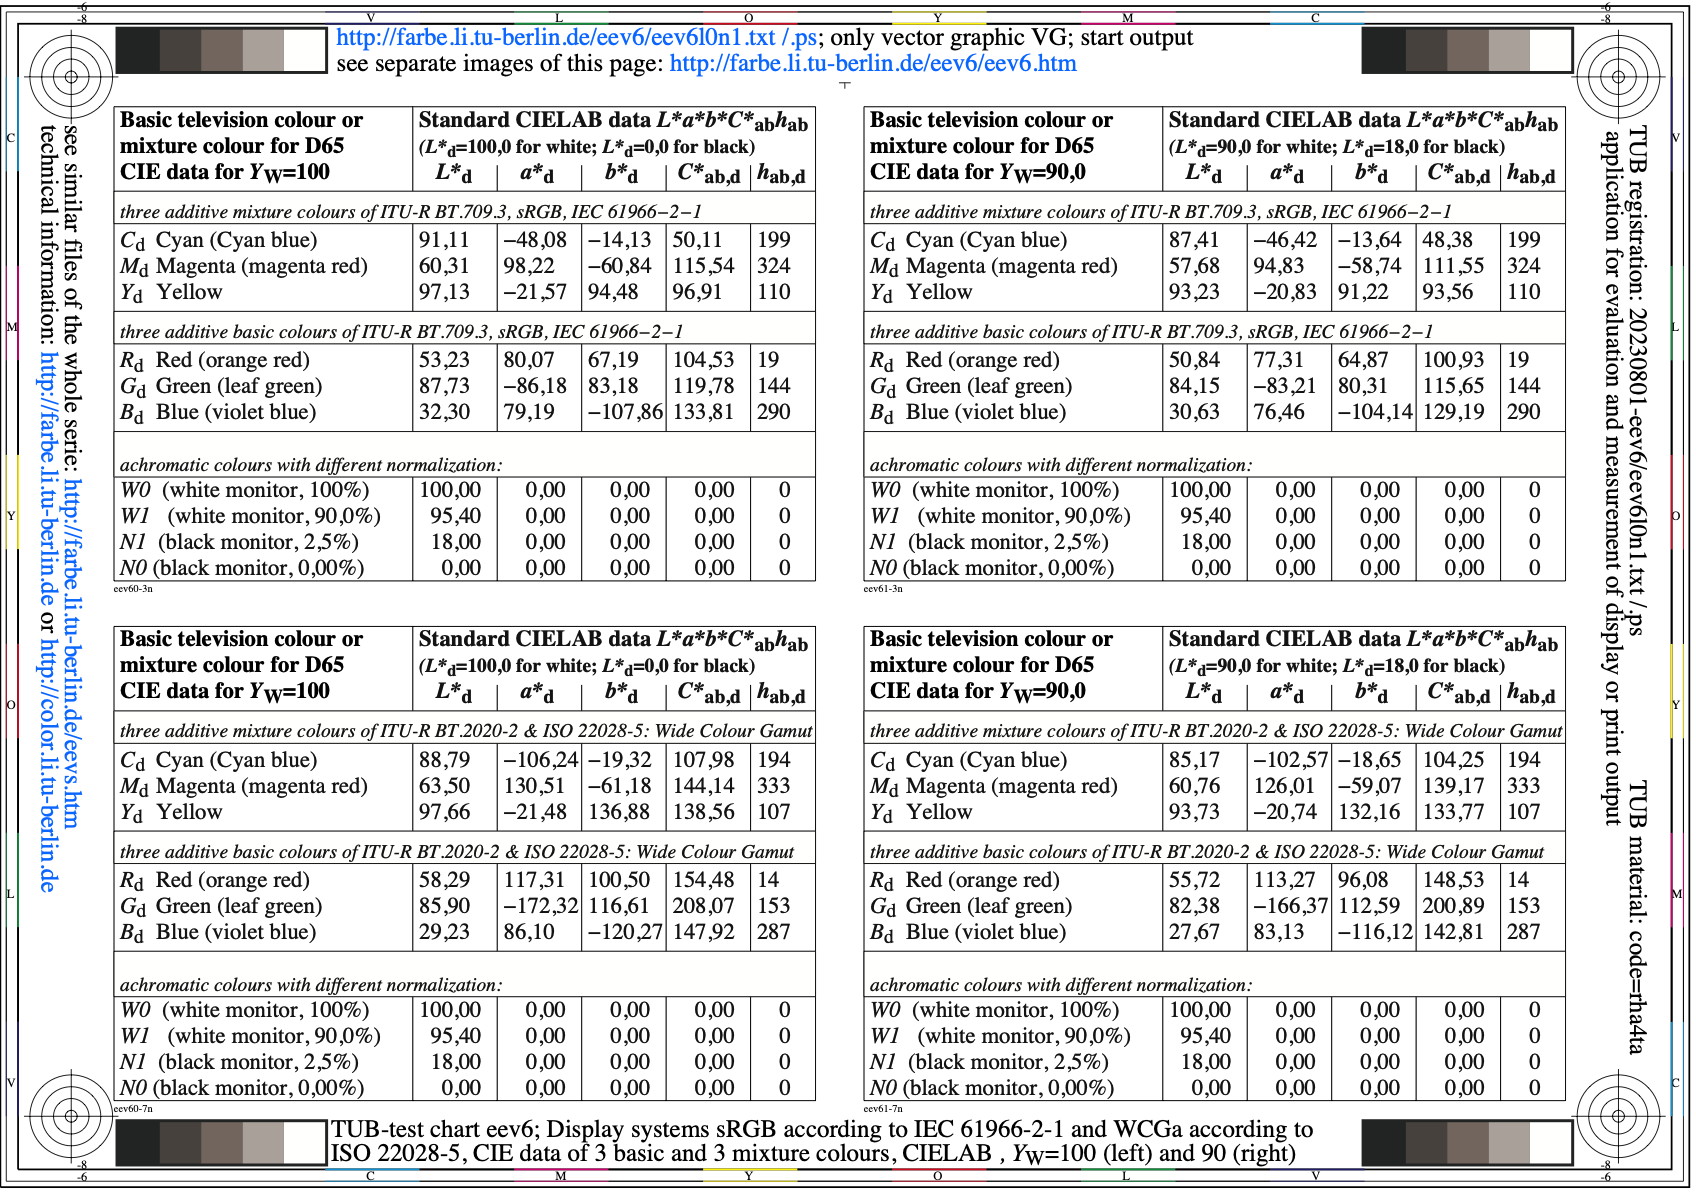
Image eev6l0n1.jpg: Output in format A6 of the file
eev6l0np.pdf, see
eev6l0n1.
PS /
TXT /
PDF /
jpg
eev6: TUB-test chart eev6; Colour-display systems
sRGB according IEC 61966-2-1, WCGa according to ISO 22028-5,
3 basic and mixture colours: CIELAB, Y=100 and 90
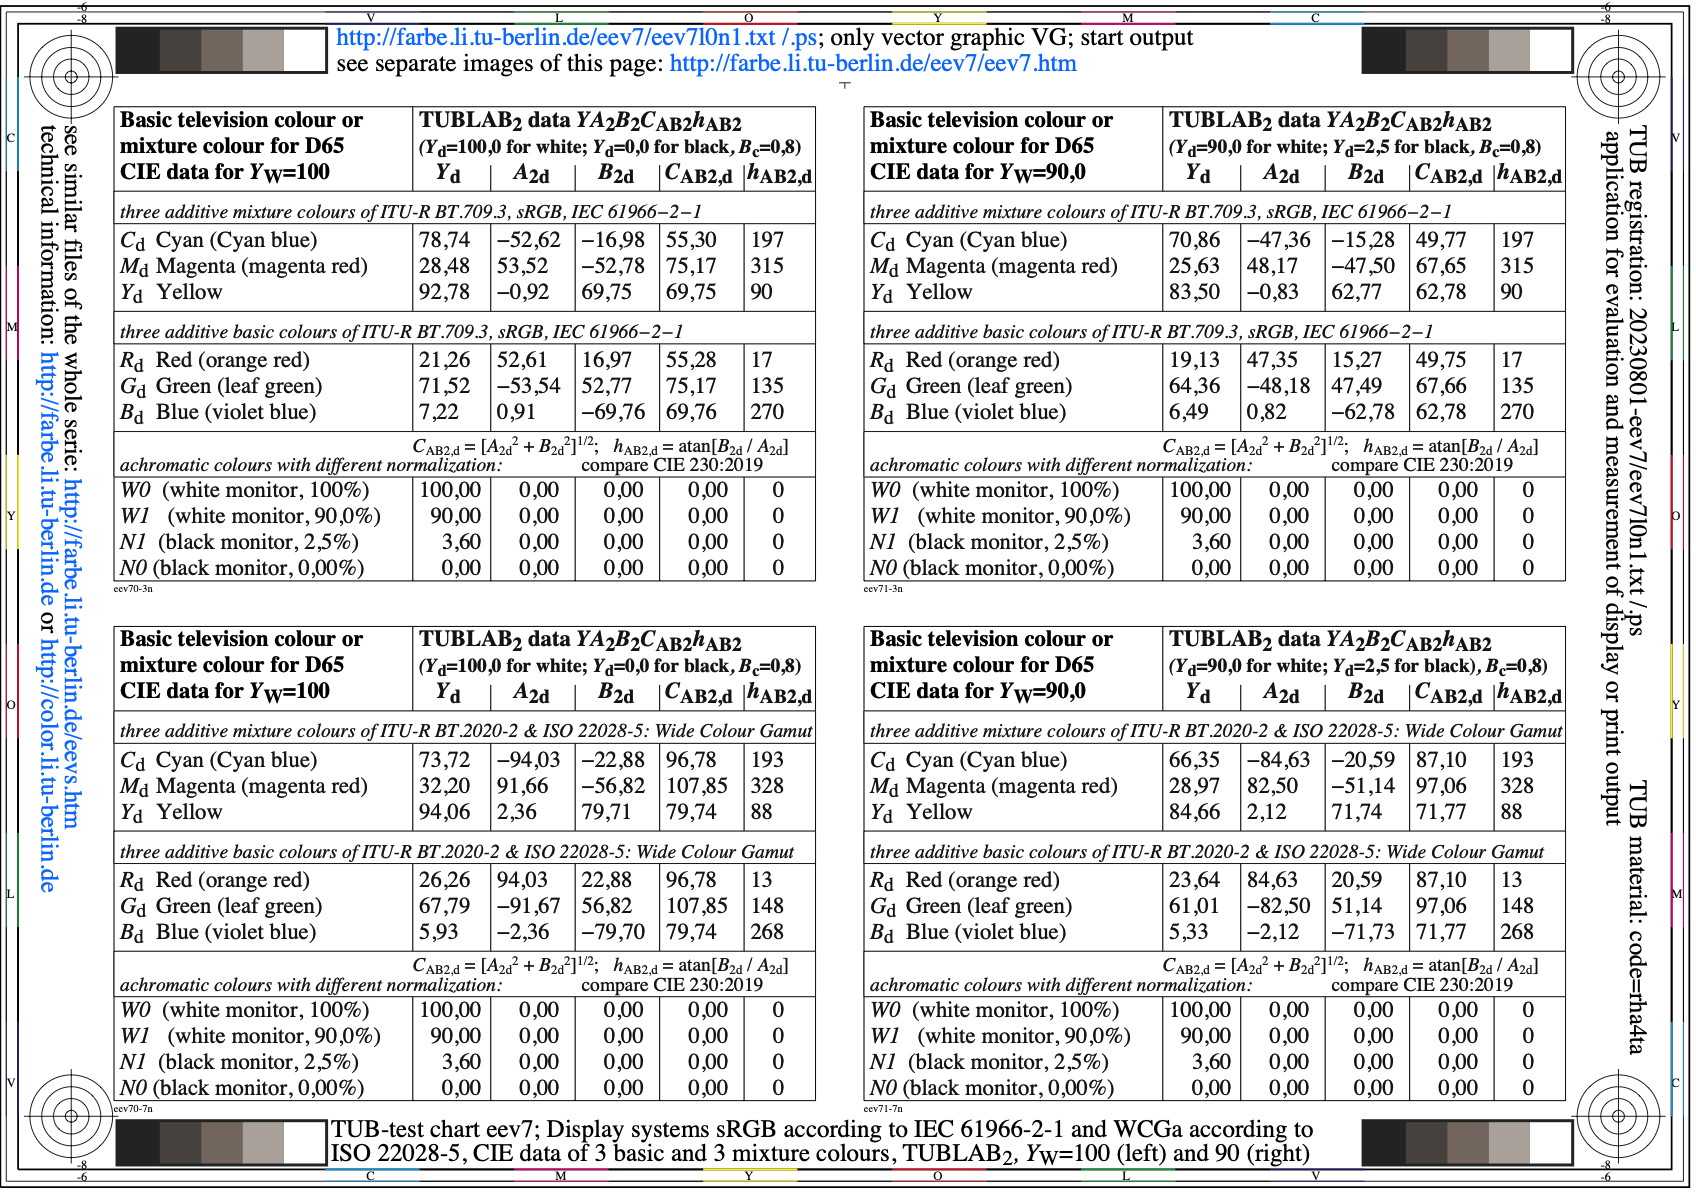
Image eev7l0n1.jpg: Output in format A6 of the file
eev7l0np.pdf, see
eev7l0n1.
PS /
TXT /
PDF /
jpg
eev7: TUB-test chart eev7;Colour-display systems
sRGB according IEC 61966-2-1, WCGa according to ISO 22028-5,
3 basic and mixture colours: TUBLAB2, Y=100 and 90
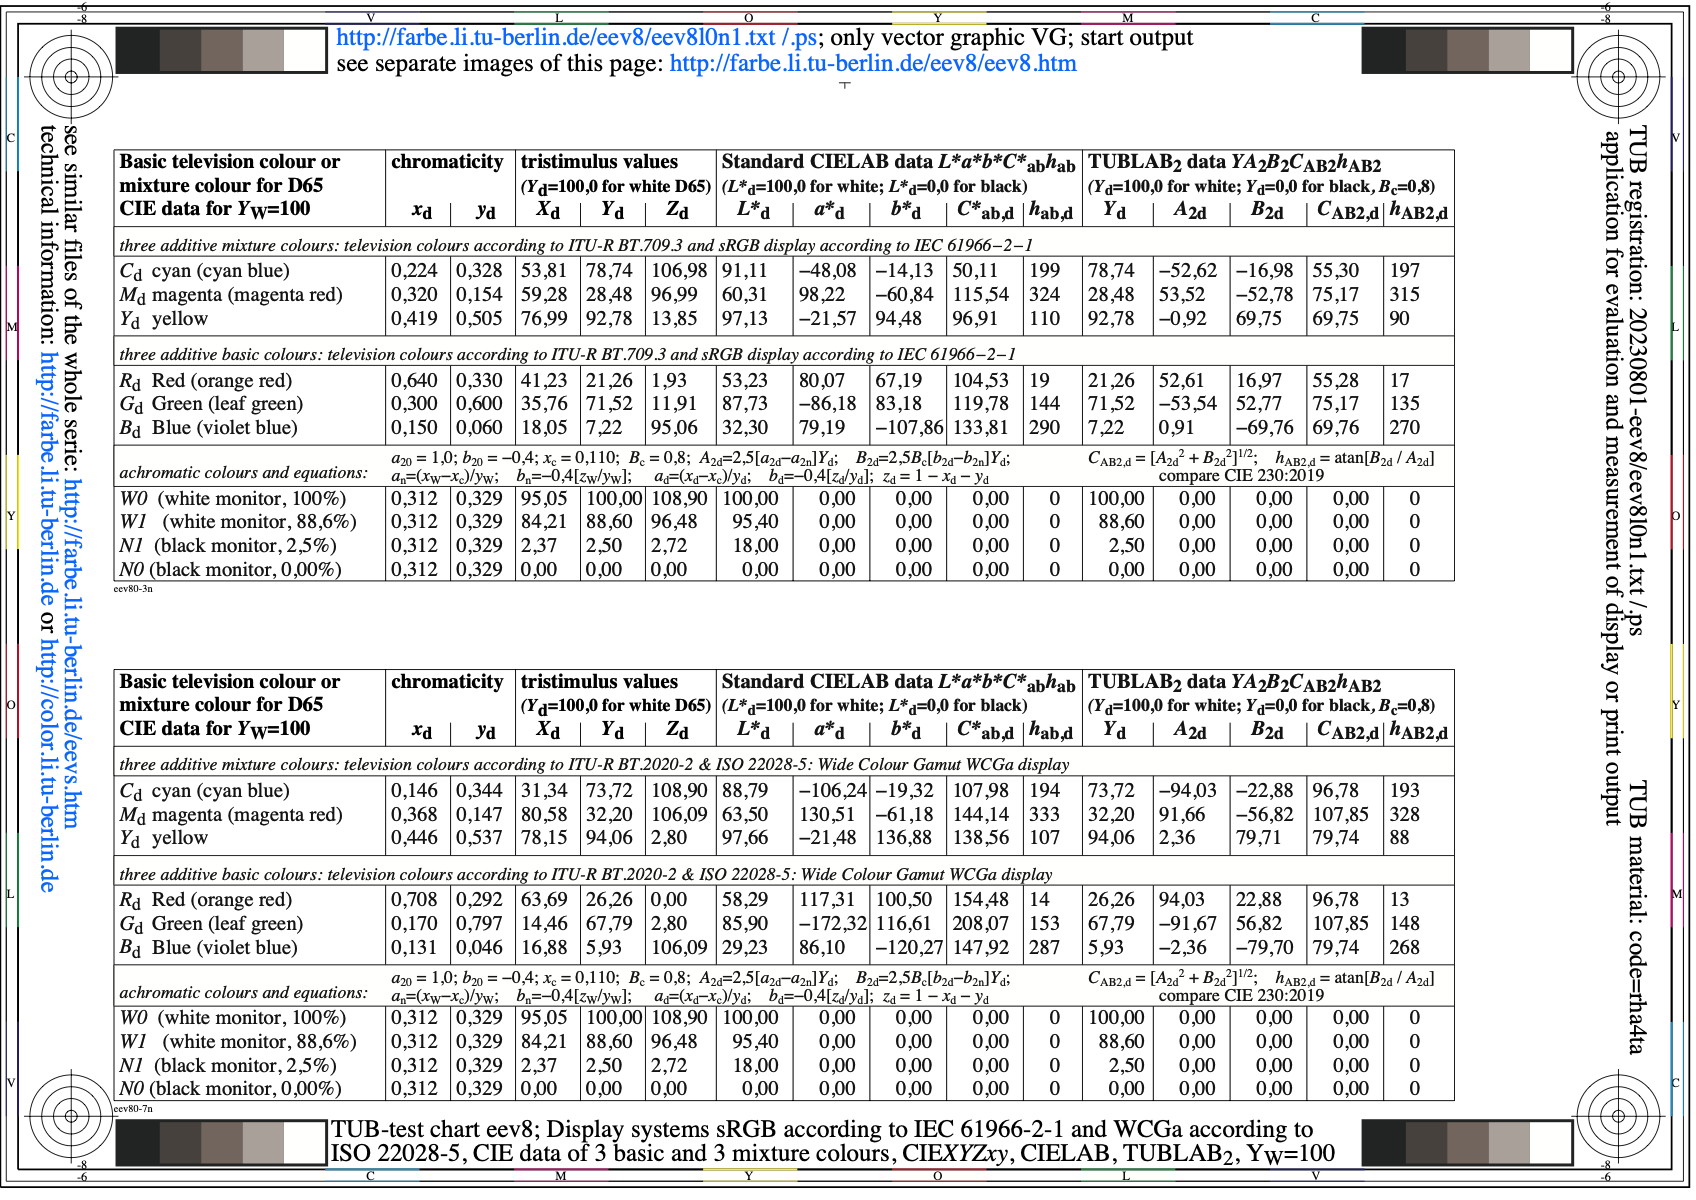
Image eev8l0n1.jpg: Output in format A6 of the file
eev8l0np.pdf, see
eev8l0n1.
PS /
TXT /
PDF /
jpg
eev8: TUB-test chart eev8;Colour-display systems
sRGB according IEC 61966-2-1, WCGa according to ISO 22028-5,
basic & mixture colours: CIEXYZxy, CIELAB, TUBLAB2, Y=100

Image eev9l0n1.jpg: Output in format A6 of the file
eev9l0np.pdf, see
eev9l0n1.
PS /
TXT /
PDF /
jpg
eev9: TUB-test chart eev9;Colour-display systems
sRGB according IEC 61966-2-1, WCGa according to ISO 22028-5,
basic & mixture colours: CIEXYZxy, CIELAB, TUBLAB2, Y=90
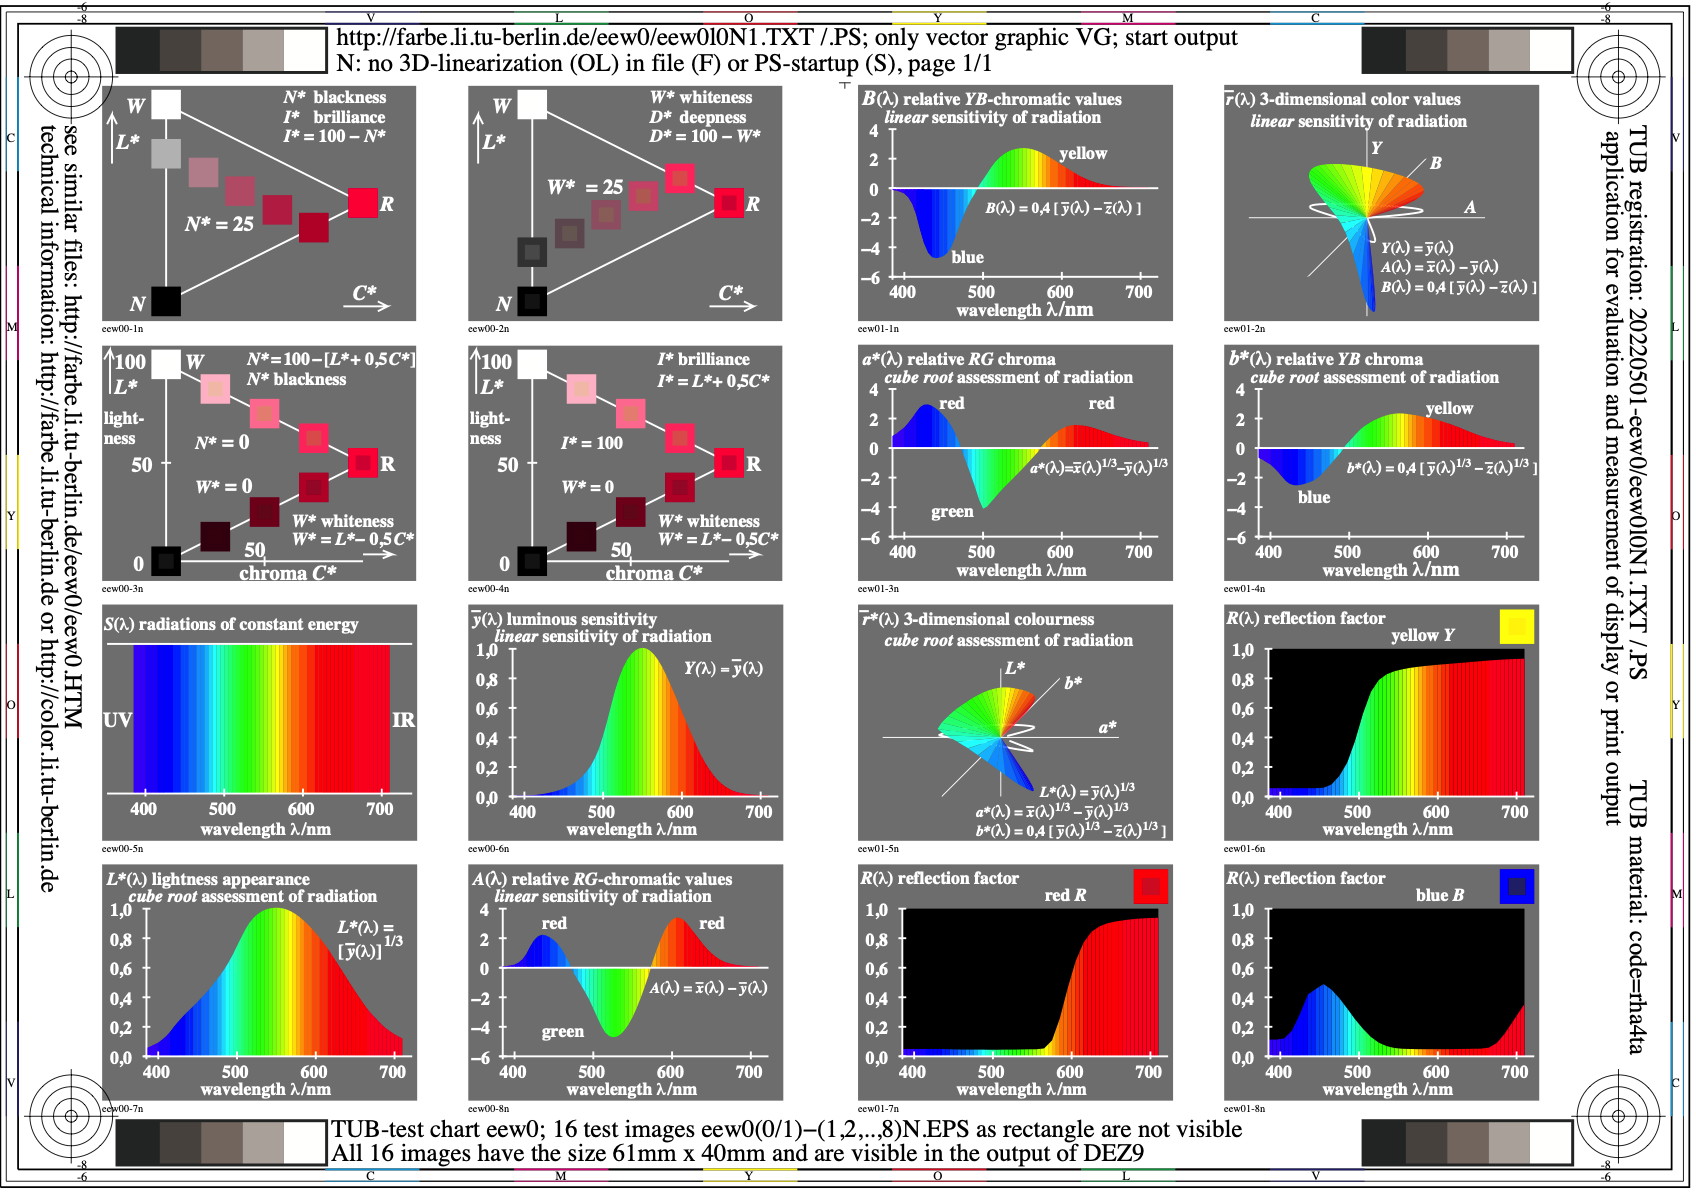
Image eew0l0n1.jpg: Output in format A6 of the file
eew0l0np.pdf, see
eew0l0n1.
PS /
TXT /
PDF /
jpg
eew0: TUB-test chart eew0; Basic properties of colourimetry,
colour attributes in a hue plane, spectral luminous values,
spectral chroma, spectral reflection of surface colours
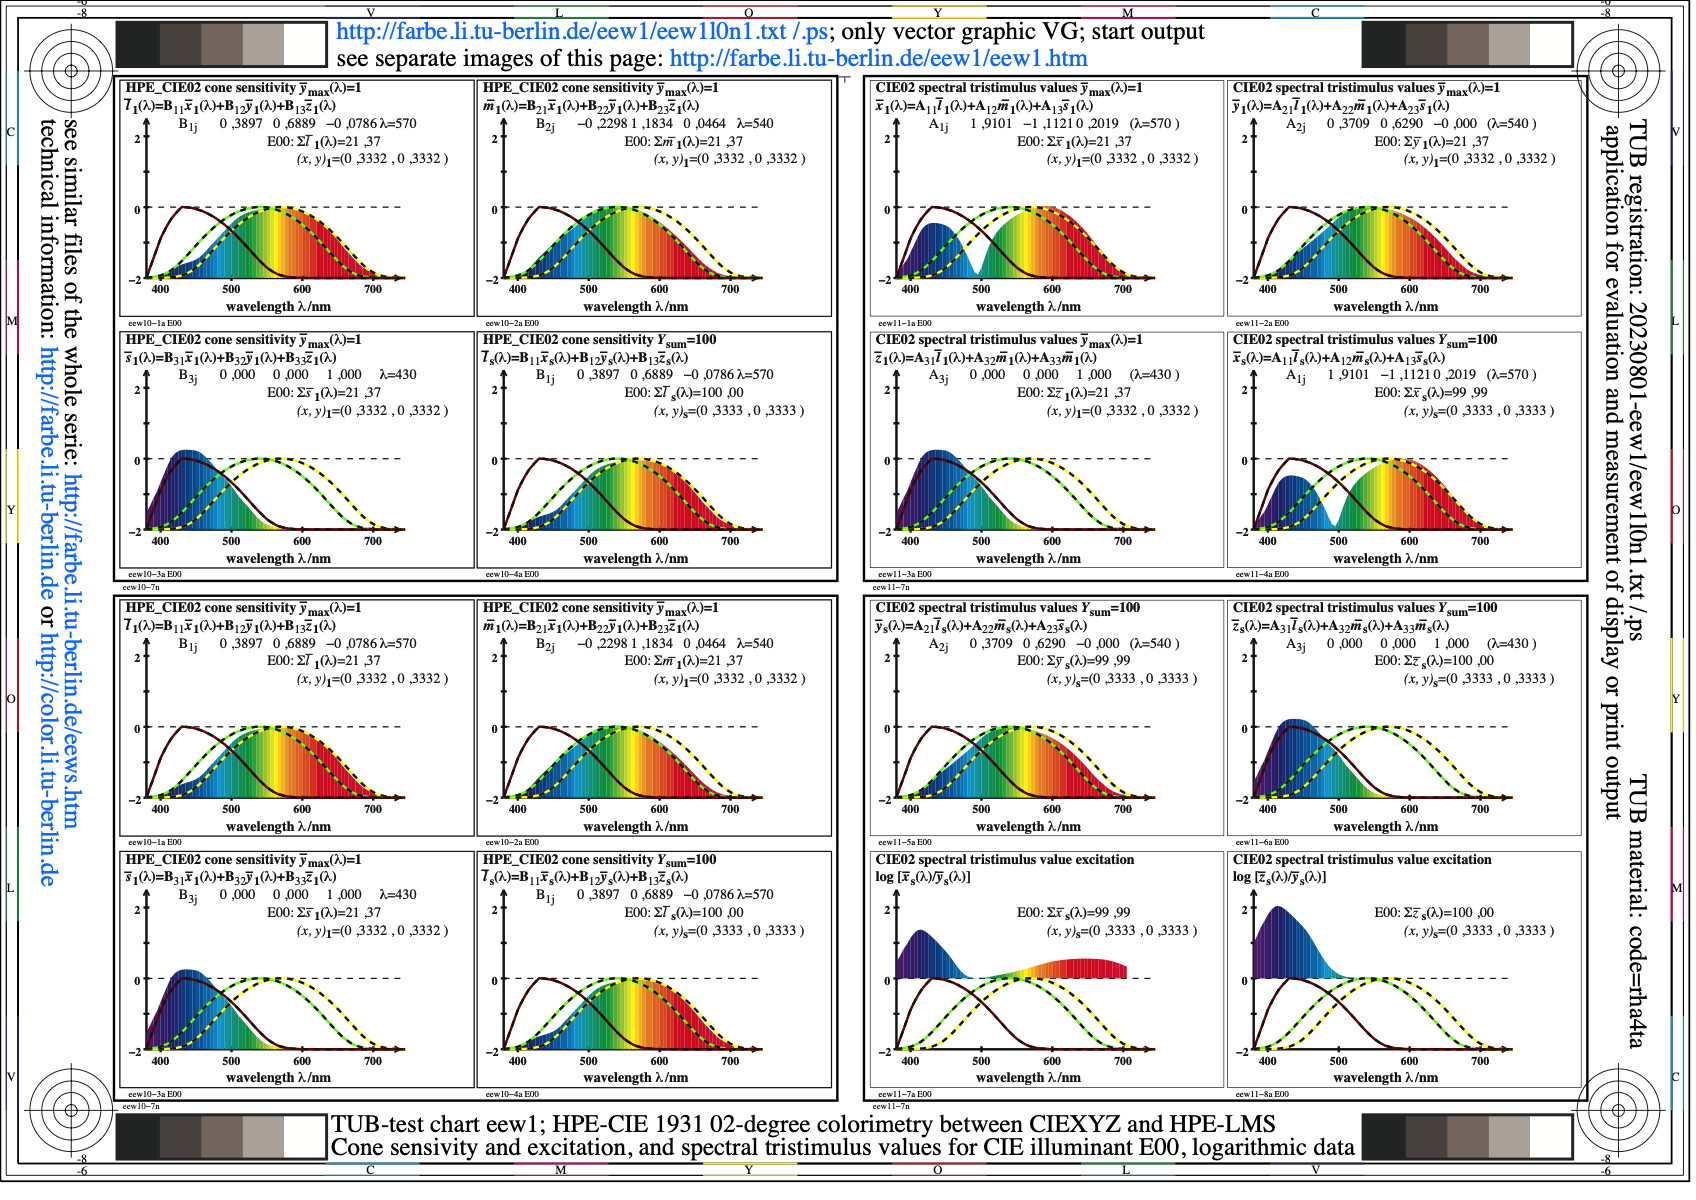
Image eew1l0n1.jpg: Output in format A6 of the file
eew1l0np.pdf, see
eew1l0n1.
PS /
TXT /
PDF /
jpg
eew1: TUB-test chart eew1; HPE-CIE 1931 02-degree colourimetry
between CIEXYZ and HPE-LMS cone sensitivity and
responce, spectral colour values for illuminant E, log data
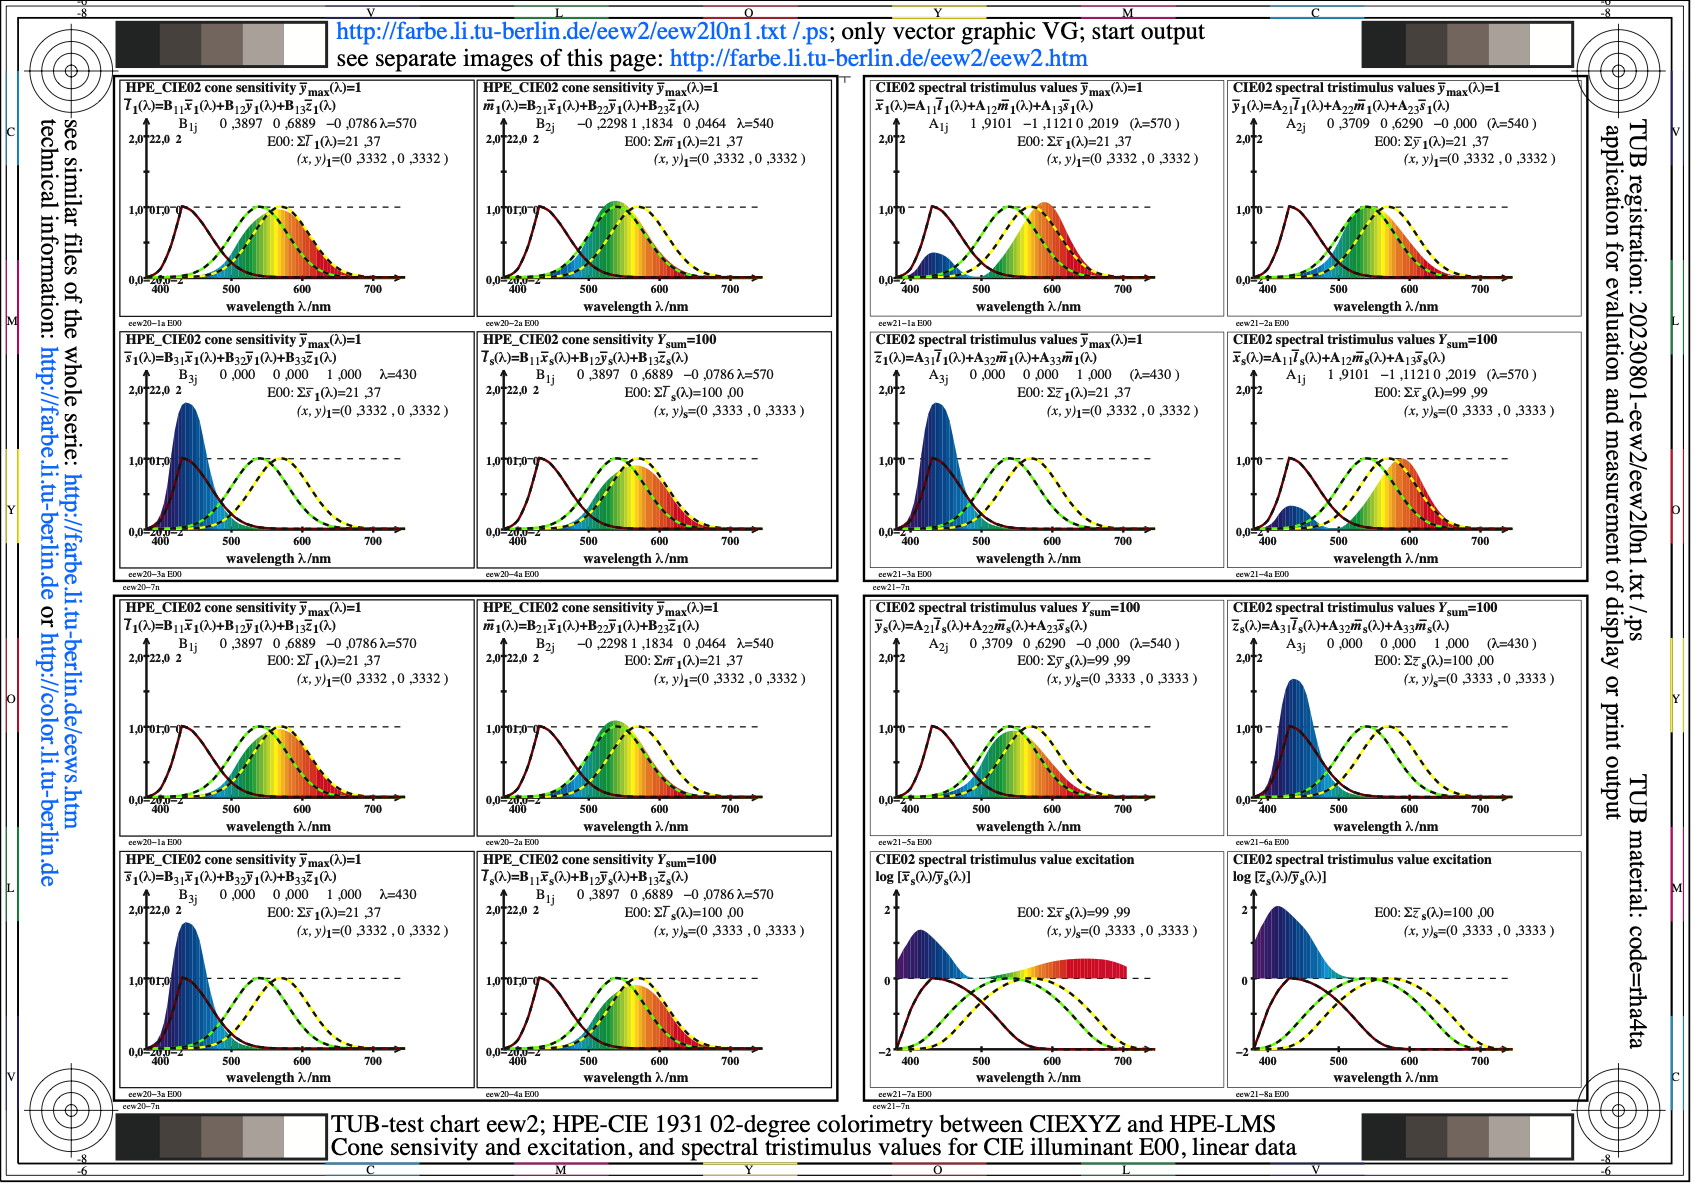
Image eew2l0n1.jpg: Output in format A6 of the file
eew2l0np.pdf, see
eew2l0n1.
PS /
TXT /
PDF /
jpg
eew2: TUB-test chart eew2; HPE-CIE 1931 02-degree colourimetry
between CIEXYZ and HPE-LMS cone sensitivity and
responce, spectral colour values for illuminant E, linear data
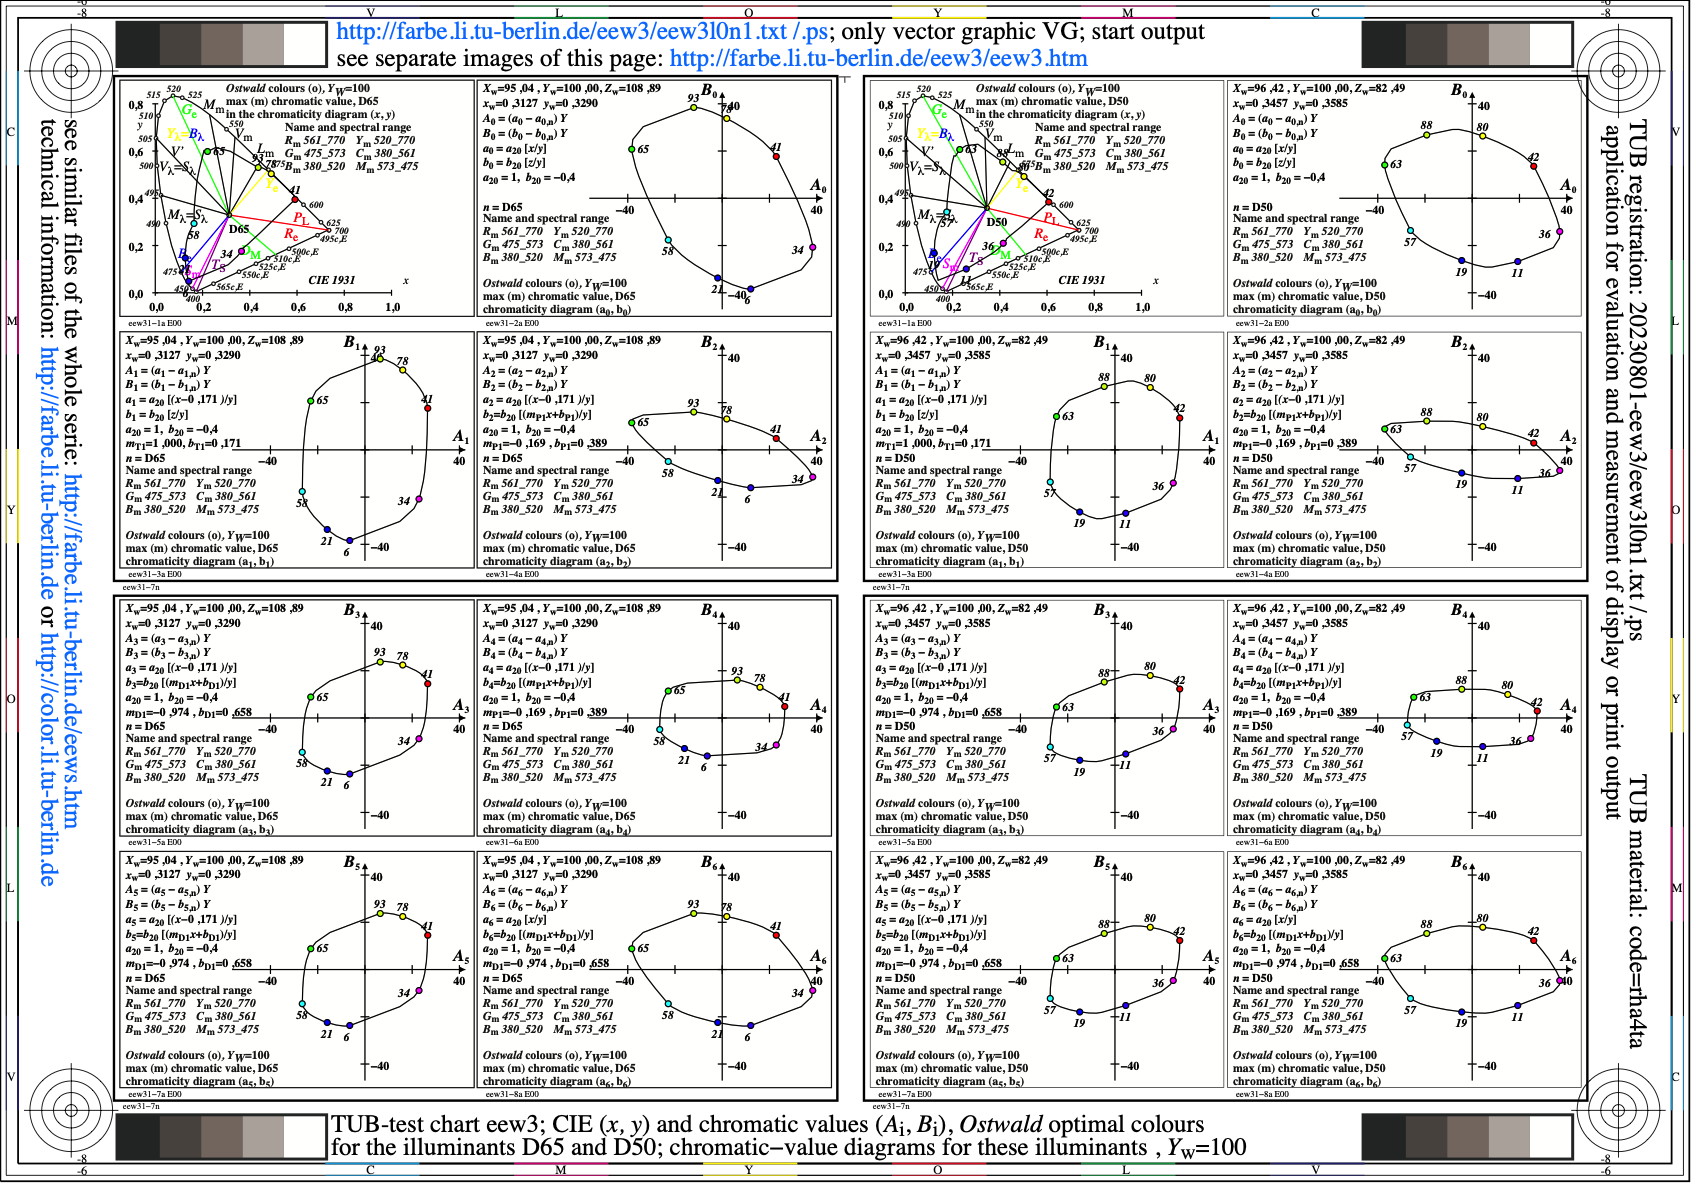
Image eew3l0n1.jpg: Output in format A6 of the file
eew3l0np.pdf, see
eew3l0n1.
PS /
TXT /
PDF /
jpg
eew3: TUB-test chart eew3; Ostwald-optimal colours in
chromaticity (x,y) and chromatic diagram (Ai, Bi)
for the standard illuminants D65 and D50, normalization Yw=100
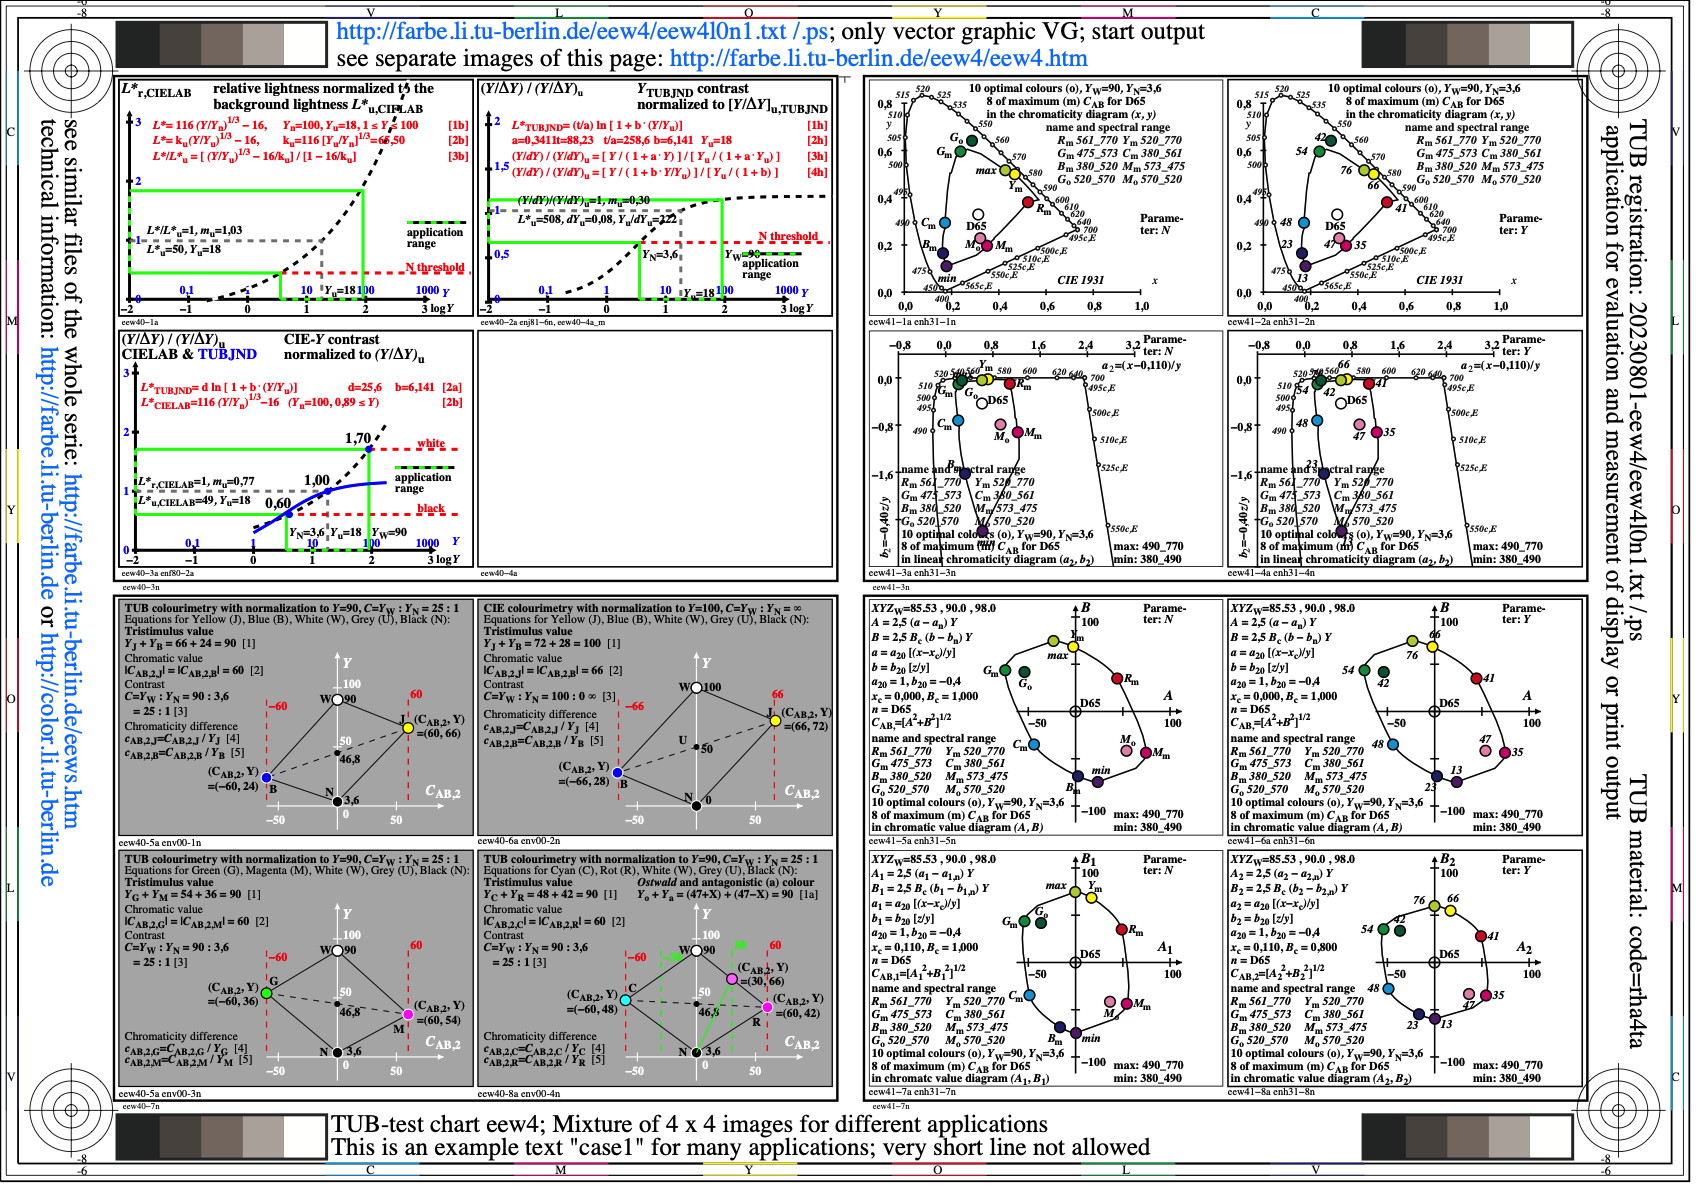
Image eew4l0n1.jpg: Output in format A6 of the file
eew4l0np.pdf, see
eew4l0n1.
PS /
TXT /
PDF /
jpg
eew4: TUB-test chart eew4; Relative lightness L*r and
threshold contrast (Y/dY)r, chromatic values of
complementary hues and of Ostwald-optimal colours
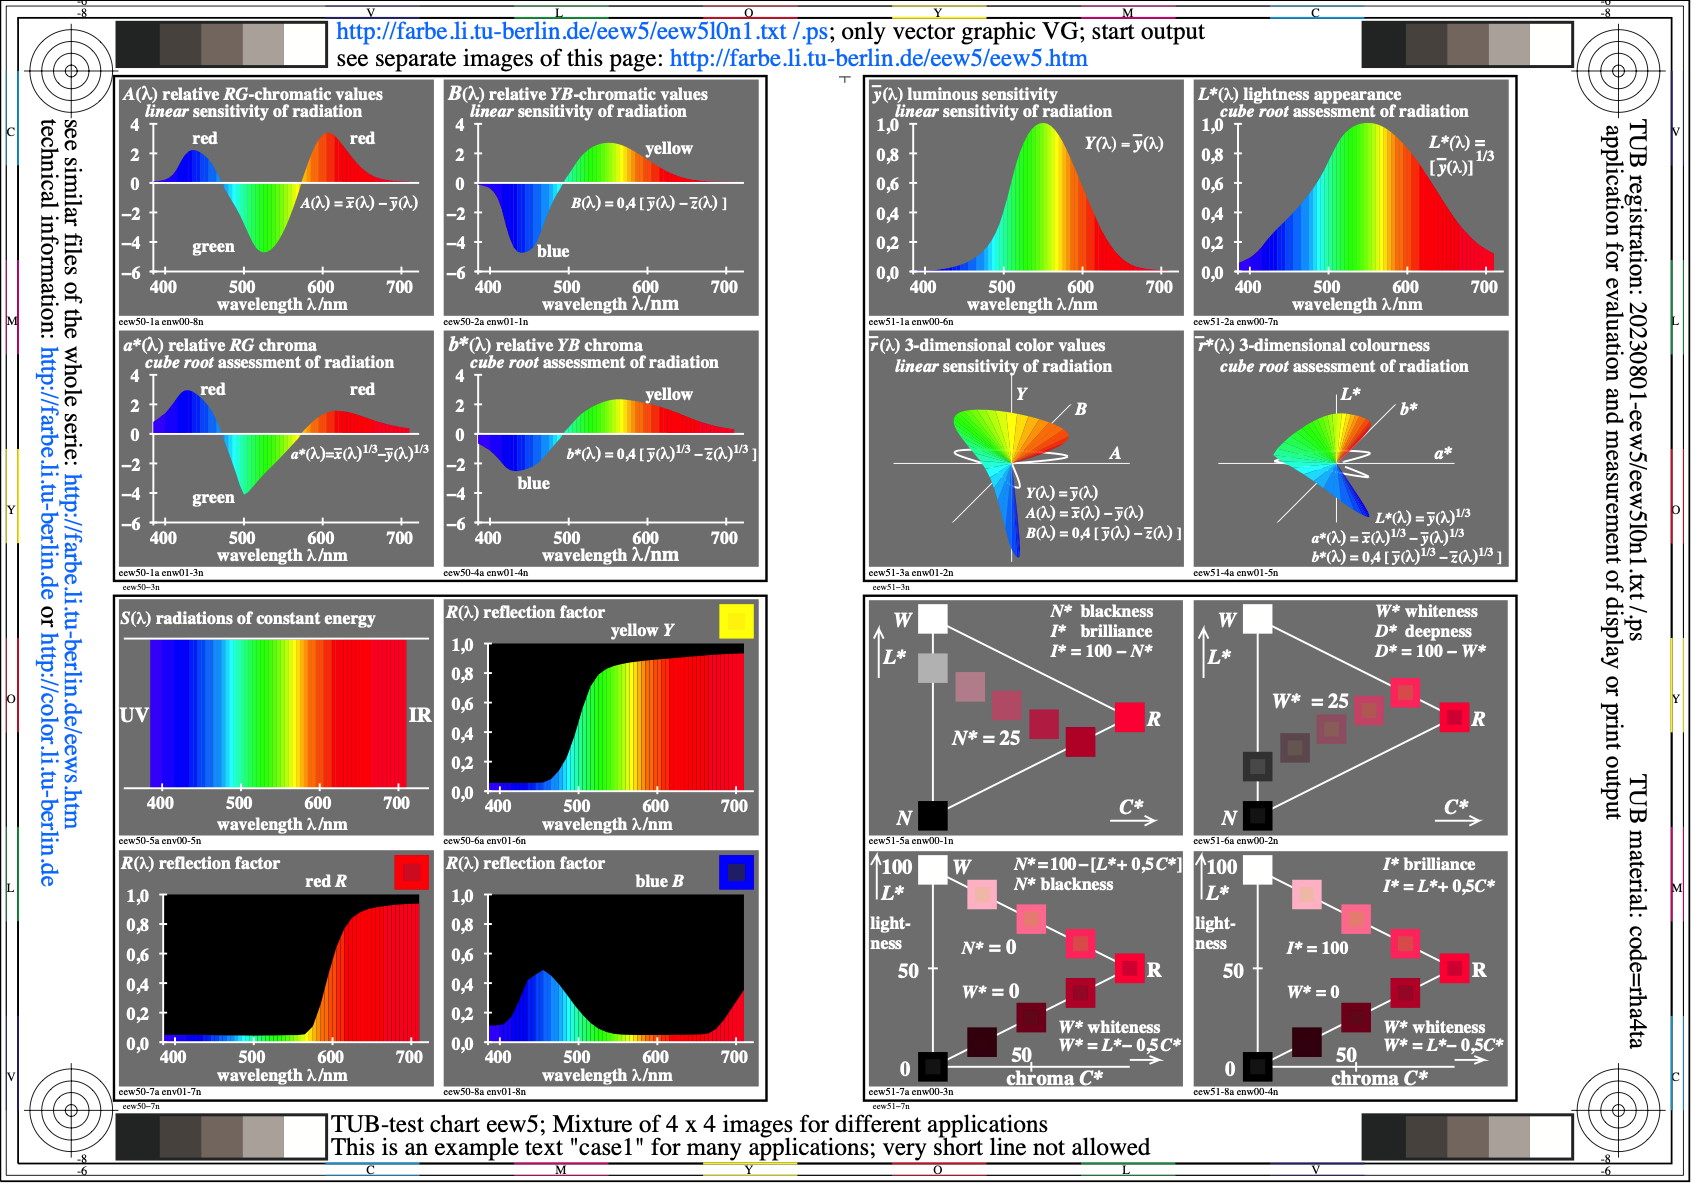
Image eew5l0n1.jpg: Output in format A6 of the file
eew5l0np.pdf, see
eew5l0n1.
PS /
TXT /
PDF /
jpg
eew5: TUB-test chart eew05; Basic properties of colourimetry,
Colour attributes in a hue plane, spectral luminous values,
spectral chroma, spectral reflection of surface colours
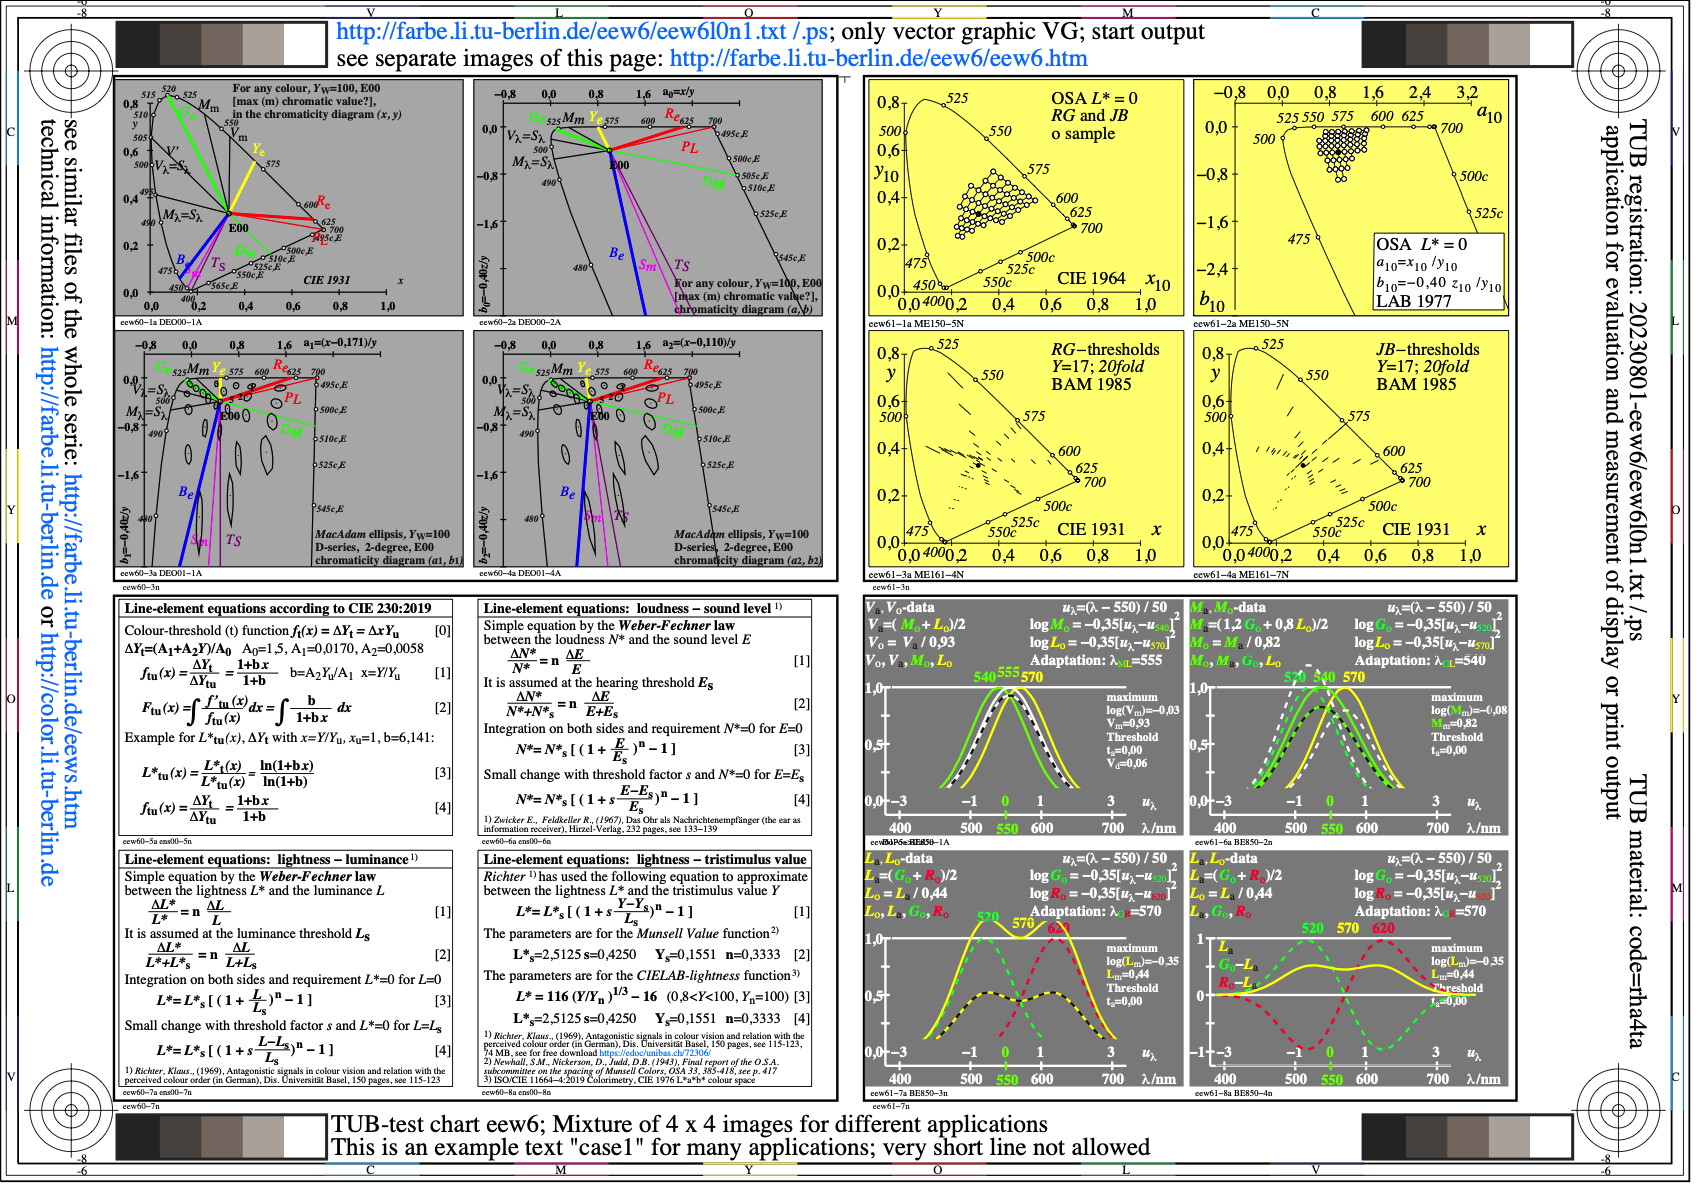
Image eew6l0n1.jpg: Output in format A6 of the file
eew6l0np.pdf, see
eew6l0n1.
PS /
TXT /
PDF /
jpg
eew6: TUB-test chart eew6; dominant wavelength of colour-vision
deficencies LMS (PDT), elementary colous (e)
line elements, OSA system and BAM-colour thresholds
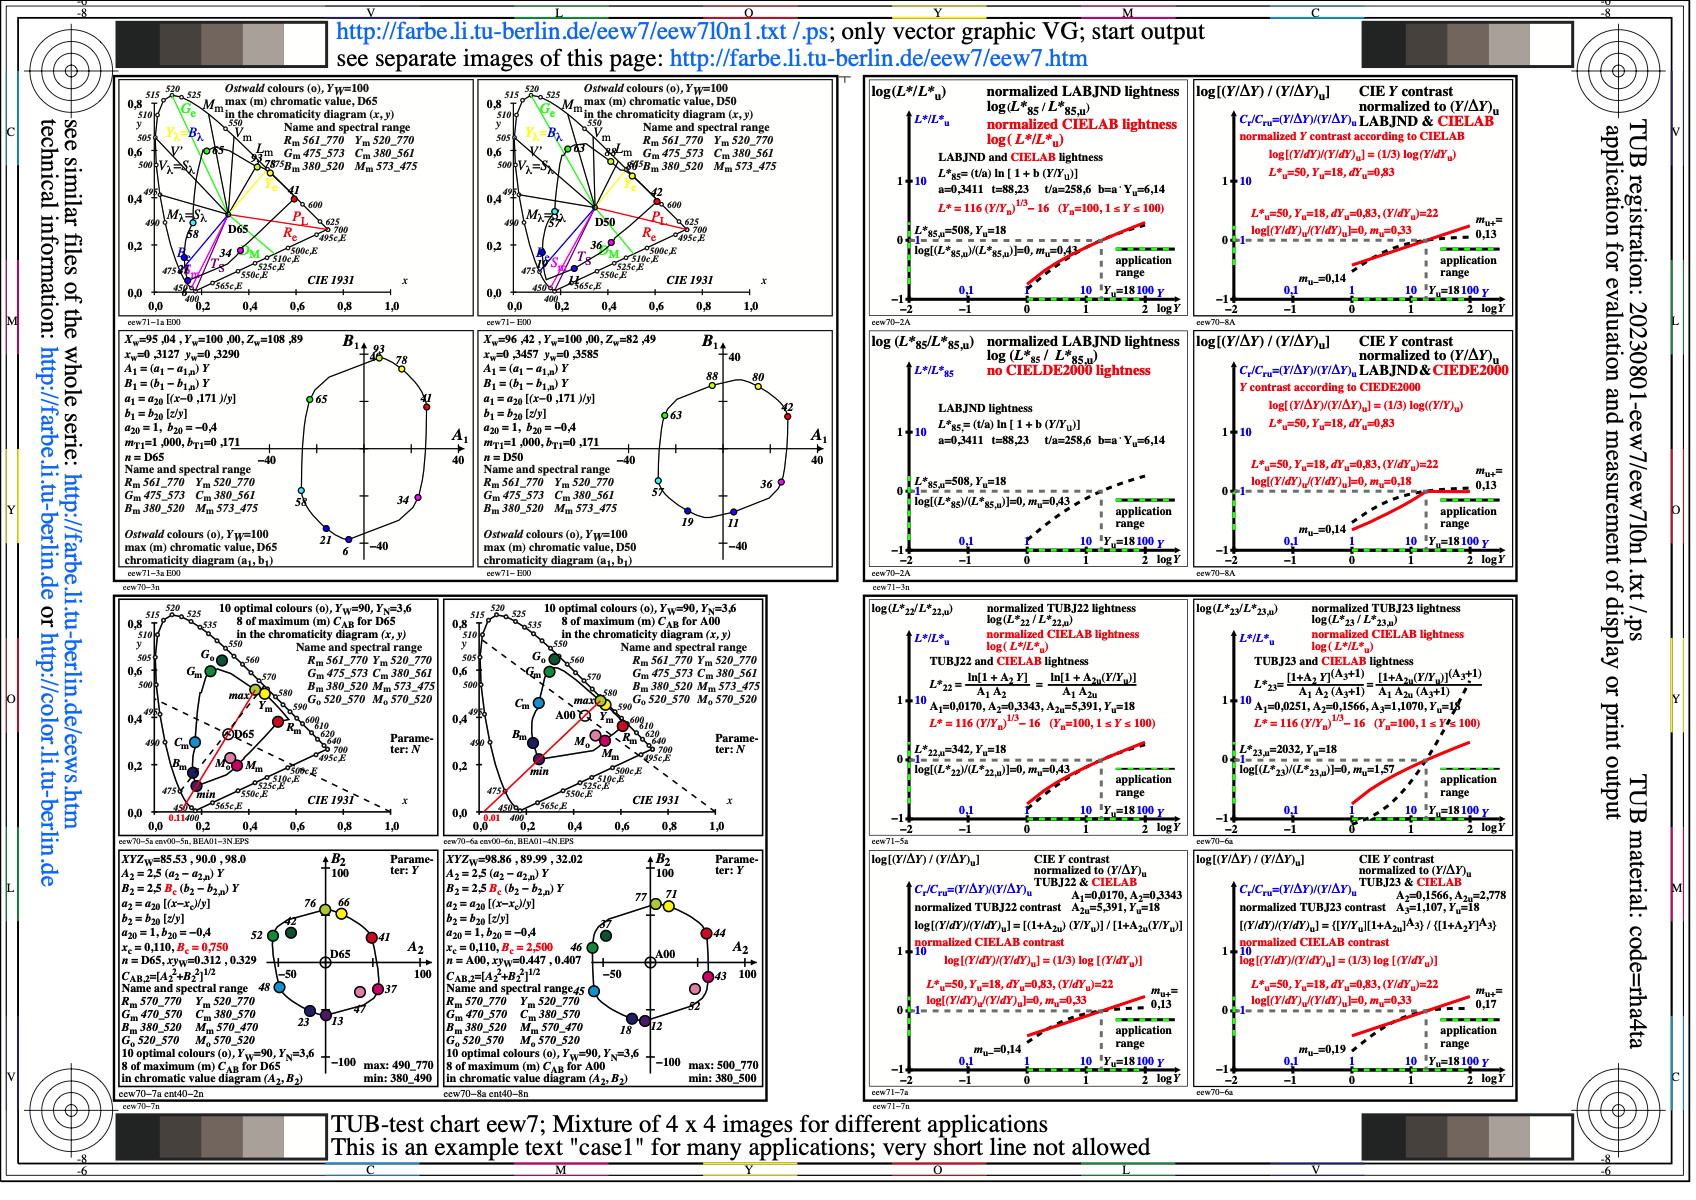
Image eew7l0n1.jpg: Output in format A6 of the file
eew7l0np.pdf, see
eew7l0n1.
PS /
TXT /
PDF /
jpg
eew7: TUB-test chart eew7; Tristimulus values Ymax and Ymin
for Ostwald colours in colour diagrams (Ai, Bi),
relative lightness L*r and relative contrast Cr
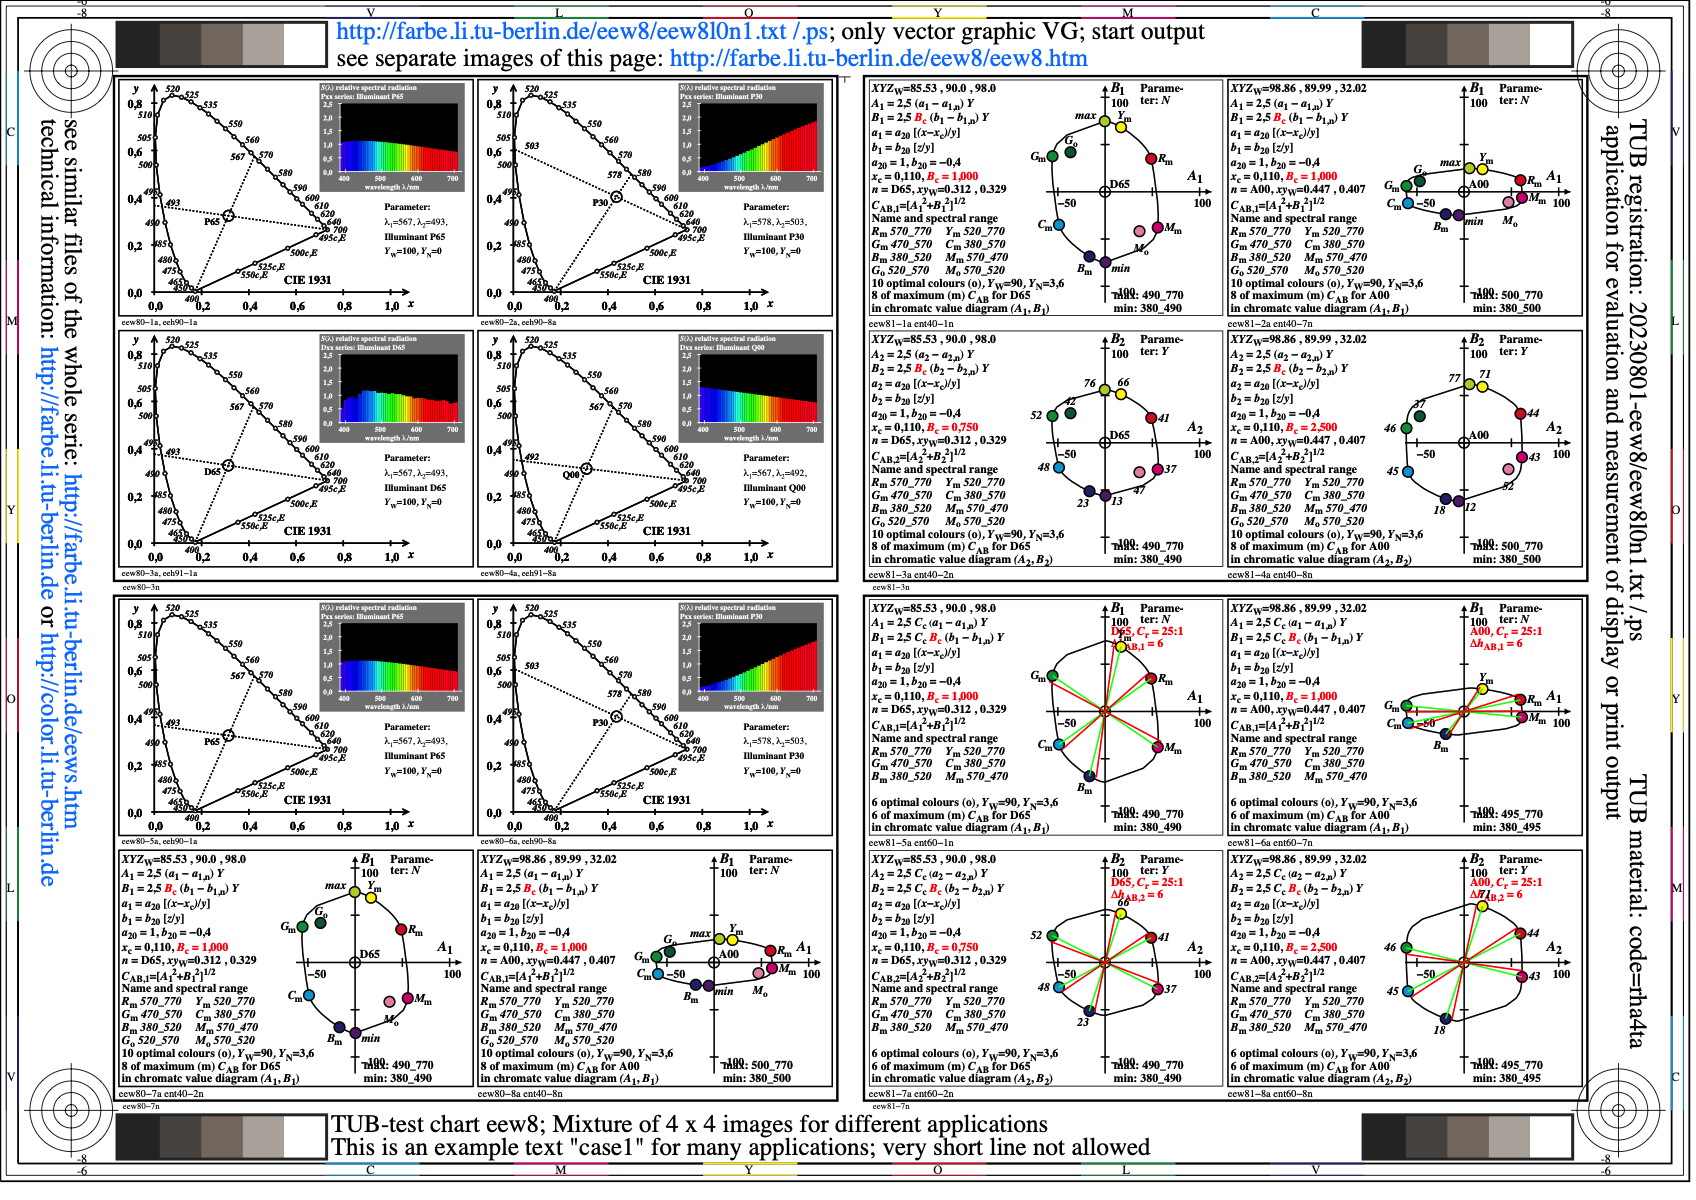
Image eew8l0n1.jpg: Output in format A6 of the file
eew8l0np.pdf, see
eew8l0n1.
PS /
TXT /
PDF /
jpg
eew8: TUB-test chart eew8; complementary wavelength
for illuminants P65, P30, D65, Q00 in chromaticity and
chromatic diagrams (Ai, Bi), normalization Yw=90
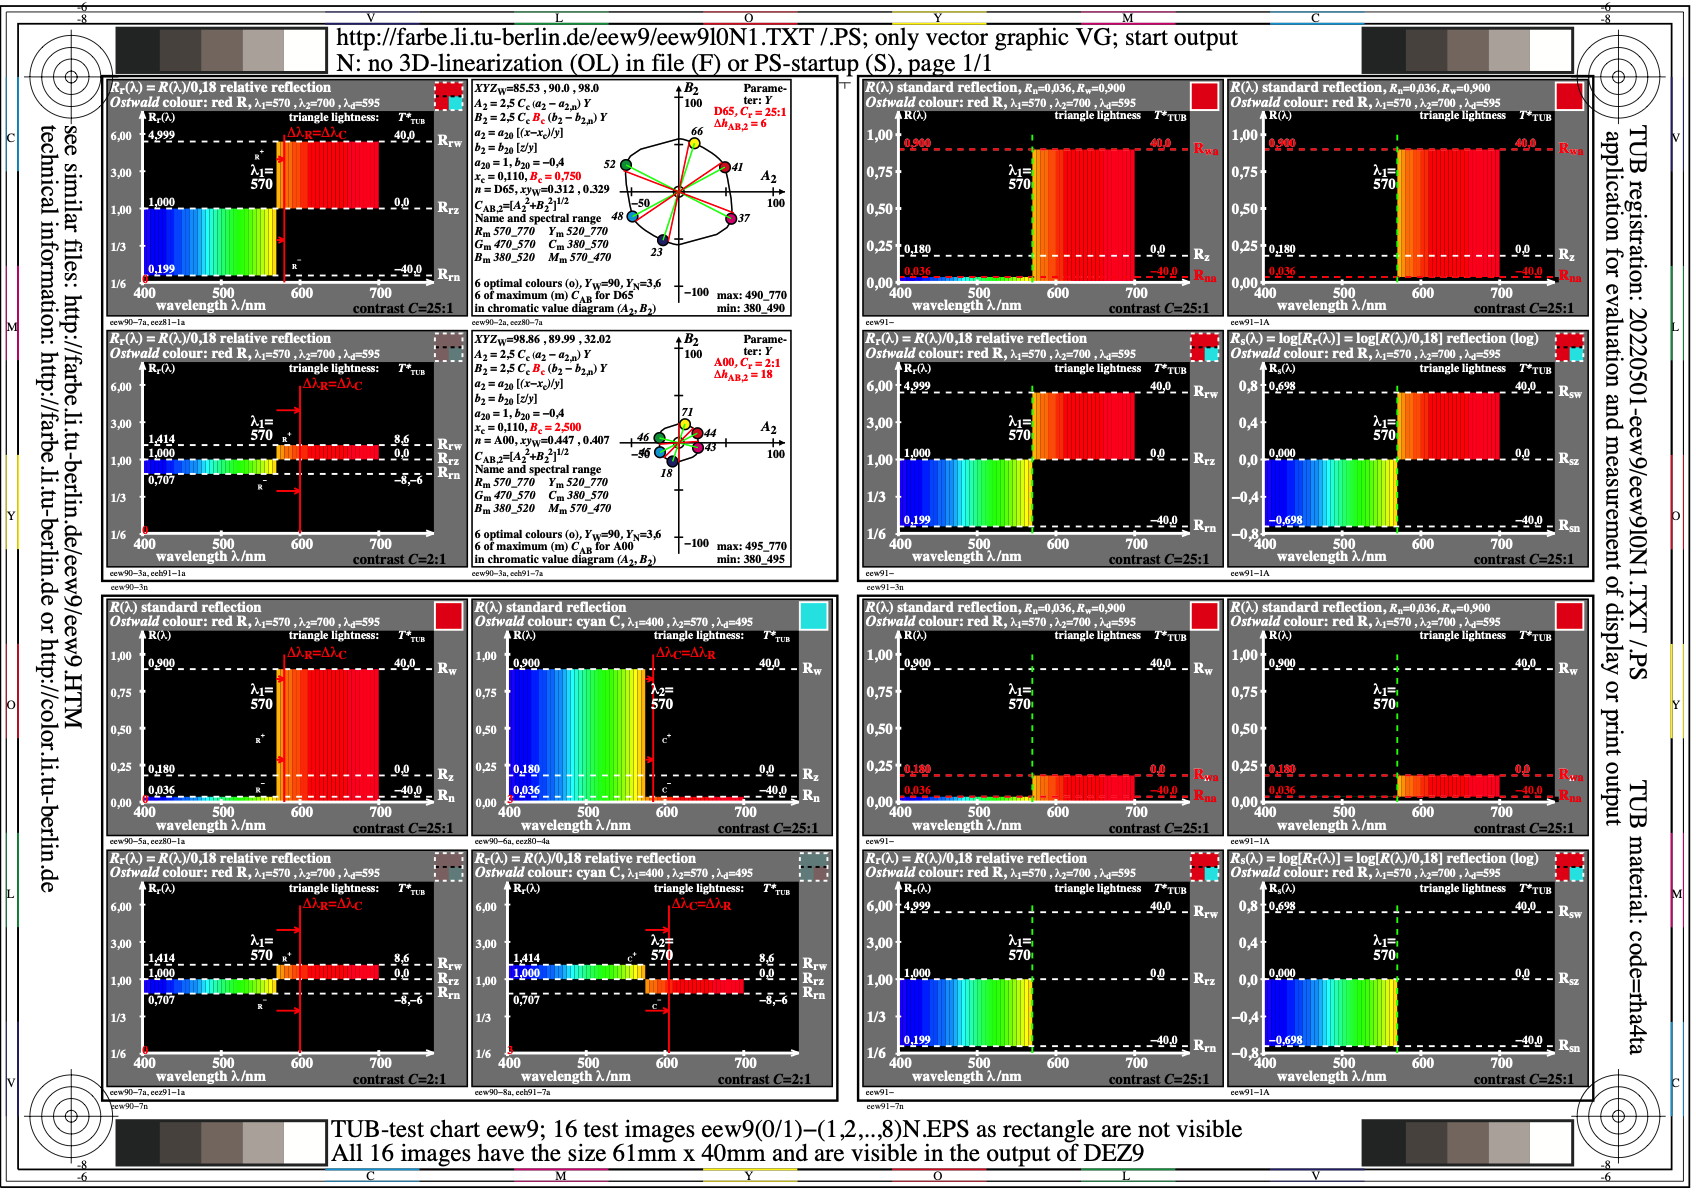
Image eew9l0n1.jpg: Output in format A6 of the file
eew9l0np.pdf, see
eew9l0n1.
PS /
TXT /
PDF /
jpg
eew9: TUB-test chart eew9; Relative reflection Rr=R/0,18
of complementary Ostwald-optimal colours red and cyan,
equal chromatic values and hue discrimination for 2 contrasts
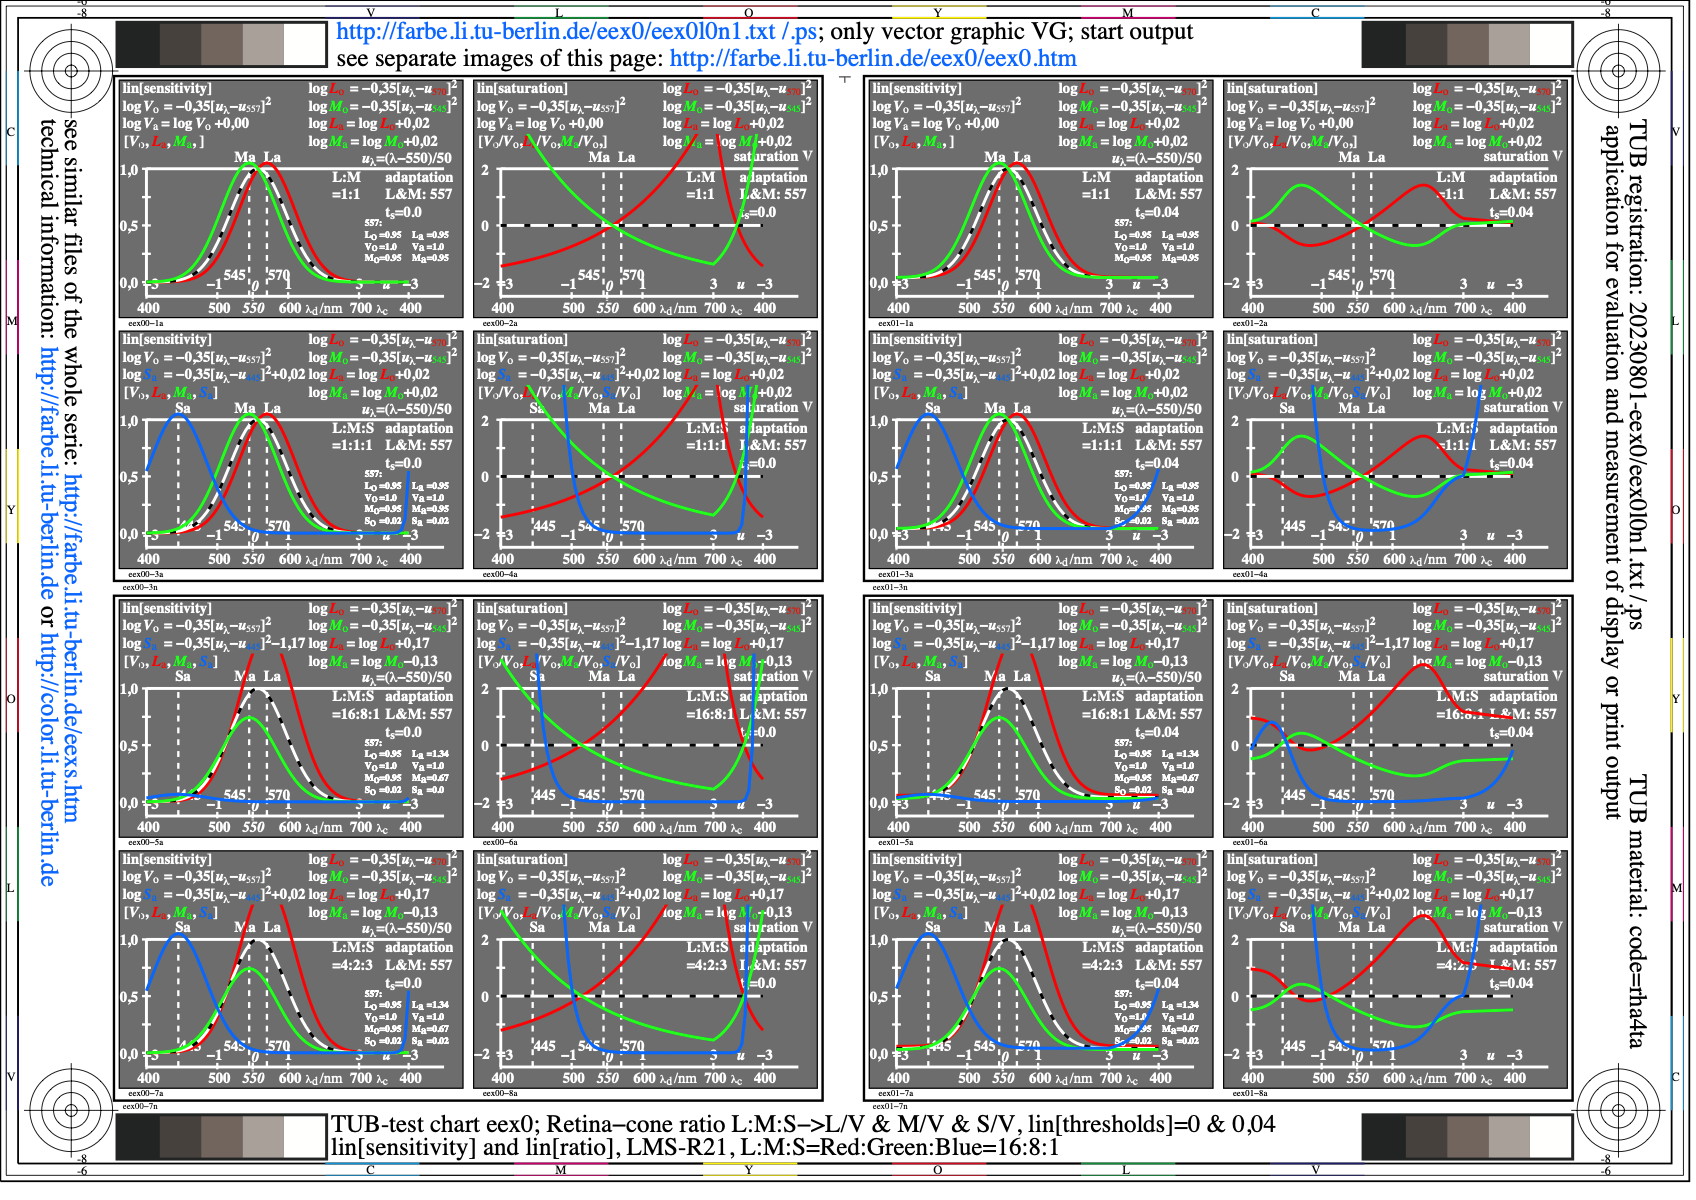
Image eex0l0n1.jpg: Output in format A6 of the file
eex0l0np.pdf, see
eex0l0n1.
PS /
TXT /
PDF /
jpg
eex0: TUB-test chart eex0; TUB-LMS colour vision model
cone ratio L:M:S=red:green:blue=16:8:1
lin[sensitivities], lin[ratios], lin[thresholds]=0&0,04
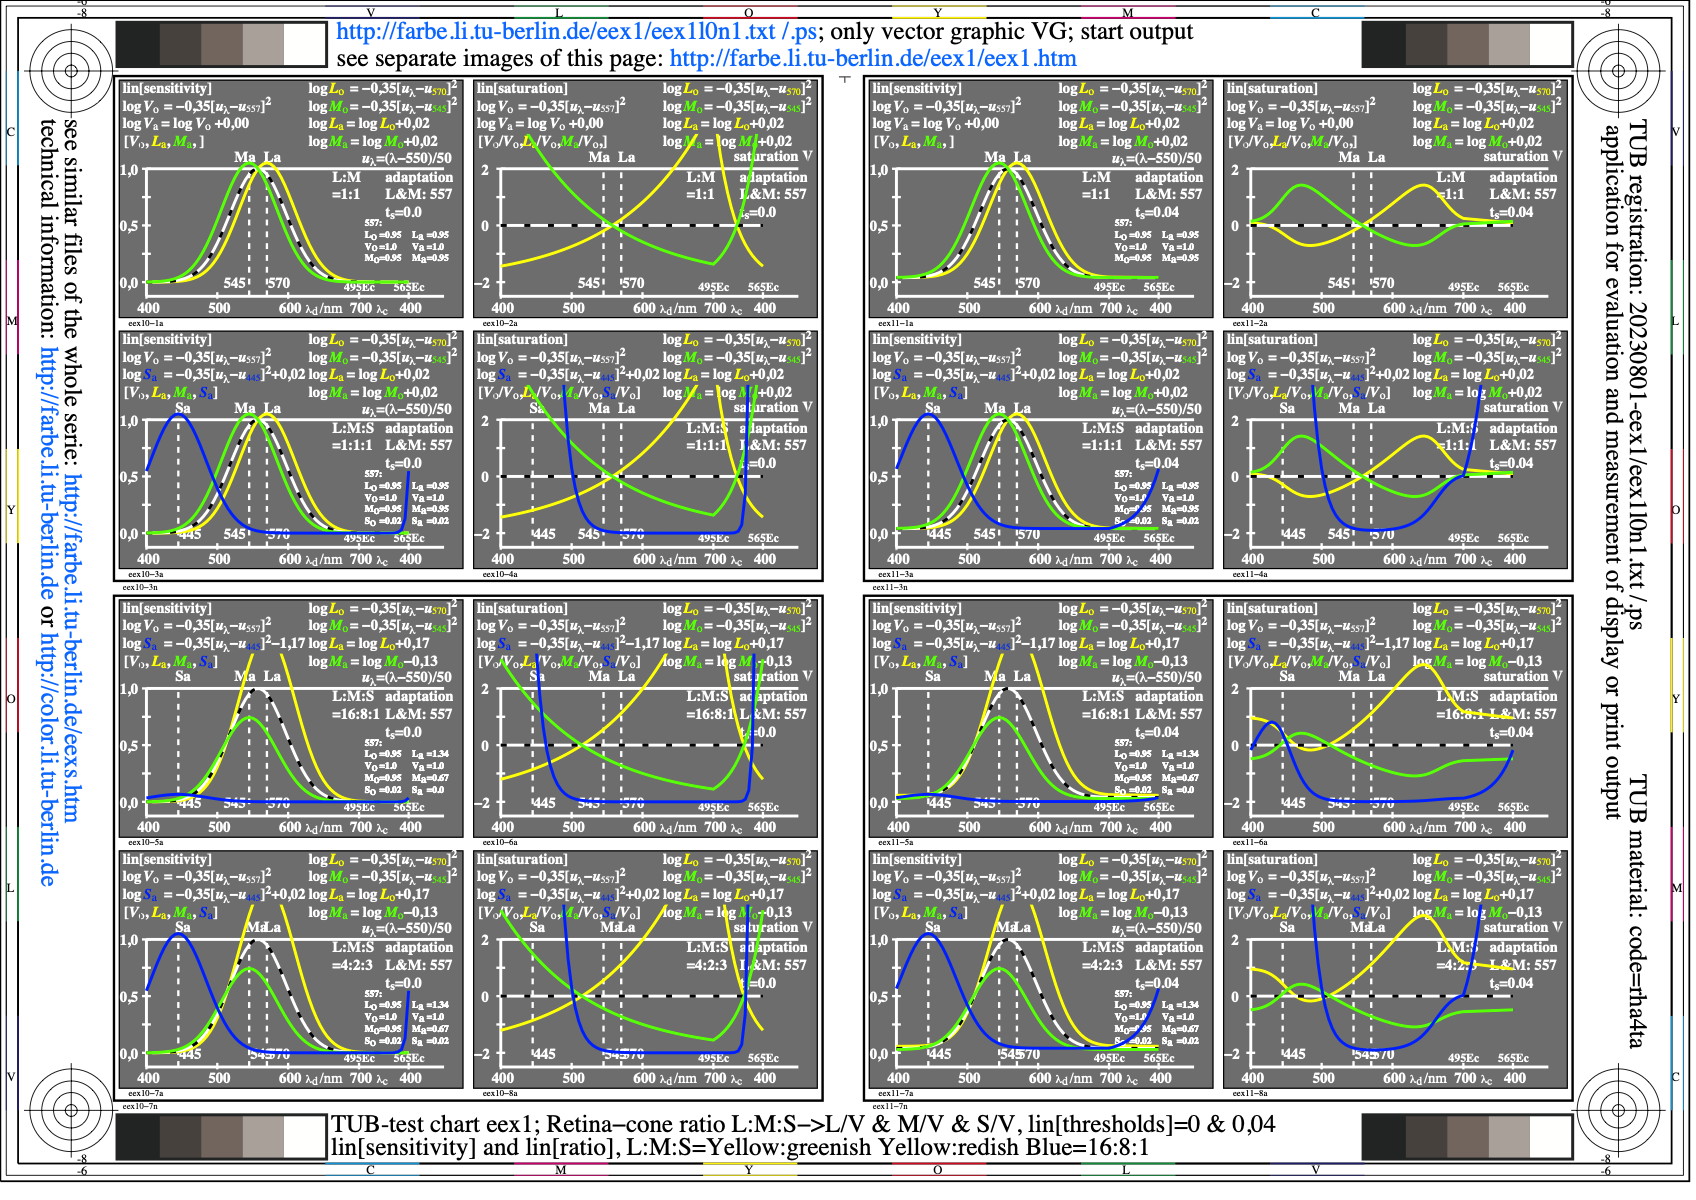
Image eex1l0n1.jpg: Output in format A6 of the file
eex1l0np.pdf, see
eex1l0n1.
PS /
TXT /
PDF /
jpg
eex1: TUB-test chart eex1; TUB-LMS colour vision model
ratio L:M:S=yellow:greenish yellow:redish blue=16:8:1
lin[sensitivities], lin[ratios], lin[thresholds]=0&0,04
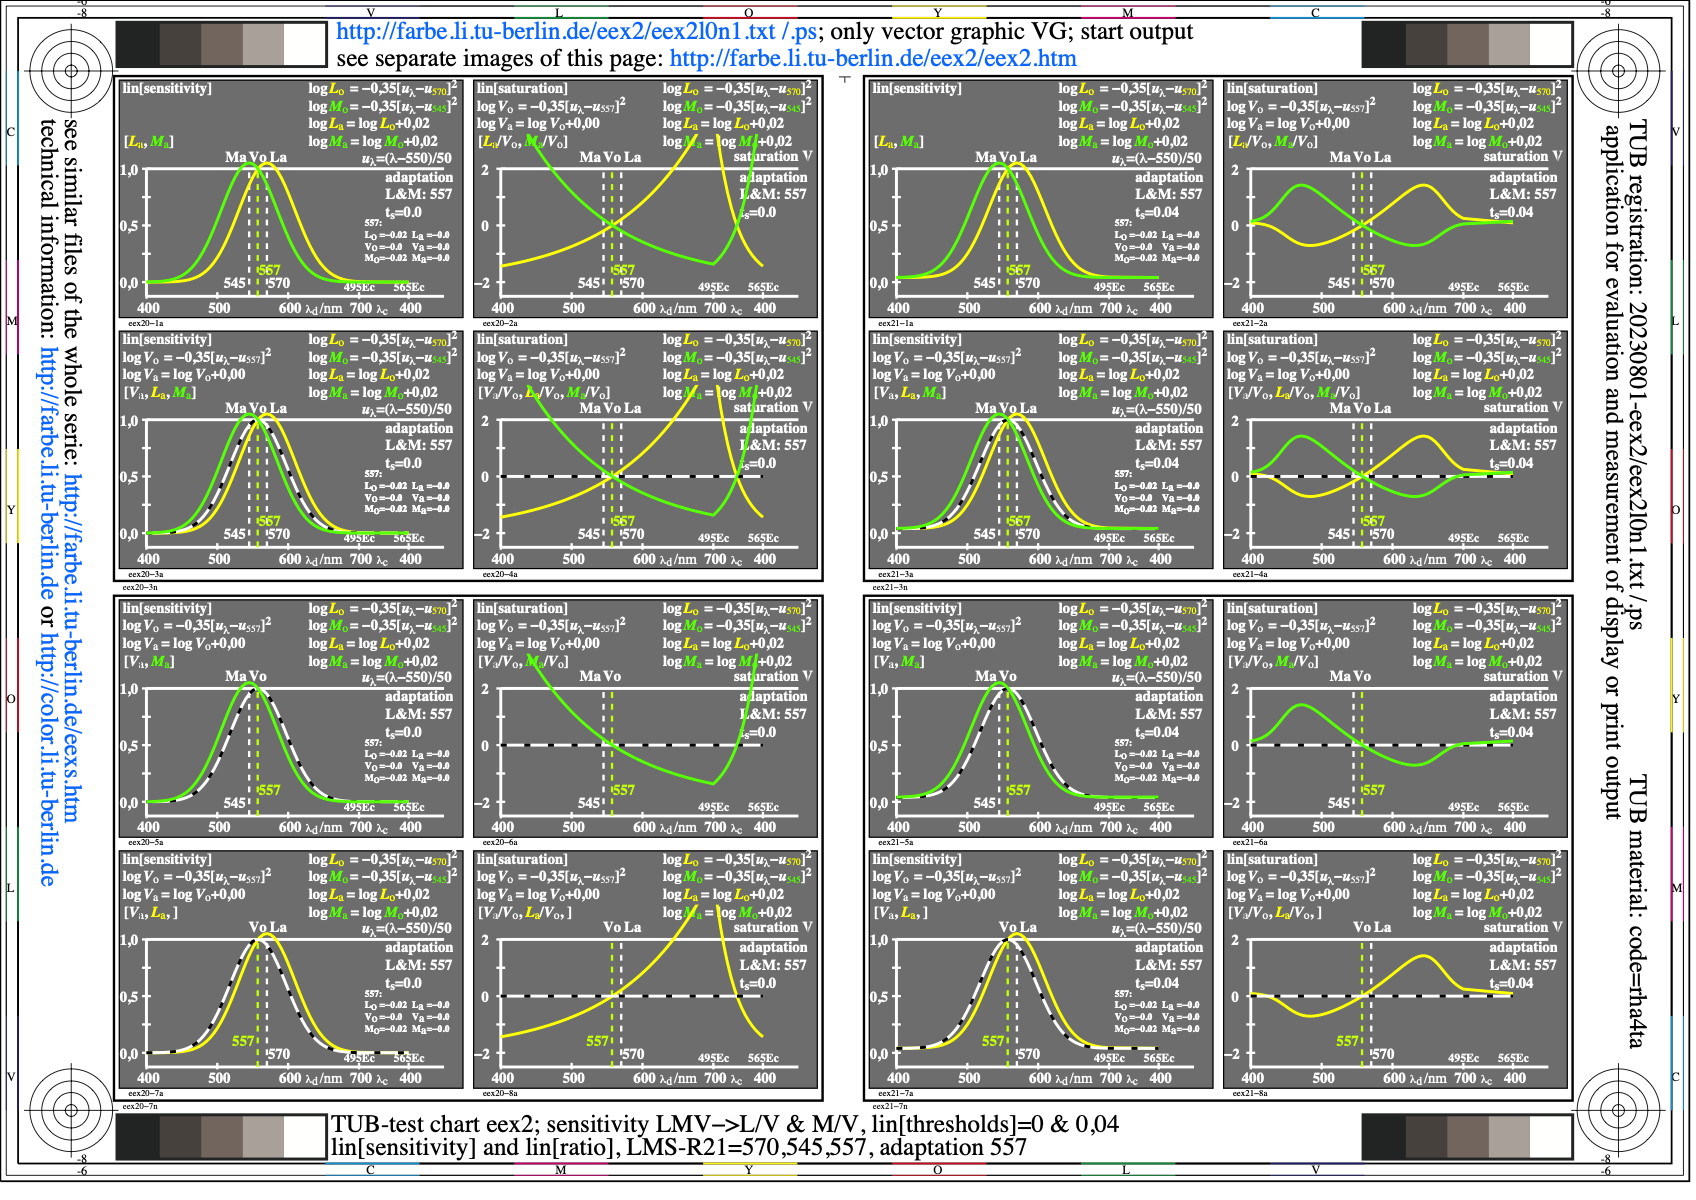
Image eex2l0n1.jpg: Output in format A6 of the file
eex2l0np.pdf, see
eex2l0n1.
PS /
TXT /
PDF /
jpg
eex2: TUB-test chart eex2; TUB-LMS colour vision model
adaptation of the sensitivities 570,557,545, LVM->(LVM)/V
lin[sensitivities], lin[ratios], lin[thresholds]=0&0,04

Image eex3l0n1.jpg: Output in format A6 of the file
eex3l0np.pdf, see
eex3l0n1.
PS /
TXT /
PDF /
jpg
eex3: TUB-test chart eex3; TUB-LMS colour vision model
adaptation of the sensitivities 595,570,545, OLM->(OLM)/L
lin[sensitivities], lin[ratios], lin[thresholds]=0&0,04
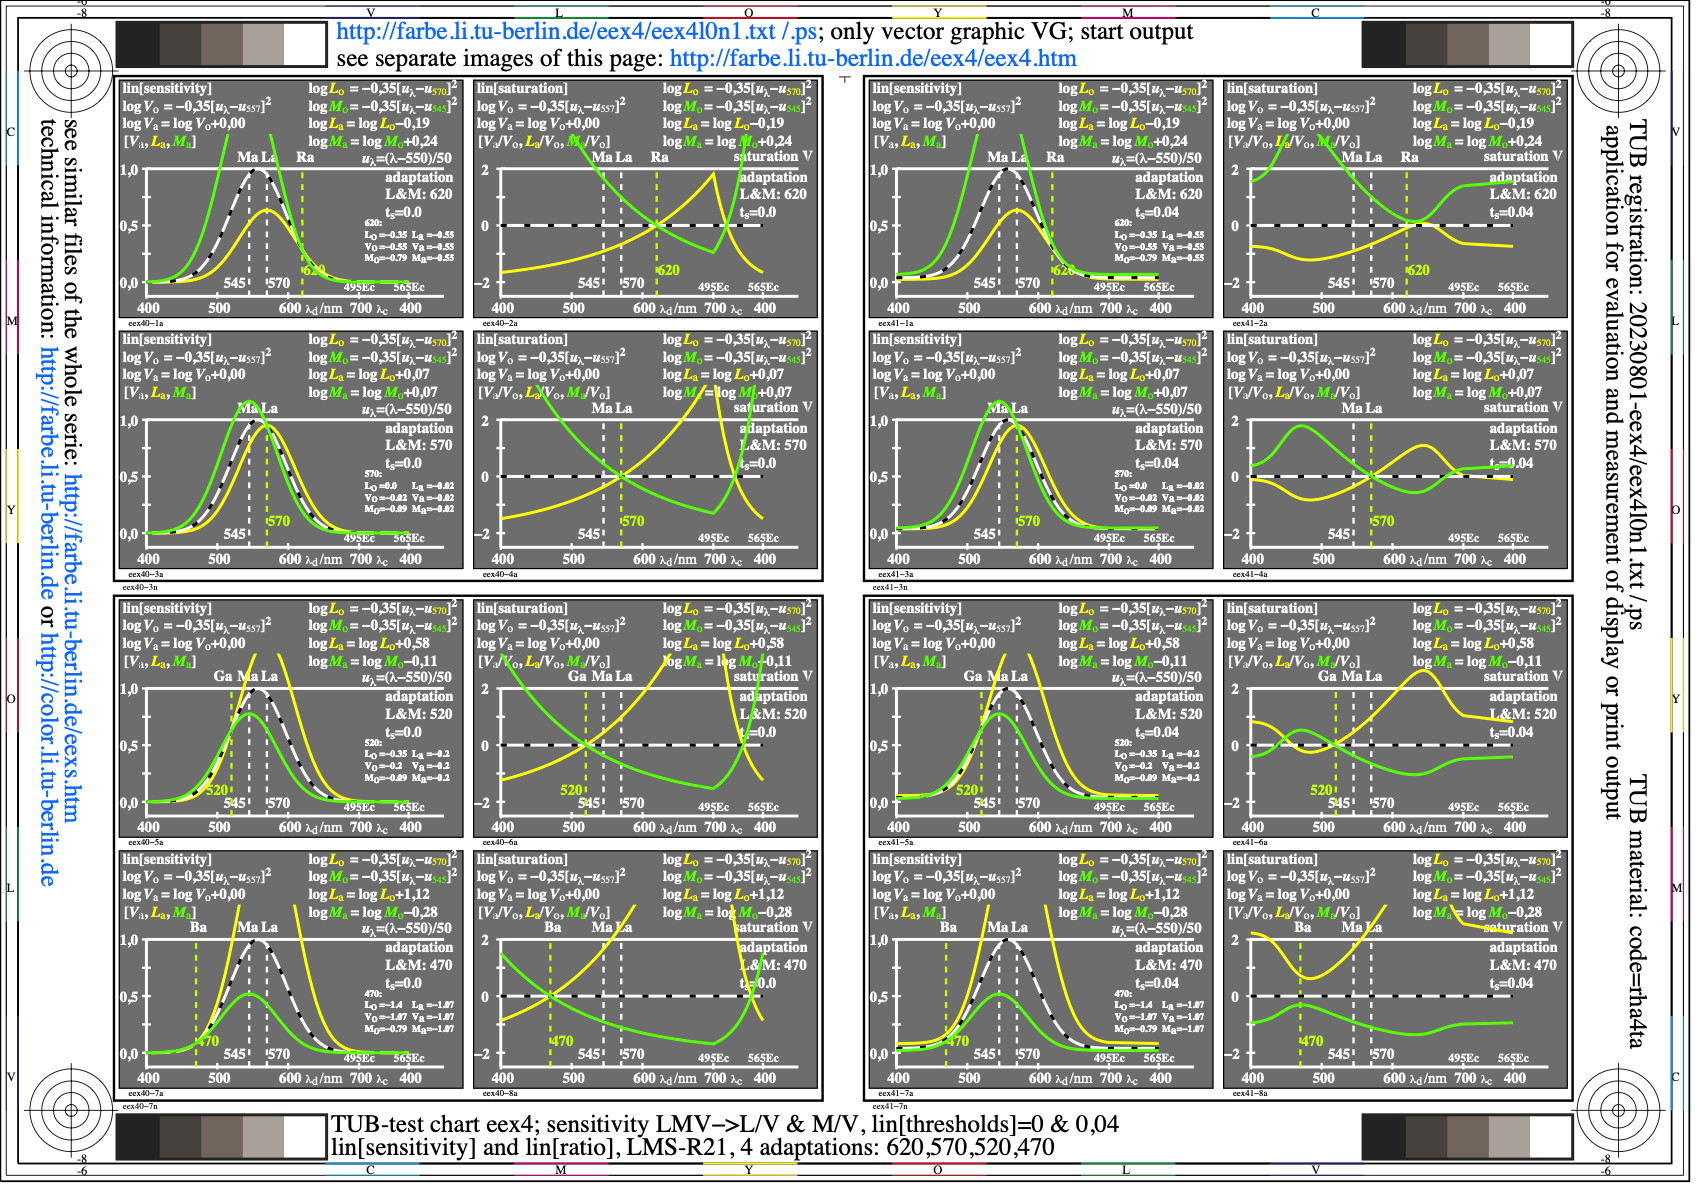
Image eex4l0n1.jpg: Output in format A6 of the file
eex4l0np.pdf, see
eex4l0n1.
PS /
TXT /
PDF /
jpg
eex4: TUB-test chart eex4; TUB-LMS colour vision model
4 adaptations of 620,570,520,470, LVM->(LVM)/V
lin[sensitivities], lin[ratios], lin[thresholds]=0&0,04
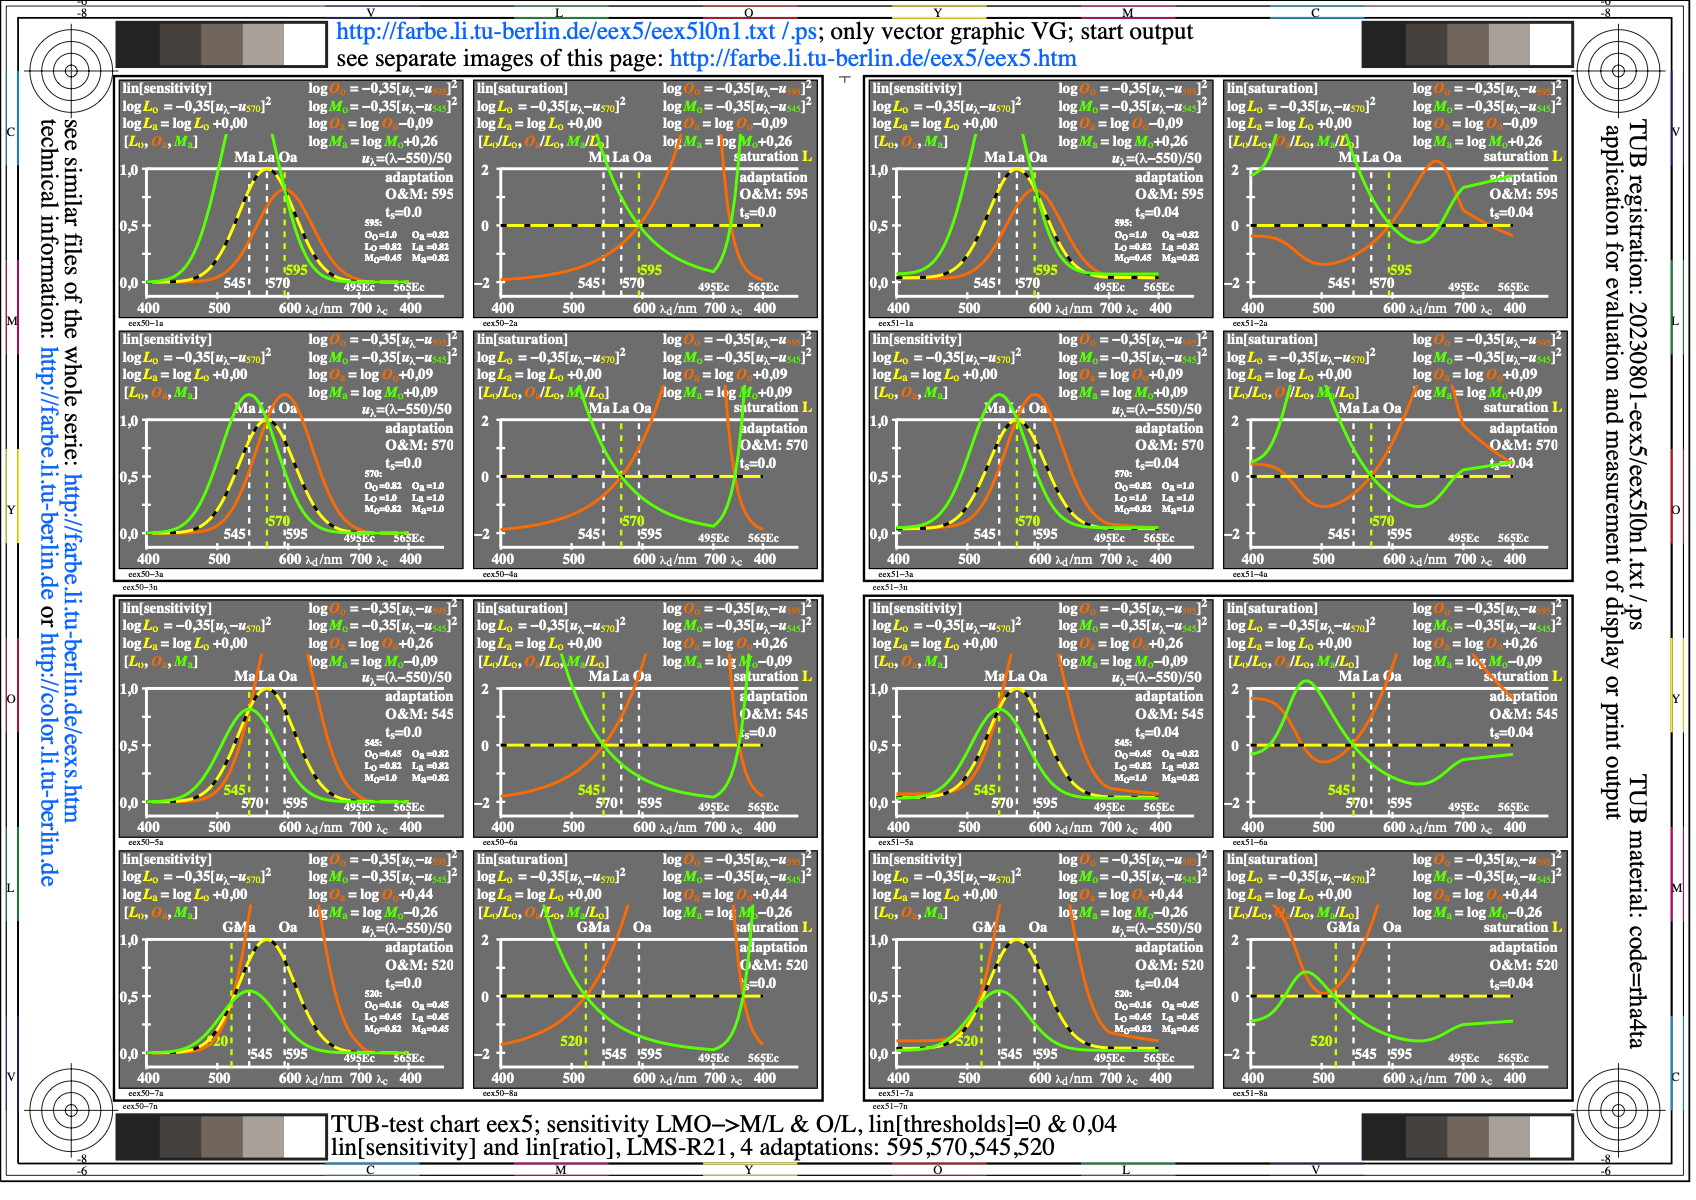
Image eex5l0n1.jpg: Output in format A6 of the file
eex5l0np.pdf, see
eex5l0n1.
PS /
TXT /
PDF /
jpg
eex5: TUB-test chart eex5; TUB-LMS colour vision model
4 adaptations of 620,570,520,470, OLM->(OLM)/L
lin[sensitivities], lin[ratios], lin[thresholds]=0&0,04

Image eex6l0n1.jpg: Output in format A6 of the file
eex6l0np.pdf, see
eex6l0n1.
PS /
TXT /
PDF /
jpg
eex6: TUB-test chart eex6; TUB-LMS colour vision model
4 adaptations of 620,570,520,470, OLM->(OLM)/L
lin[sensitivities], lin[ratios], lin[thresholds]=0&0,04

Image eex7l0n1.jpg: Output in format A6 of the file
eex7l0np.pdf, see
eex7l0n1.
PS /
TXT /
PDF /
jpg
eex7: TUB-test chart eex7; TUB-LMS colour vision model
4 adaptations of 595,570,545,520, OLM->(OLM)/L
lin[sensitivities], lin[ratios], lin[thresholds]=0&0,04
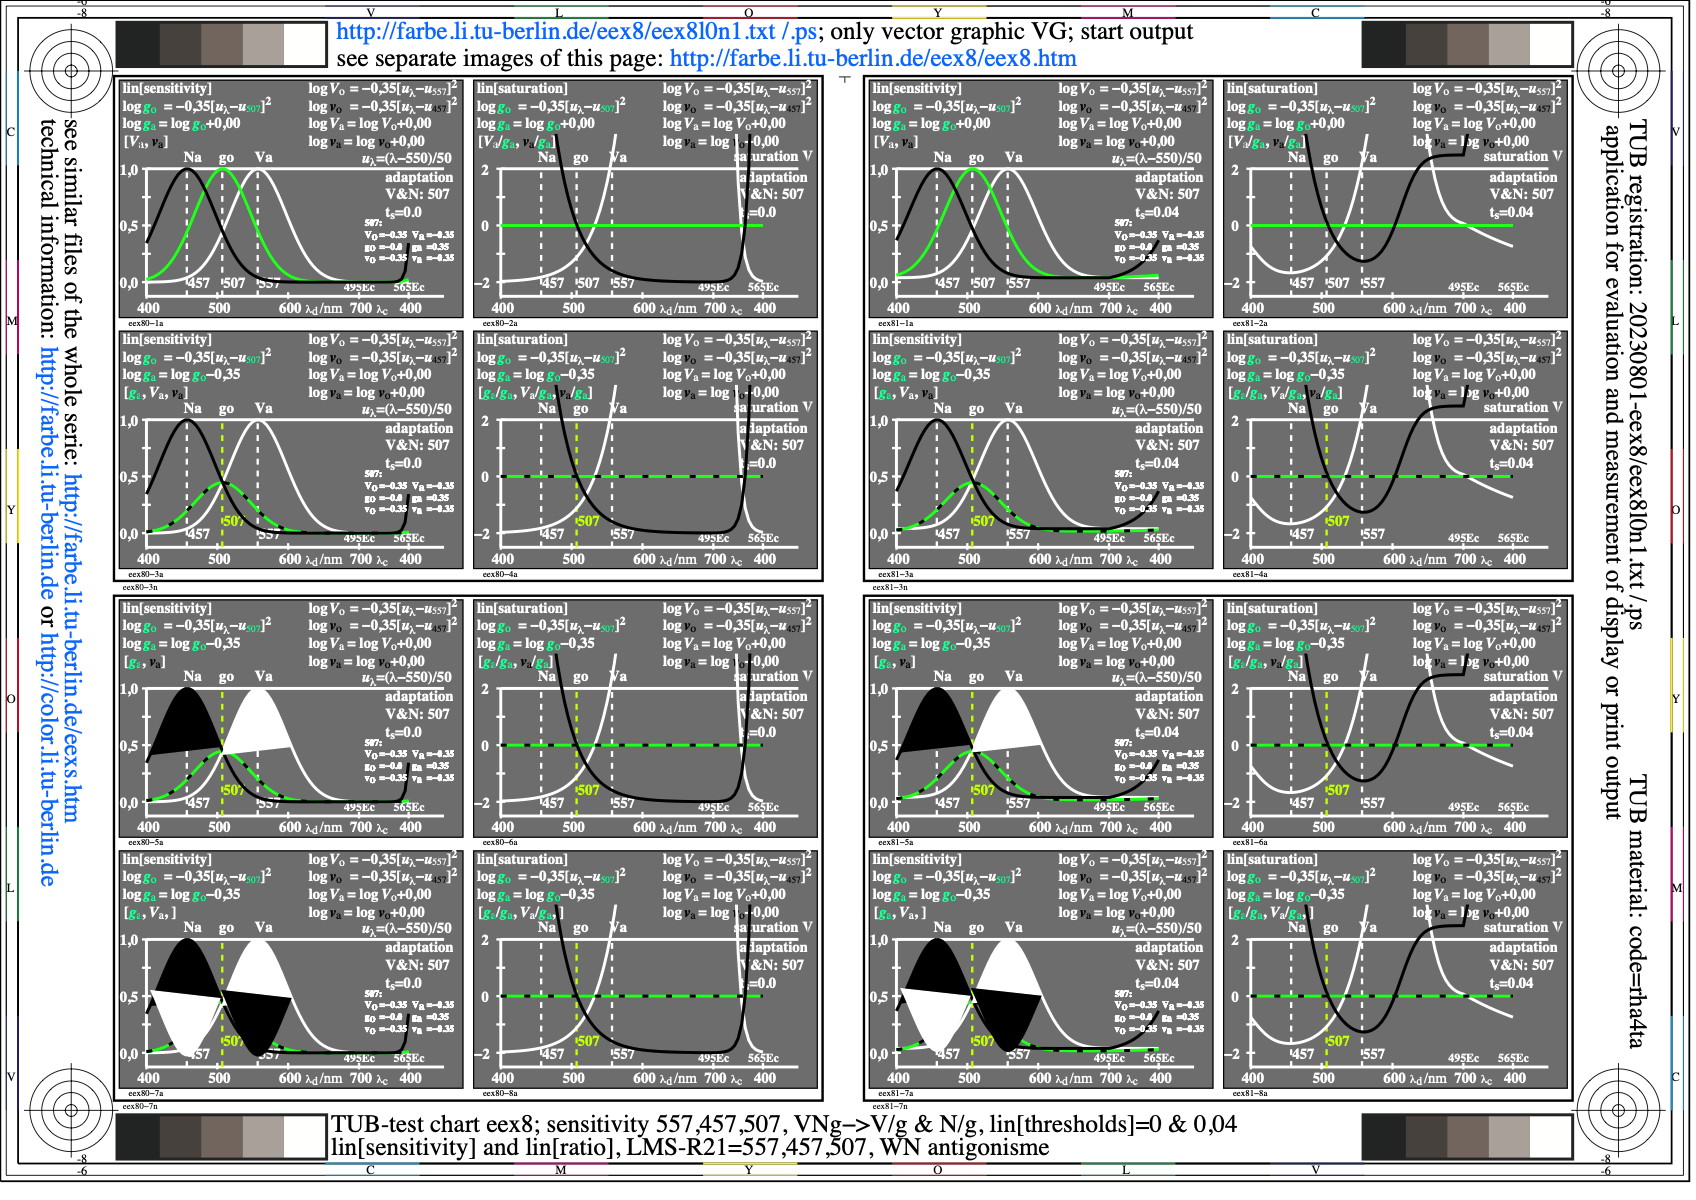
Image eex8l0n1.jpg: Output in format A6 of the file
eex8l0np.pdf, see
eex8l0n1.
PS /
TXT /
PDF /
jpg
eex8: TUB-test chart eex8; TUB-LMS colour vision model
WN antagonisme of sensitivities 547,457, V,N->V/g,N/g
lin[sensitivities], lin[ratios], lin[thresholds]=0&0,04
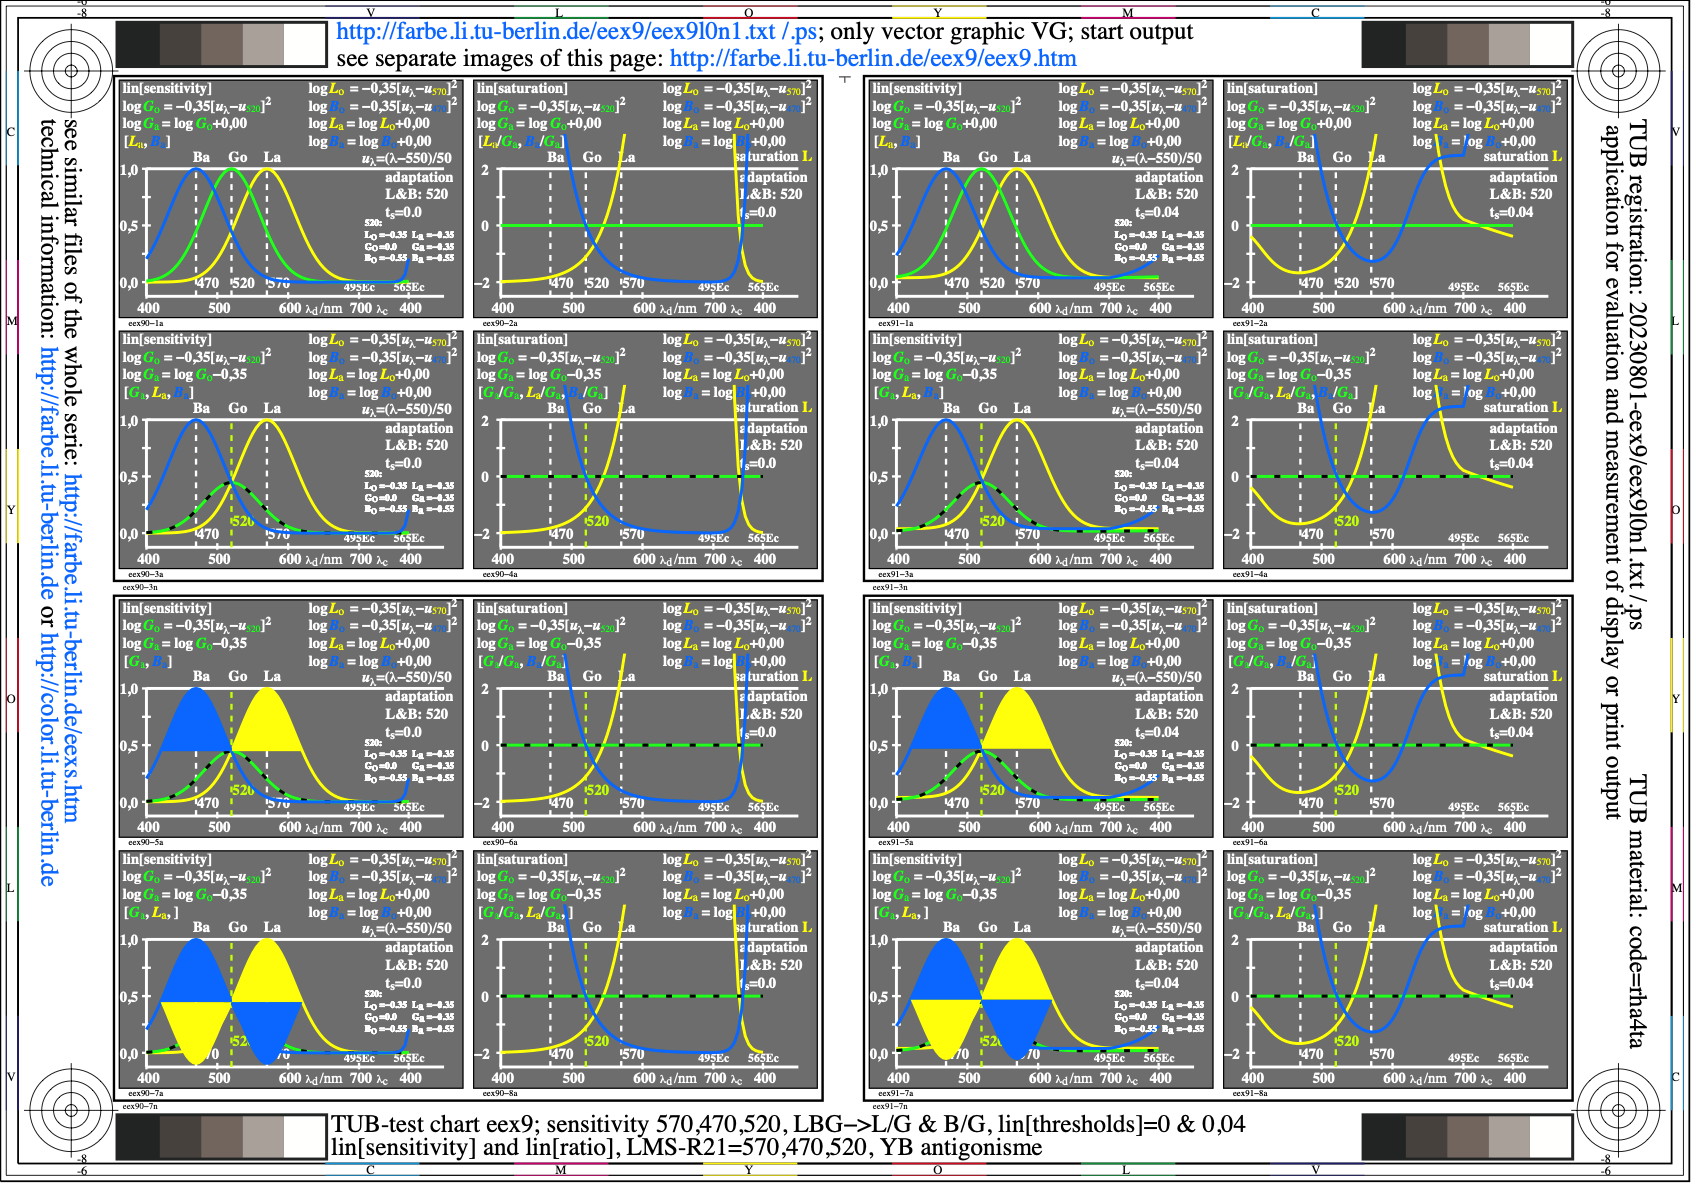
Image eex9l0n1.jpg: Output in format A6 of the file
eex9l0np.pdf, see
eex9l0n1.
PS /
TXT /
PDF /
jpg
eex9: TUB-test chart eex9; TUB-LMS colour vision model
YB antagonisme of sensitivities 570,470, Y,B->J/G,B/G
lin[sensitivities], lin[ratios], lin[thresholds]=0&0,04
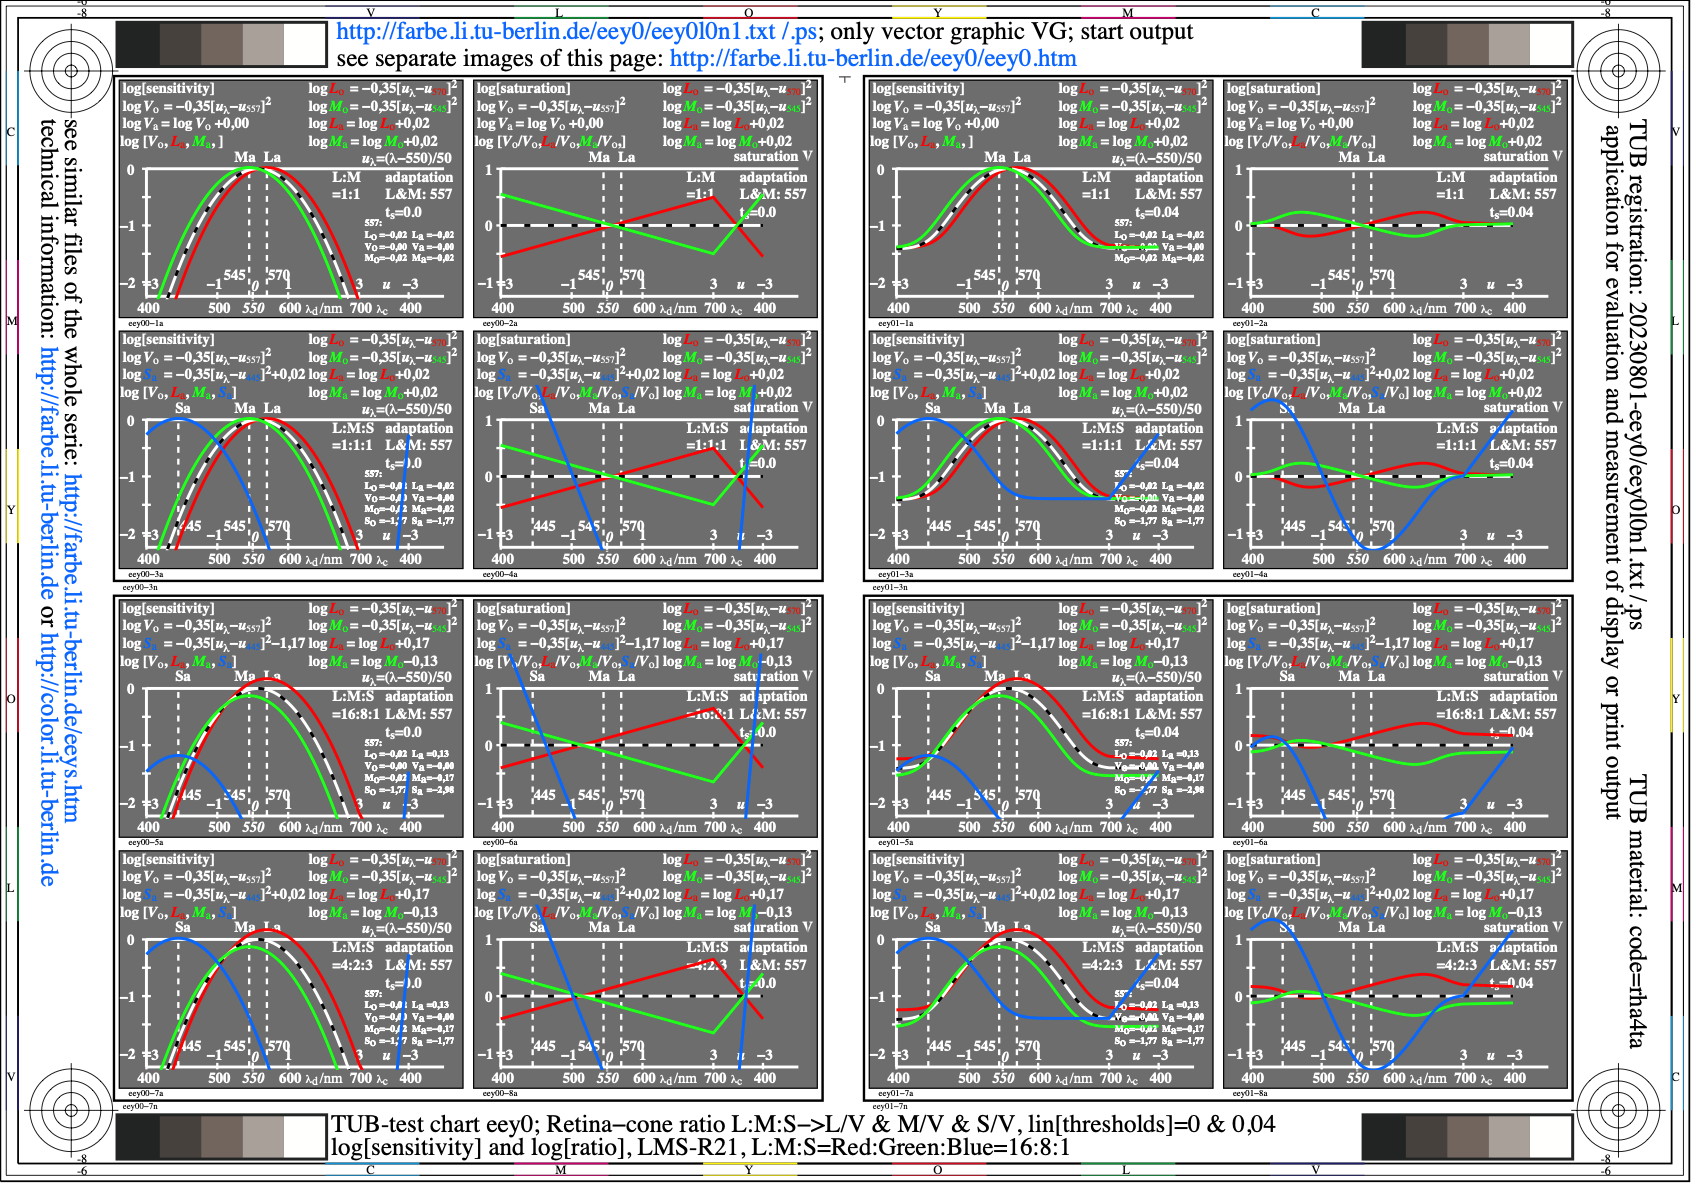
Image eey0l0n1.jpg: Output in format A6 of the file
eey0l0np.pdf, see
eey0l0n1.
PS /
TXT /
PDF /
jpg
eey0: TUB-test chart eey0; TUB-LMS colour vision model
cone ratio L:M:S=red:green:blue=16:8:1
log[sensitivities], log[ratios], lin[thresholds]=0&0,04
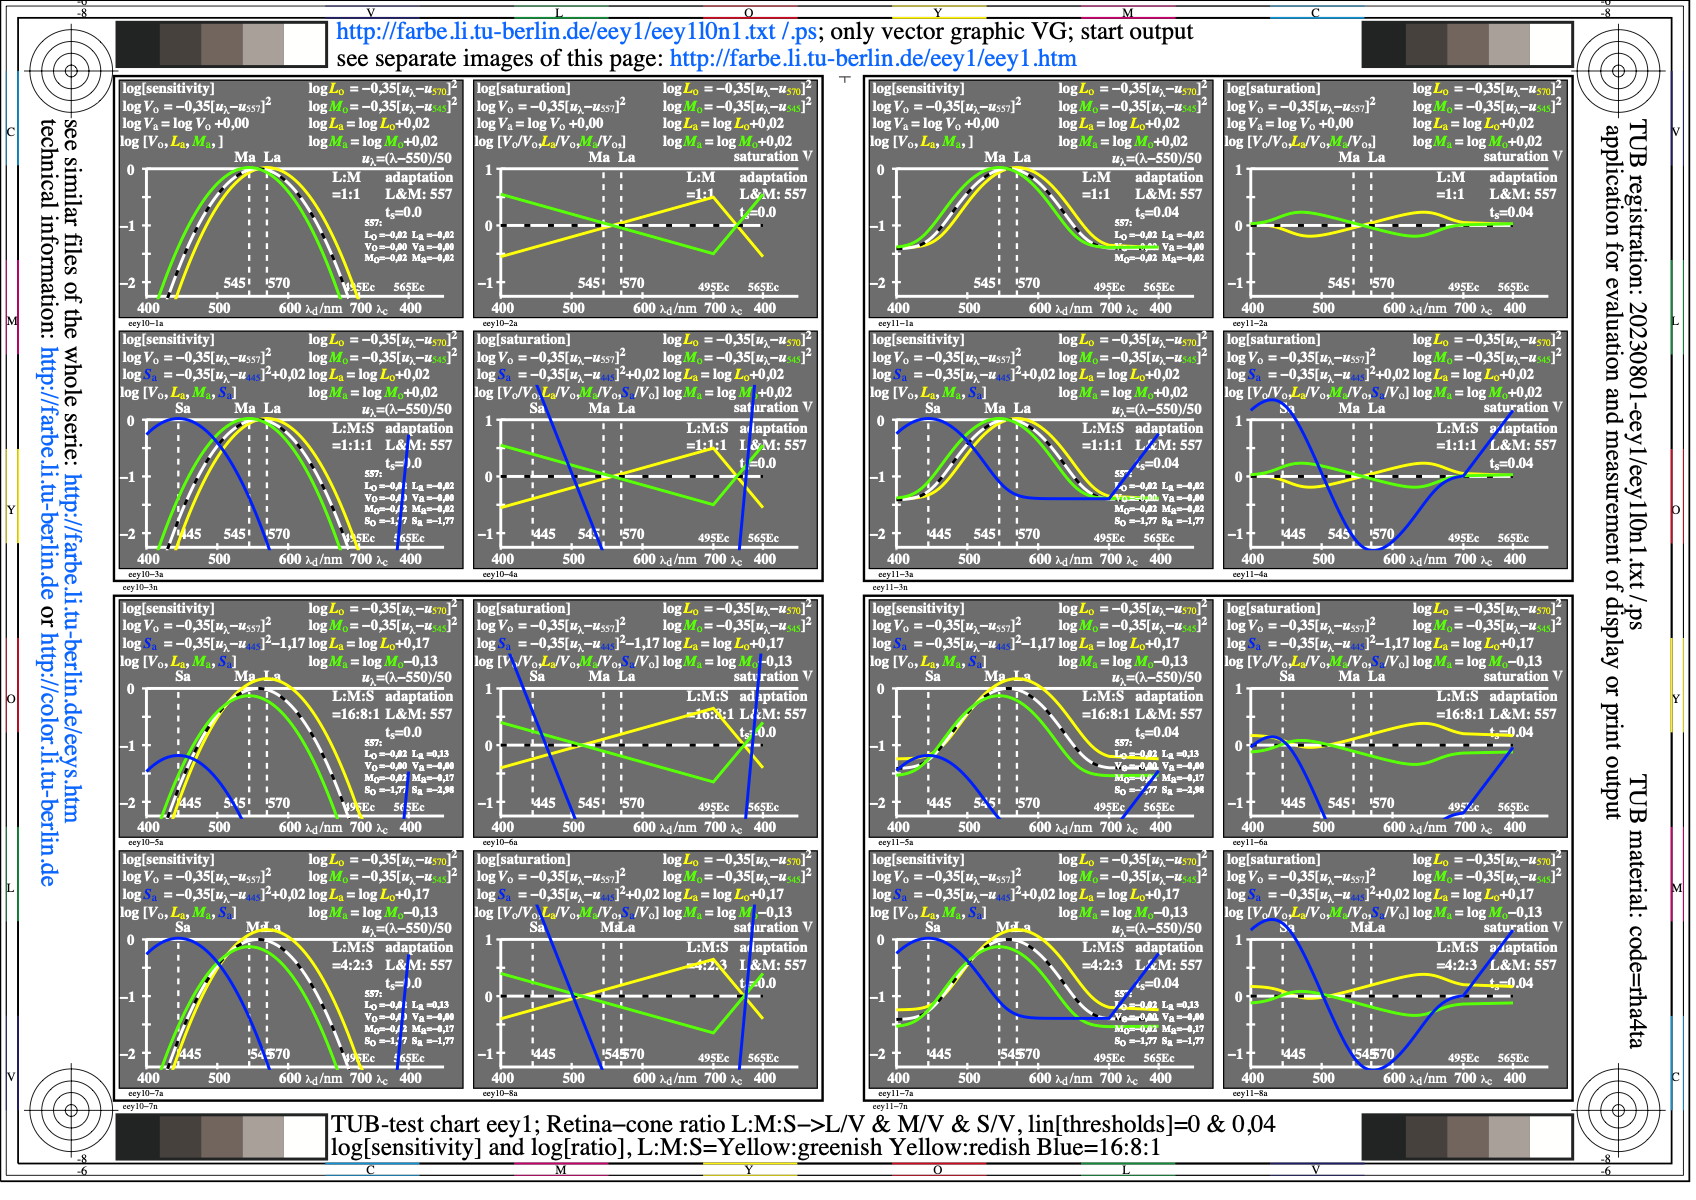
Image eey1l0n1.jpg: Output in format A6 of the file
eey1l0np.pdf, see
eey1l0n1.
PS /
TXT /
PDF /
jpg
eey1: TUB-test chart eey1; TUB-LMS colour vision model
ratio L:M:S=yellow:greenish yellow:redish blue=16:8:1
log[sensitivities], log[ratios], lin[thresholds]=0&0,04
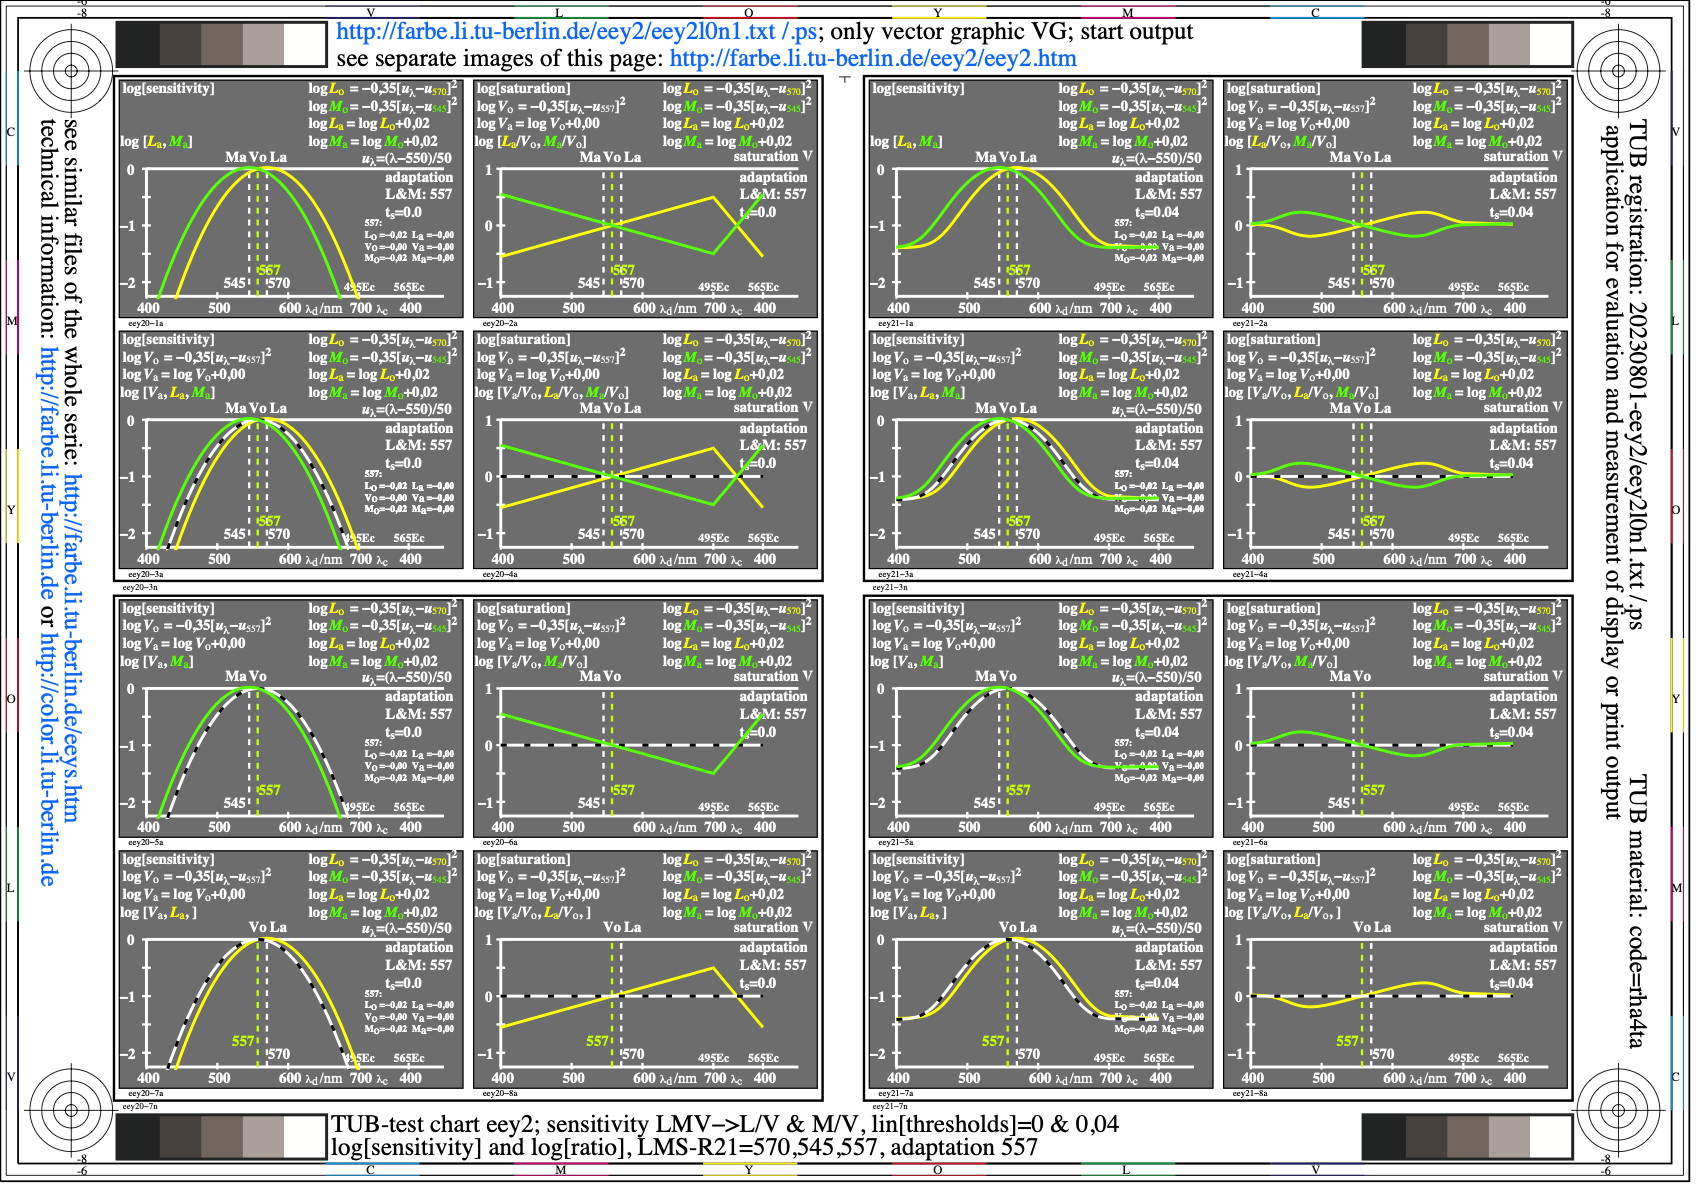
Image eey2l0n1.jpg: Output in format A6 of the file
eey2l0np.pdf, see
eey2l0n1.
PS /
TXT /
PDF /
jpg
eey2: TUB-test chart eey2; TUB-LMS colour vision model
adaptation of the sensitivities 570,557,545, LVM->(LVM)/V
log[sensitivities], log[ratios], lin[thresholds]=0&0,04

Image eey3l0n1.jpg: Output in format A6 of the file
eey3l0np.pdf, see
eey3l0n1.
PS /
TXT /
PDF /
jpg
eey3: TUB-test chart eey3; TUB-LMS colour vision model
adaptation of the sensitivities 595,570,545, OLM->(OLM)/L
log[sensitivities], log[ratios], lin[thresholds]=0&0,04

Image eey4l0n1.jpg: Output in format A6 of the file
eey4l0np.pdf, see
eey4l0n1.
PS /
TXT /
PDF /
jpg
eey4: TUB-test chart eey4; TUB-LMS colour vision model
4 adaptations of 620,570,520,470, LVM->(LVM)/V
log[sensitivities], log[ratios], lin[thresholds]=0&0,04
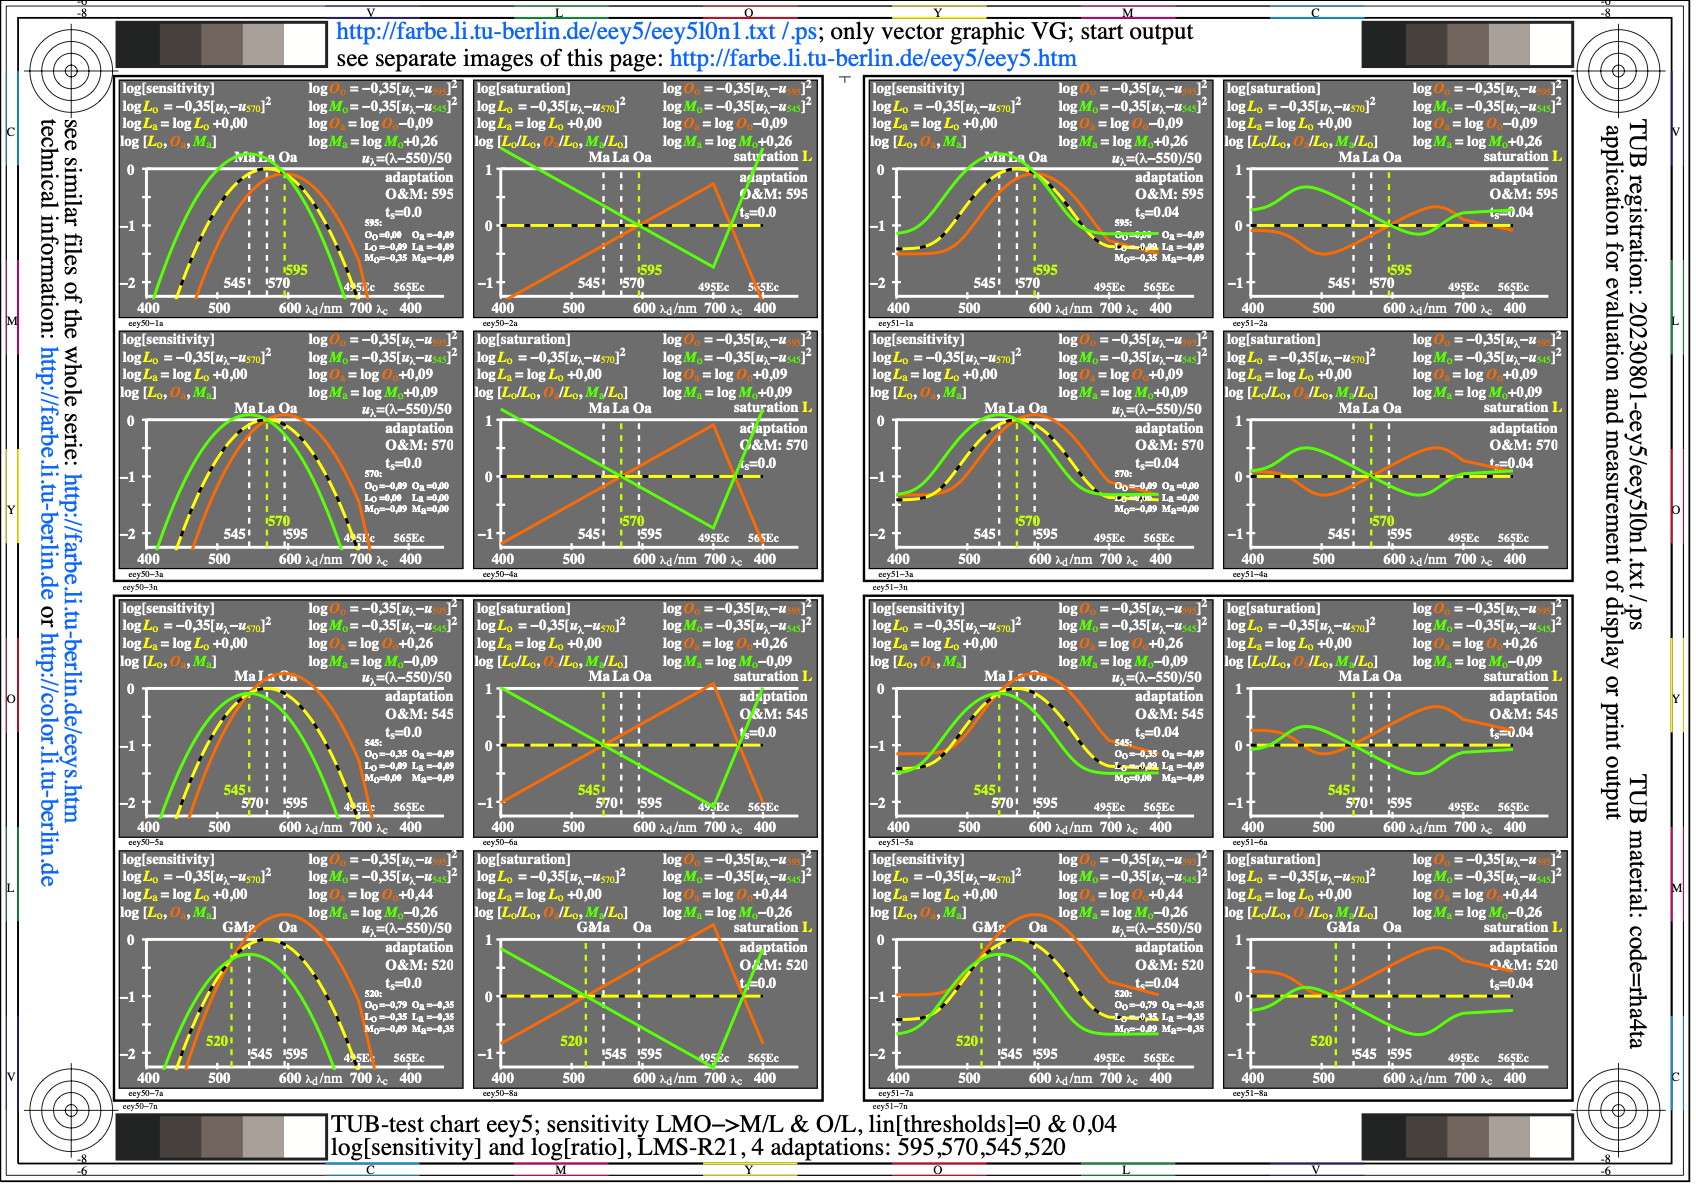
Image eey5l0n1.jpg: Output in format A6 of the file
eey5l0np.pdf, see
eey5l0n1.
PS /
TXT /
PDF /
jpg
eey5: TUB-test chart eey5; TUB-LMS colour vision model
4 adaptations of 620,570,520,470, OLM->(OLM)/L
log[sensitivities], log[ratios], lin[thresholds]=0&0,04
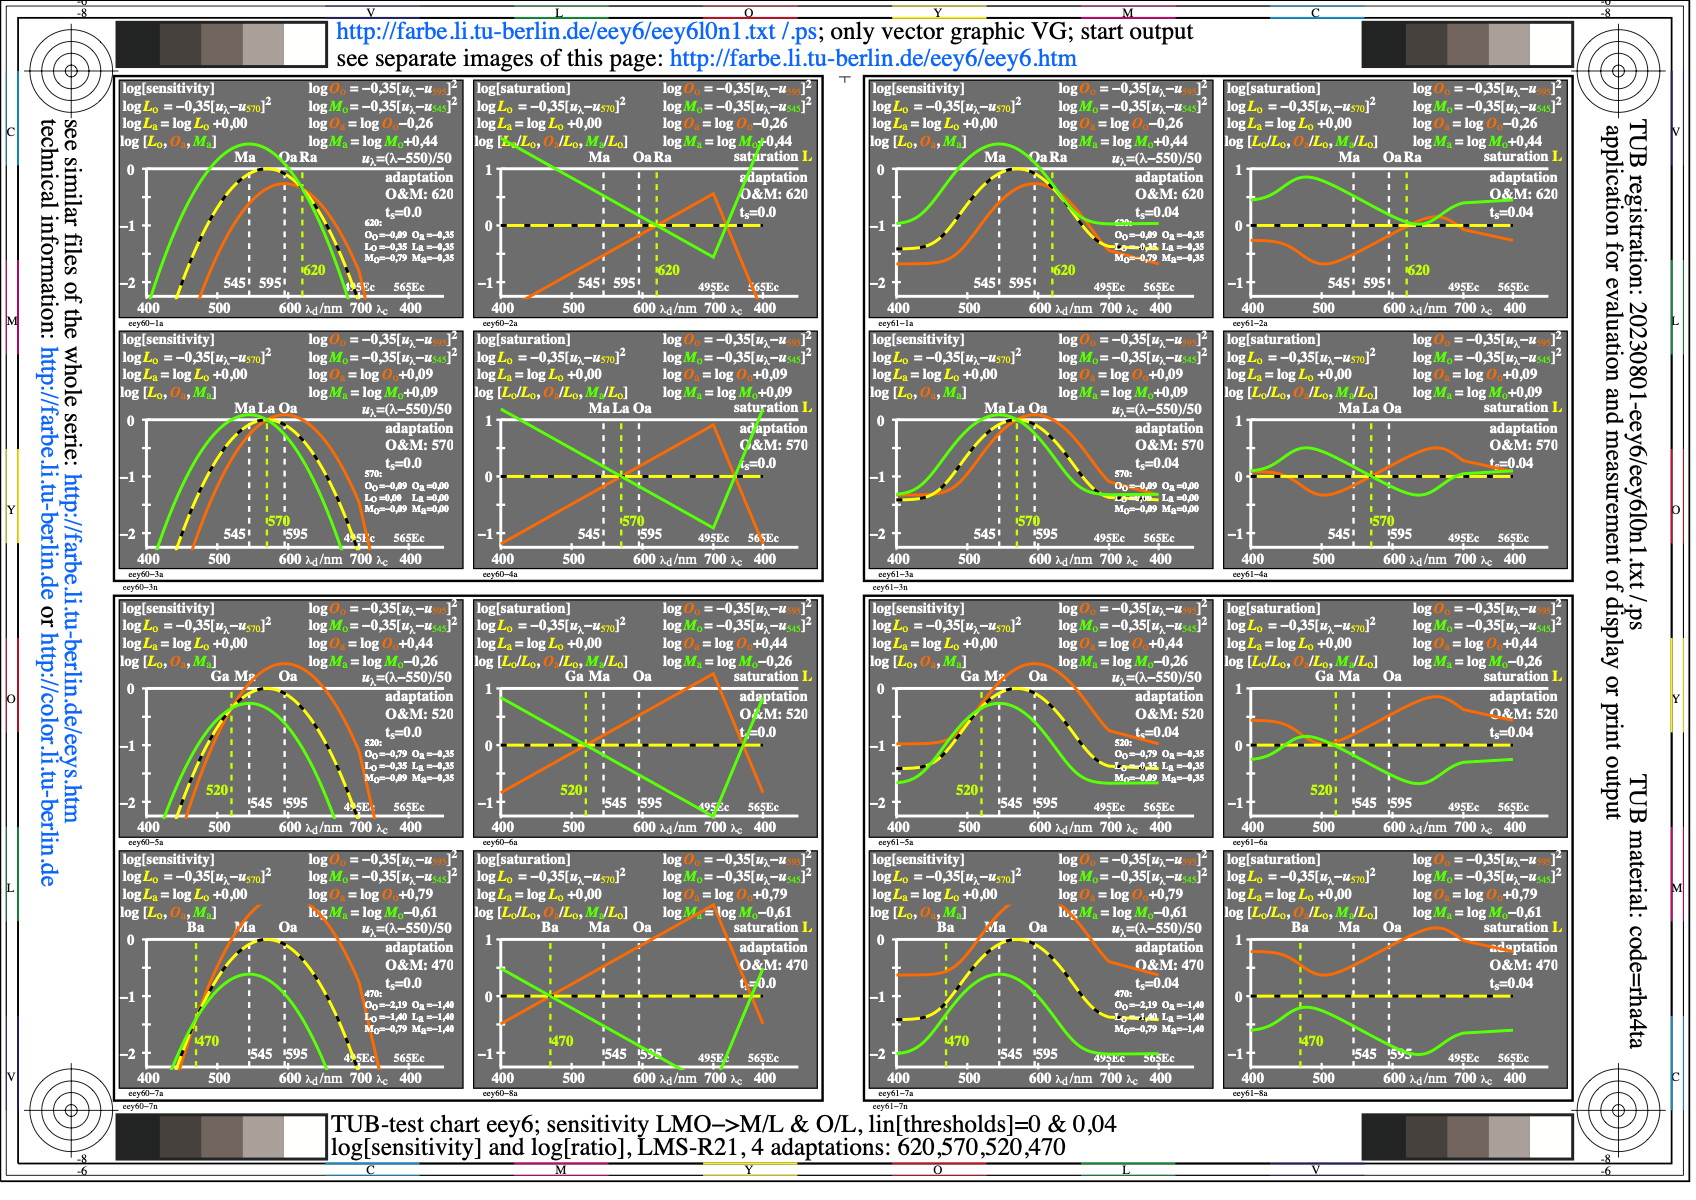
Image eey6l0n1.jpg: Output in format A6 of the file
eey6l0np.pdf, see
eey6l0n1.
PS /
TXT /
PDF /
jpg
eey6: TUB-test chart eey6; TUB-LMS colour vision model
4 adaptations of 620,570,520,470, OLM->(OLM)/L
log[sensitivities], log[ratios], lin[thresholds]=0&0,04
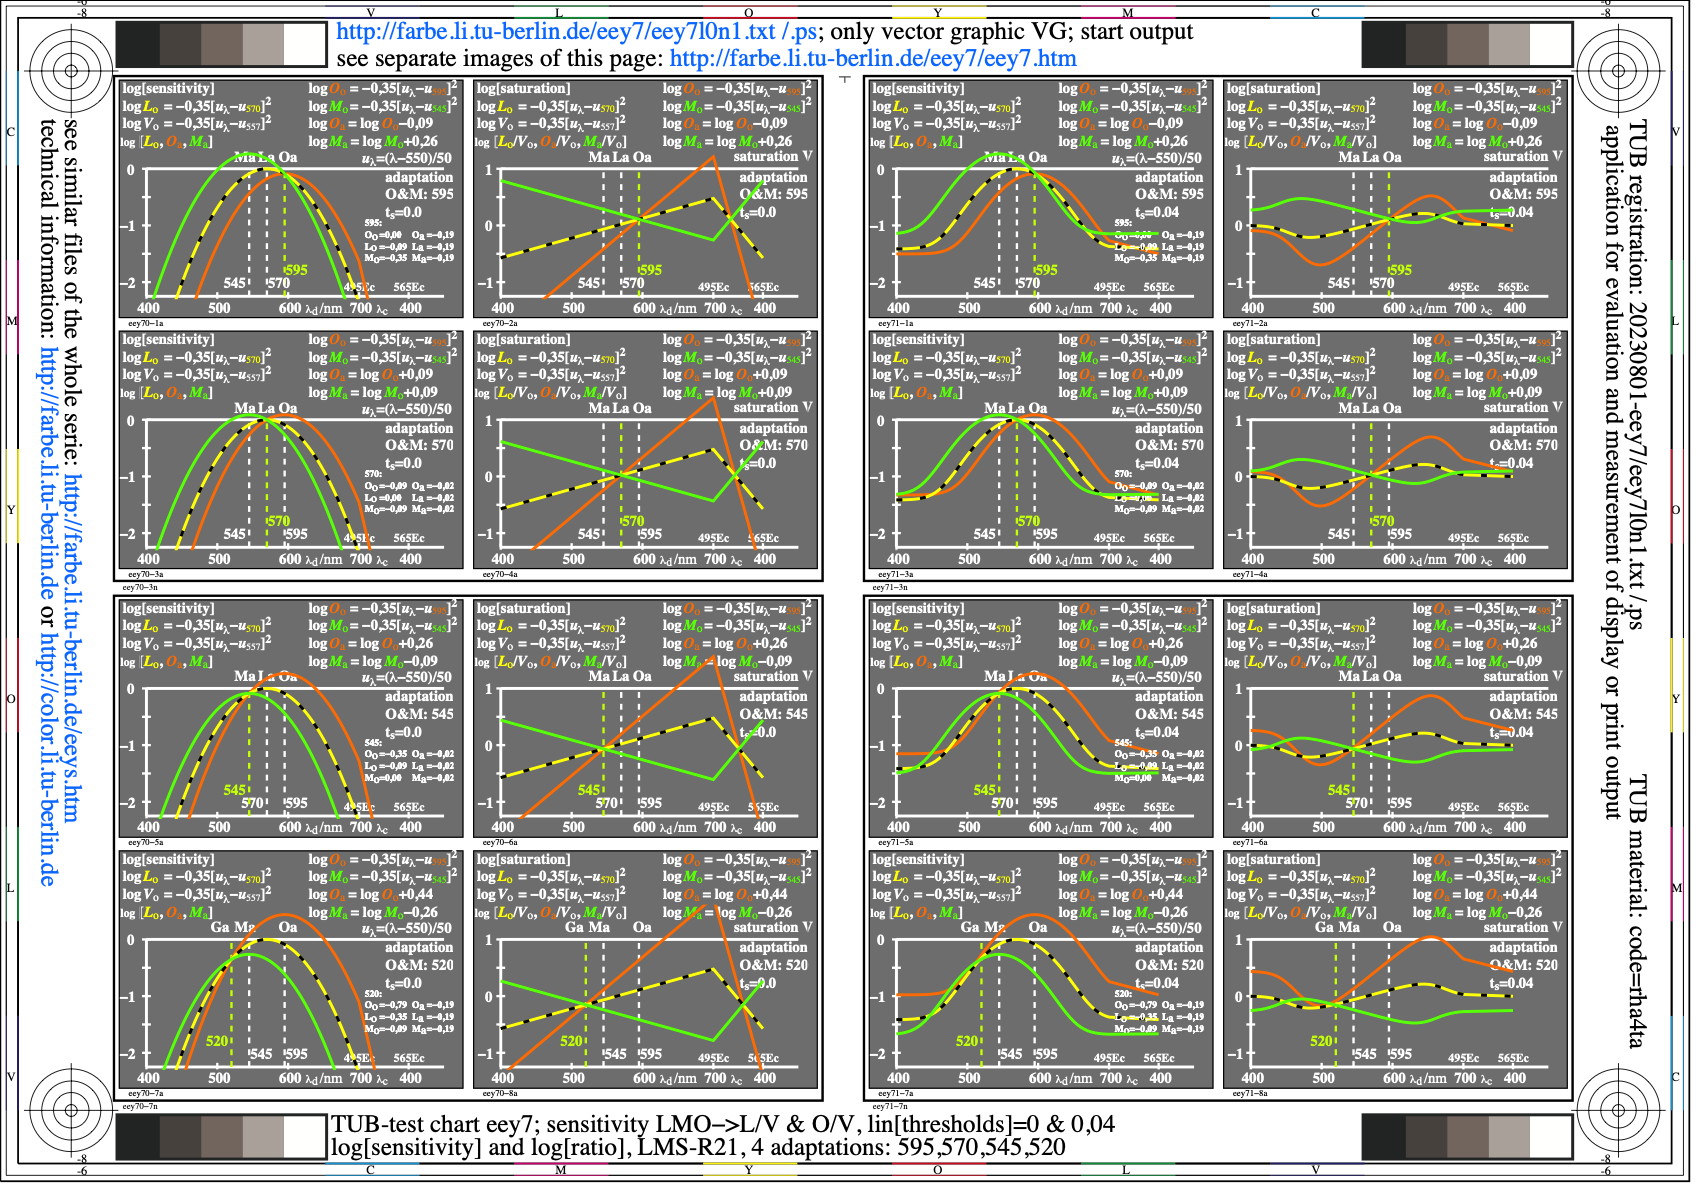
Image eey7l0n1.jpg: Output in format A6 of the file
eey7l0np.pdf, see
eey7l0n1.
PS /
TXT /
PDF /
jpg
eey7: TUB-test chart eey7; TUB-LMS colour vision model
4 adaptations of 595,570,545,520, OLM->(OLM)/L
log[sensitivities], log[ratios], lin[thresholds]=0&0,04
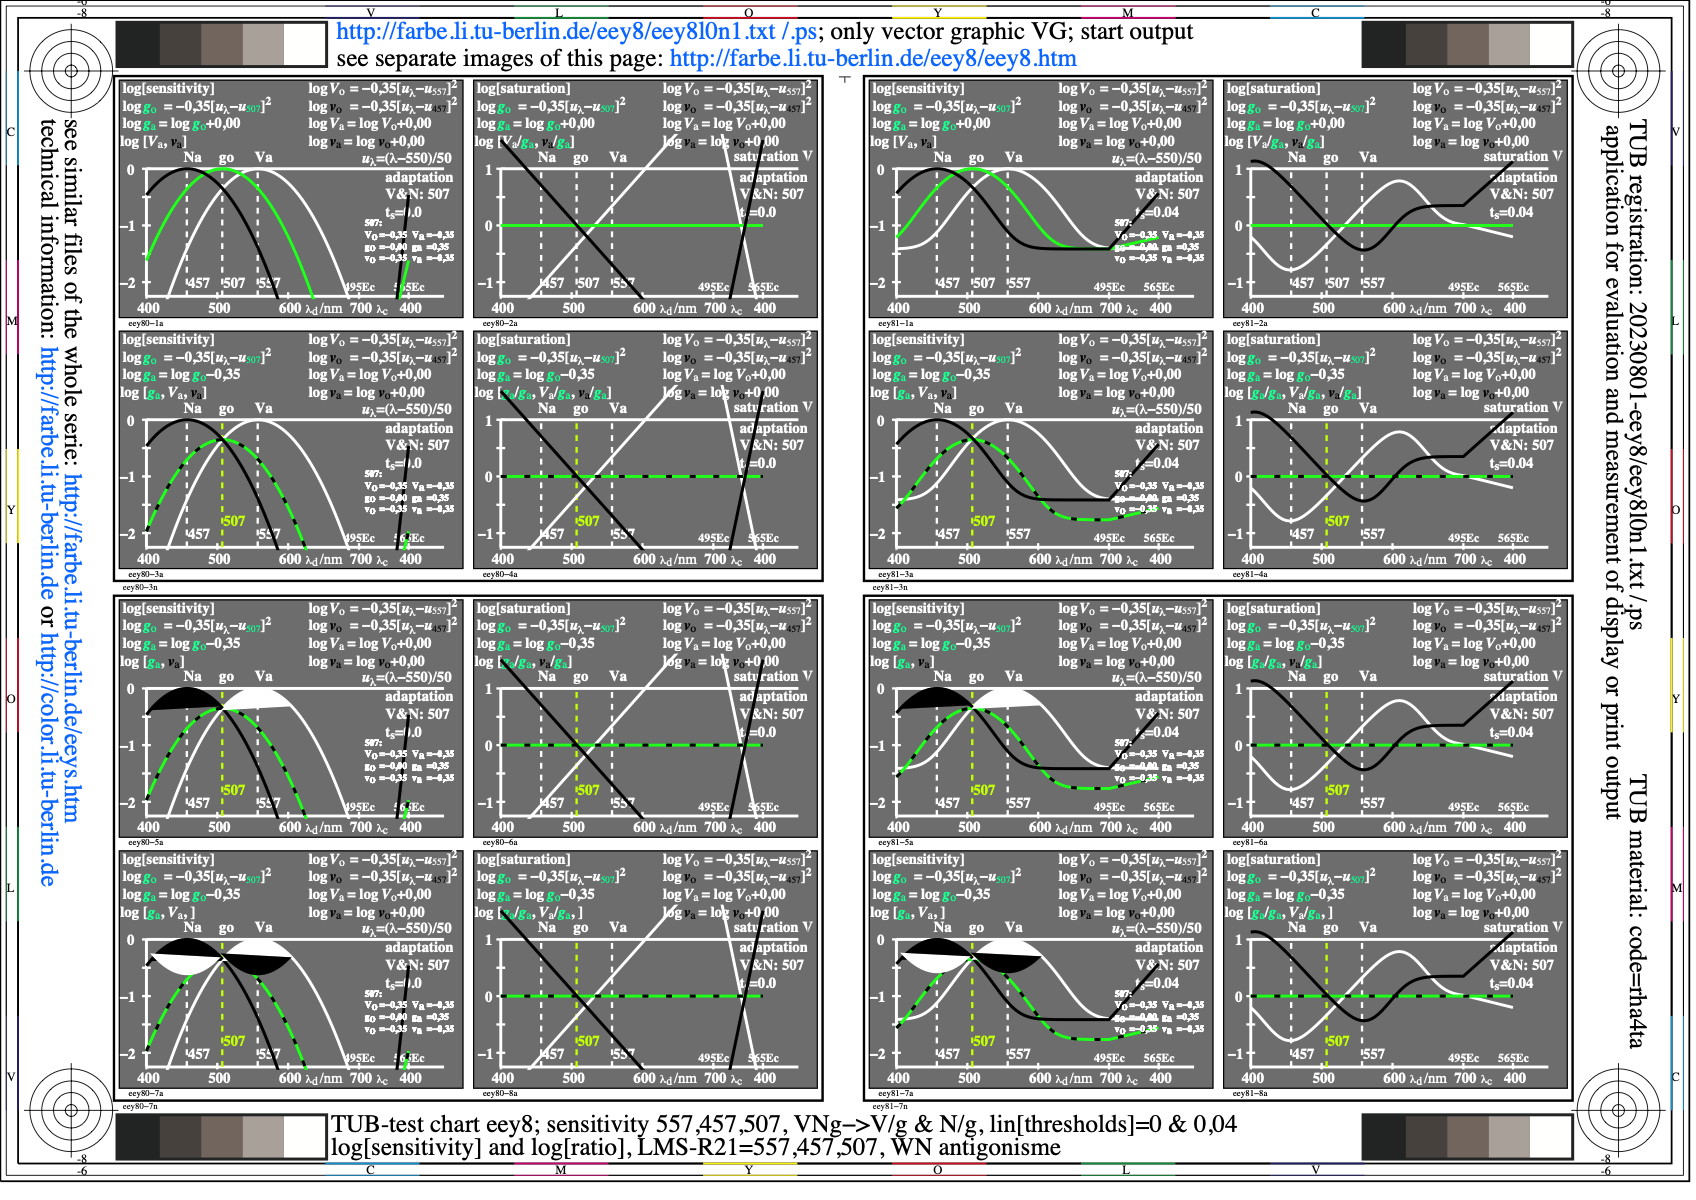
Image eey8l0n1.jpg: Output in format A6 of the file
eey8l0np.pdf, see
eey8l0n1.
PS /
TXT /
PDF /
jpg
eey8: TUB-test chart eey8; TUB-LMS colour vision model
WN antagonisme of sensitivities 547,457, V,N->V/g,N/g
log[sensitivities], log[ratios], lin[thresholds]=0&0,04
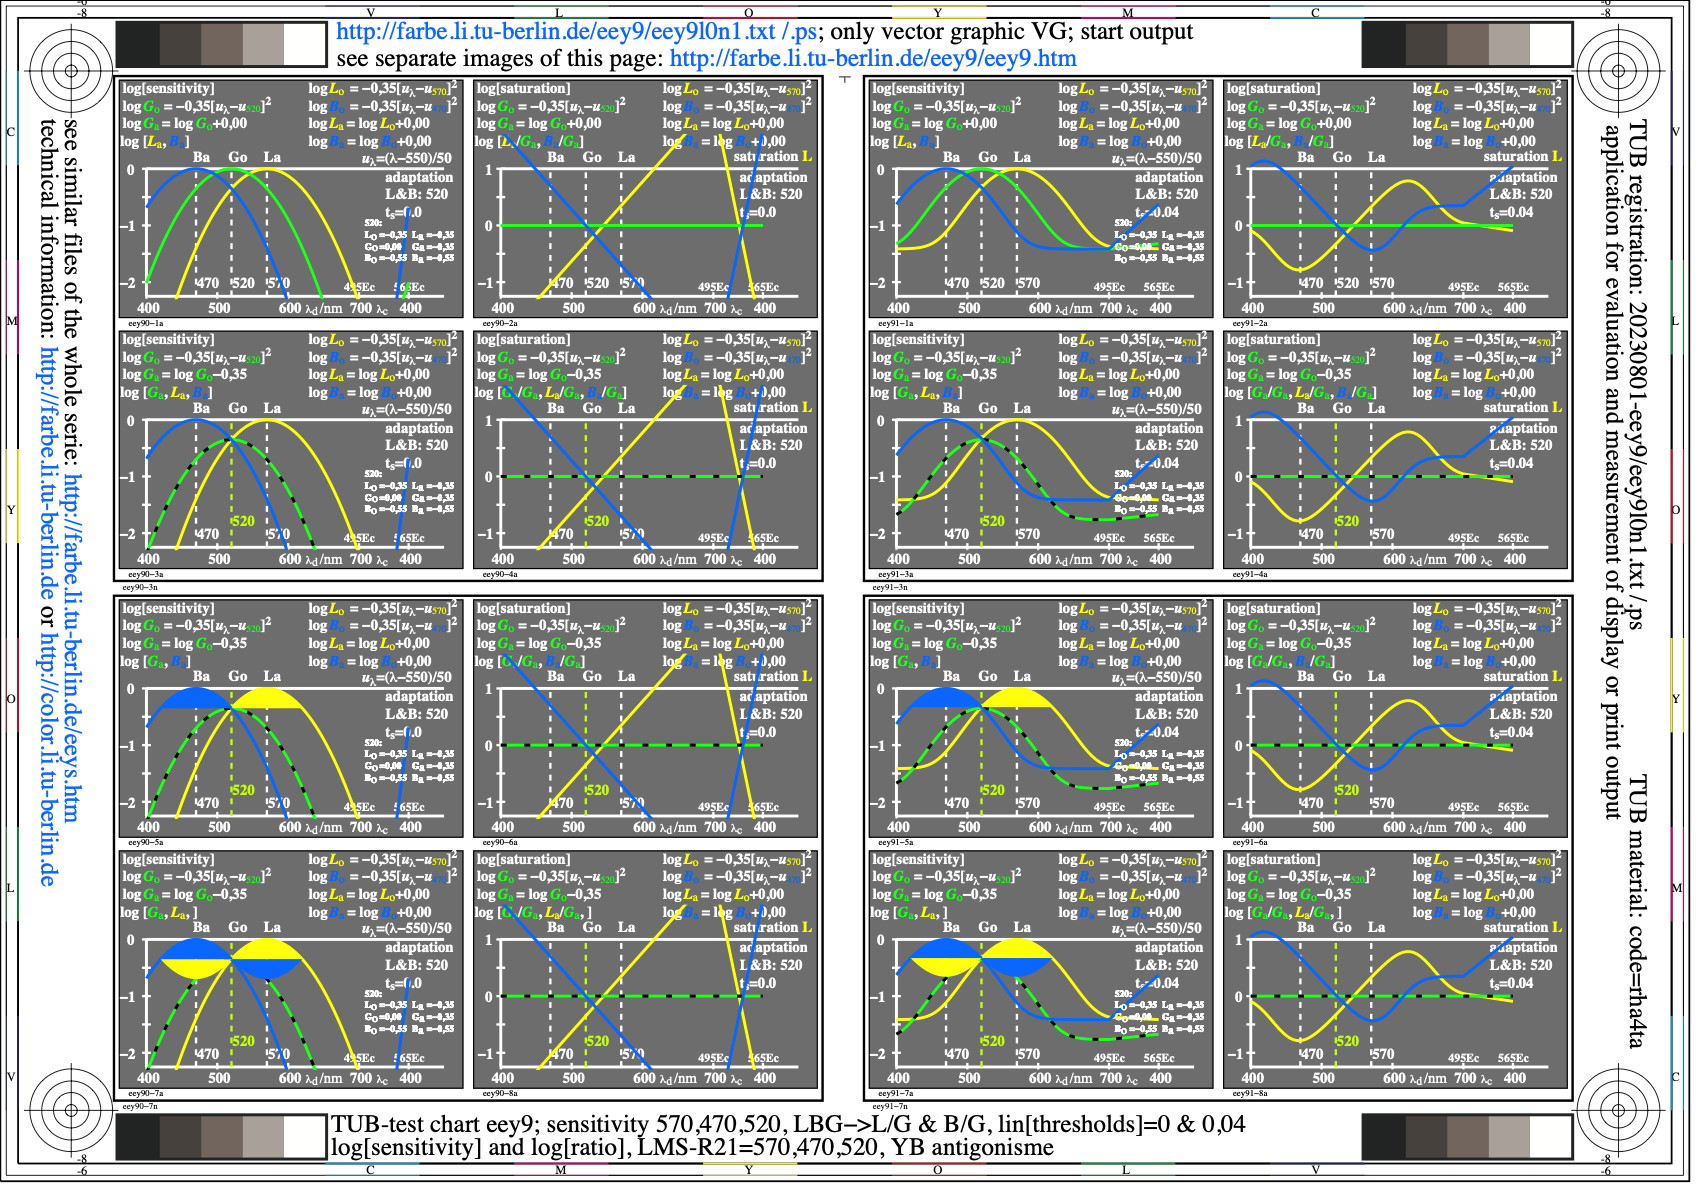
Image eey9l0n1.jpg: Output in format A6 of the file
eey9l0np.pdf, see
eey9l0n1.
PS /
TXT /
PDF /
jpg
eey9: TUB-test chart eey9; TUB-LMS colour vision model
YB antagonisme of sensitivities 570,470, Y,B->J/G,B/G
log[sensitivities], log[ratios], lin[thresholds]=0&0,04
Image eez0l0n1.jpg: Output in format A6 of the file
eez0l0np.pdf, see
eez0l0n1.
PS /
TXT /
PDF /
jpg
eez0: TUB-test chart eez0; Under development
Test with frame and image files
Image eez1l0n1.jpg: Output in format A6 of the file
eez1l0np.pdf, see
eez1l0n1.
PS /
TXT /
PDF /
jpg
eez1: TUB-test chart eez1; Under development
Test with frame and image files

Image eez2l0n1.jpg: Output in format A6 of the file
eez2l0np.pdf, see
eez2l0n1.
PS /
TXT /
PDF /
jpg
eez2: TUB-test chart eez2; Under development
Test with frame and image files
Image eez3l0n1.jpg: Output in format A6 of the file
eez3l0np.pdf, see
eez3l0n1.
PS /
TXT /
PDF /
jpg
eez3: TUB-test chart eez3; Under development
Test with frame and image files
Image eez4l0n1.jpg: Output in format A6 of the file
eez4l0np.pdf, see
eez4l0n1.
PS /
TXT /
PDF /
jpg
eez4: TUB-test chart eez4; Under development
Test with frame and image files
Image eez5l0n1.jpg: Output in format A6 of the file
eez5l0np.pdf, see
eez5l0n1.
PS /
TXT /
PDF /
jpg
eez5: TUB-test chart eez5; Under development
Test with frame and image files
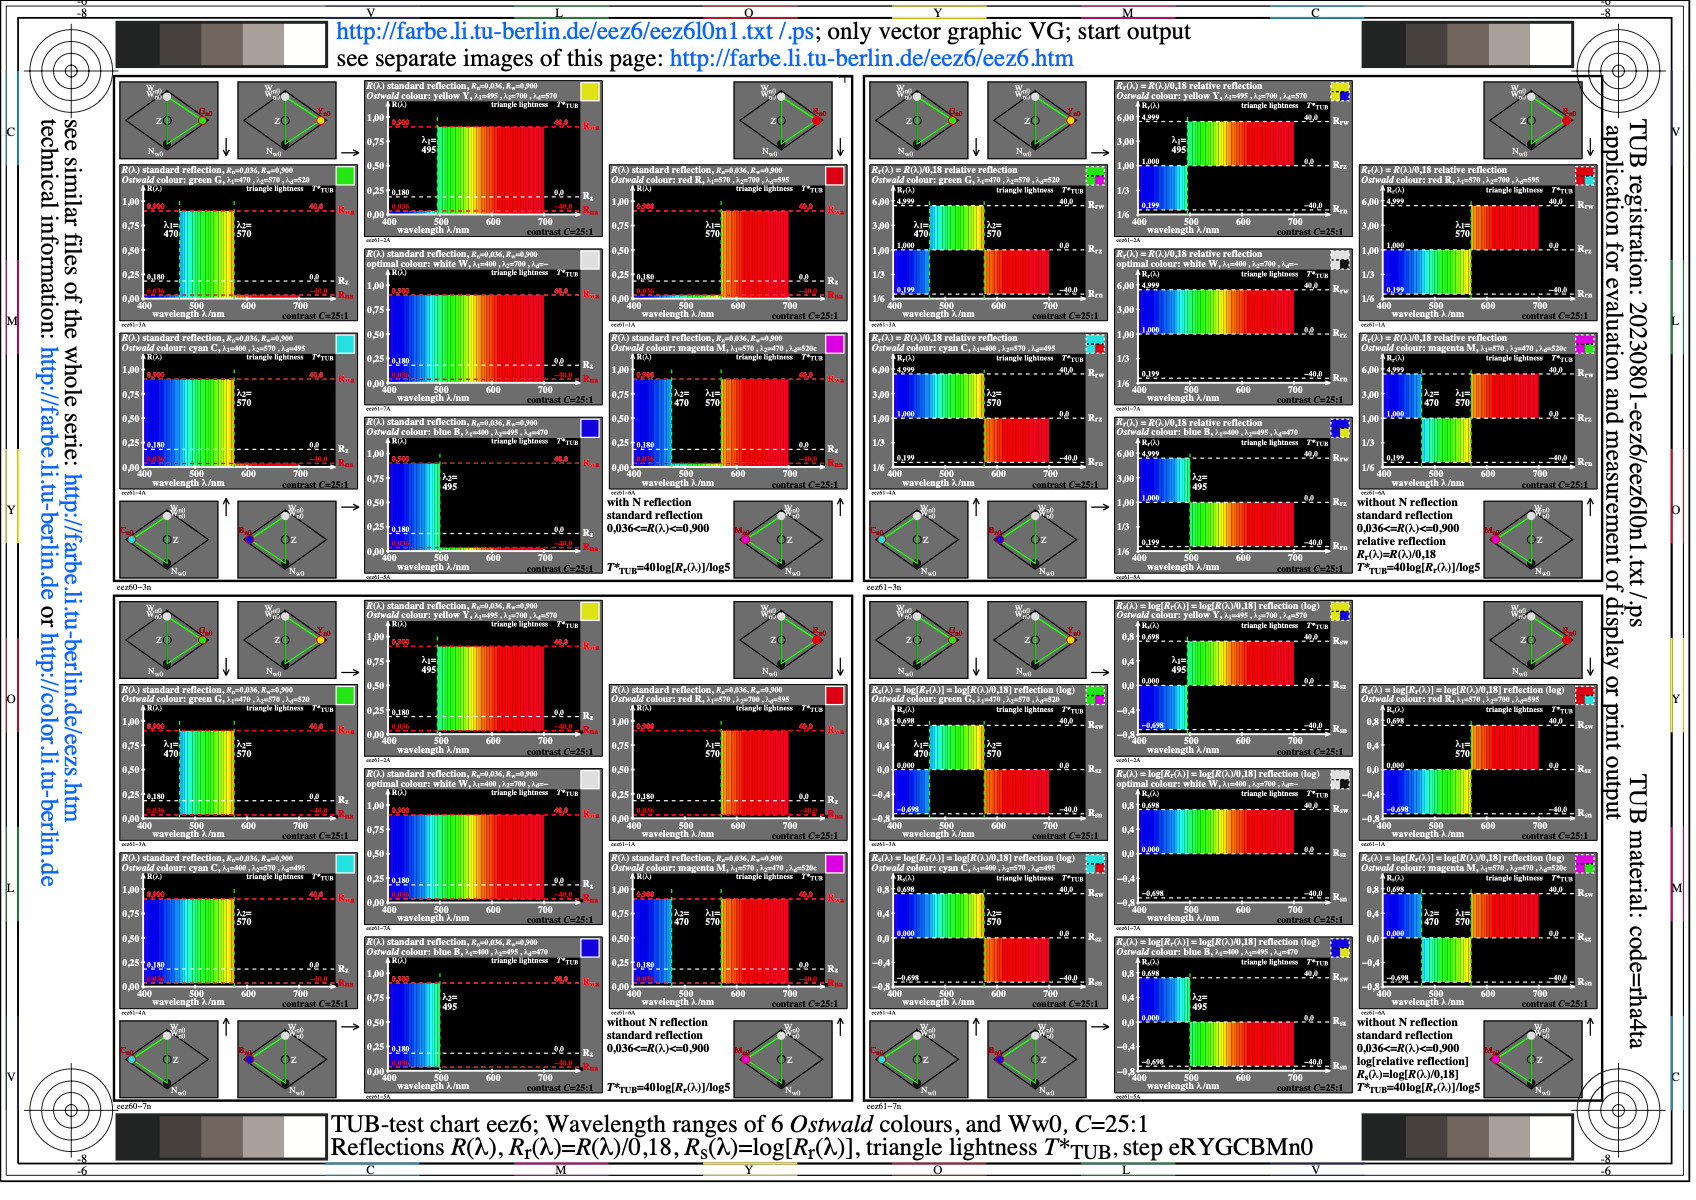
Image eez6l0n1.jpg: Output in format A6 of the file
eez6l0np.pdf, see
eez6l0n1.
PS /
TXT /
PDF /
jpg
eez6: TUB-test chart eez6; Wavelength ranges of six
Ostwald colours and Ww0, contrast C=25:1
Reflections R, Rr=R/0,18, Rs=log(Rr), and T*TUB, eRYGCBMn0
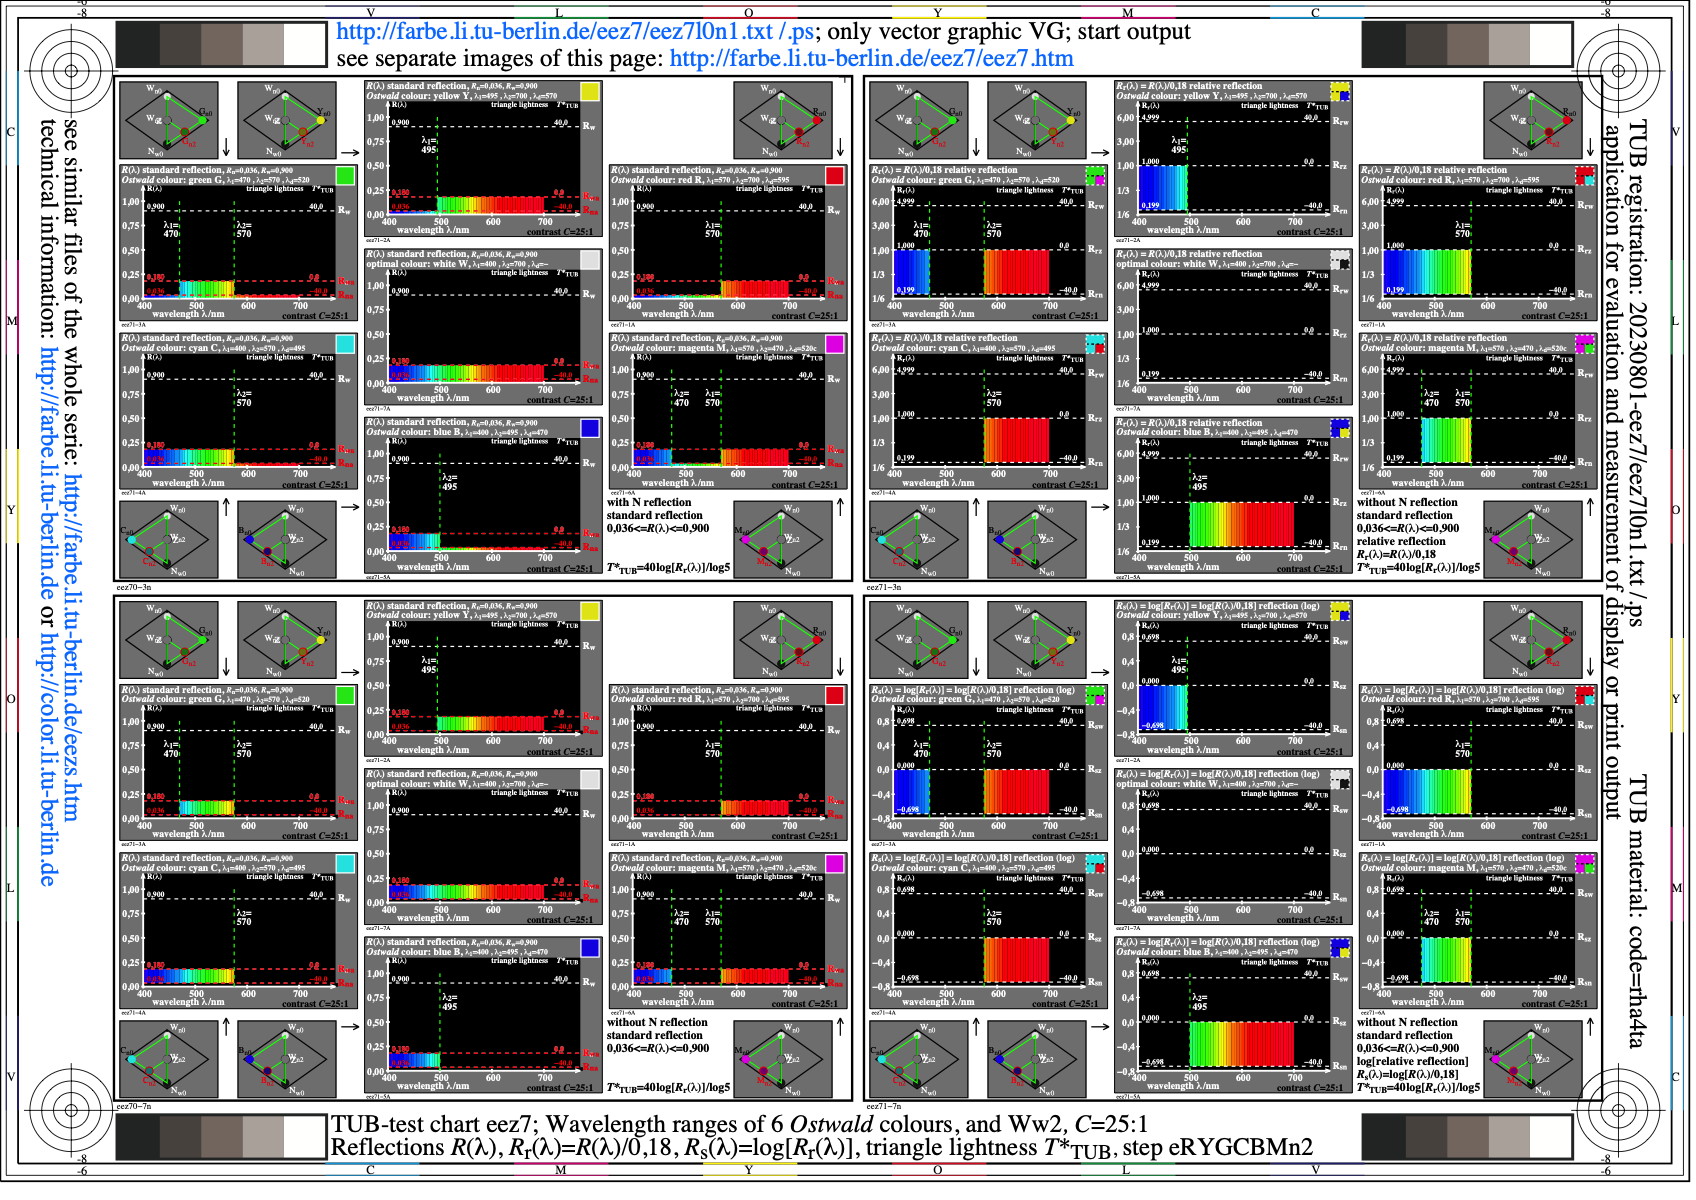
Image eez7l0n1.jpg: Output in format A6 of the file
eez7l0np.pdf, see
eez7l0n1.
PS /
TXT /
PDF /
jpg
eez7: TUB-test chart eez7; Wavelength ranges of six
Ostwald colours and Ww2, contrast C=25:1
Reflections R, Rr=R/0,18, Rs=log(Rr), and T*TUB, eRYGCBMn2
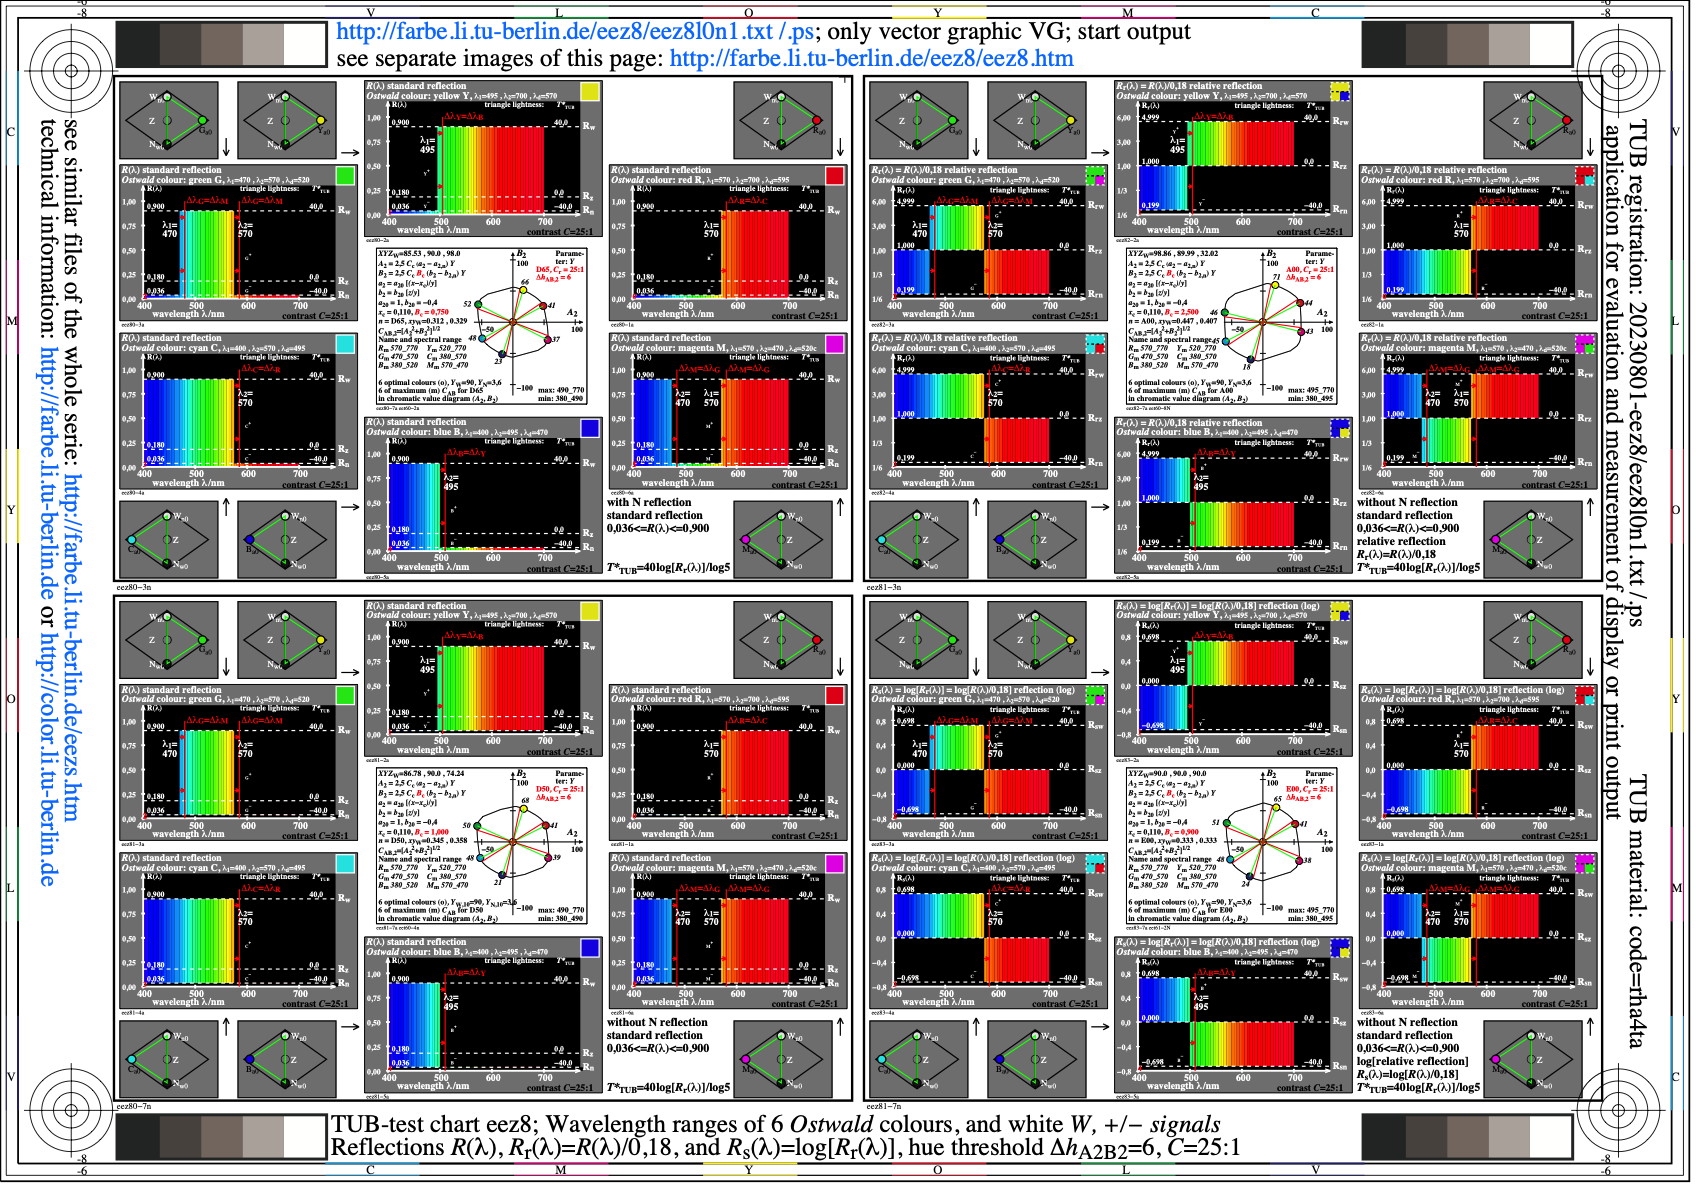
Image eez8l0n1.jpg: Output in format A6 of the file
eez8l0np.pdf, see
eez8l0n1.
PS /
TXT /
PDF /
jpg
eez8: TUB-test chart eez8; Wavelength ranges of 6
Ostwald colours, chromatic values, C=25:1, +-signals
Reflections R, Rr=R/0,18, Rs=log(Rr), hue threshold dhA2B2=6
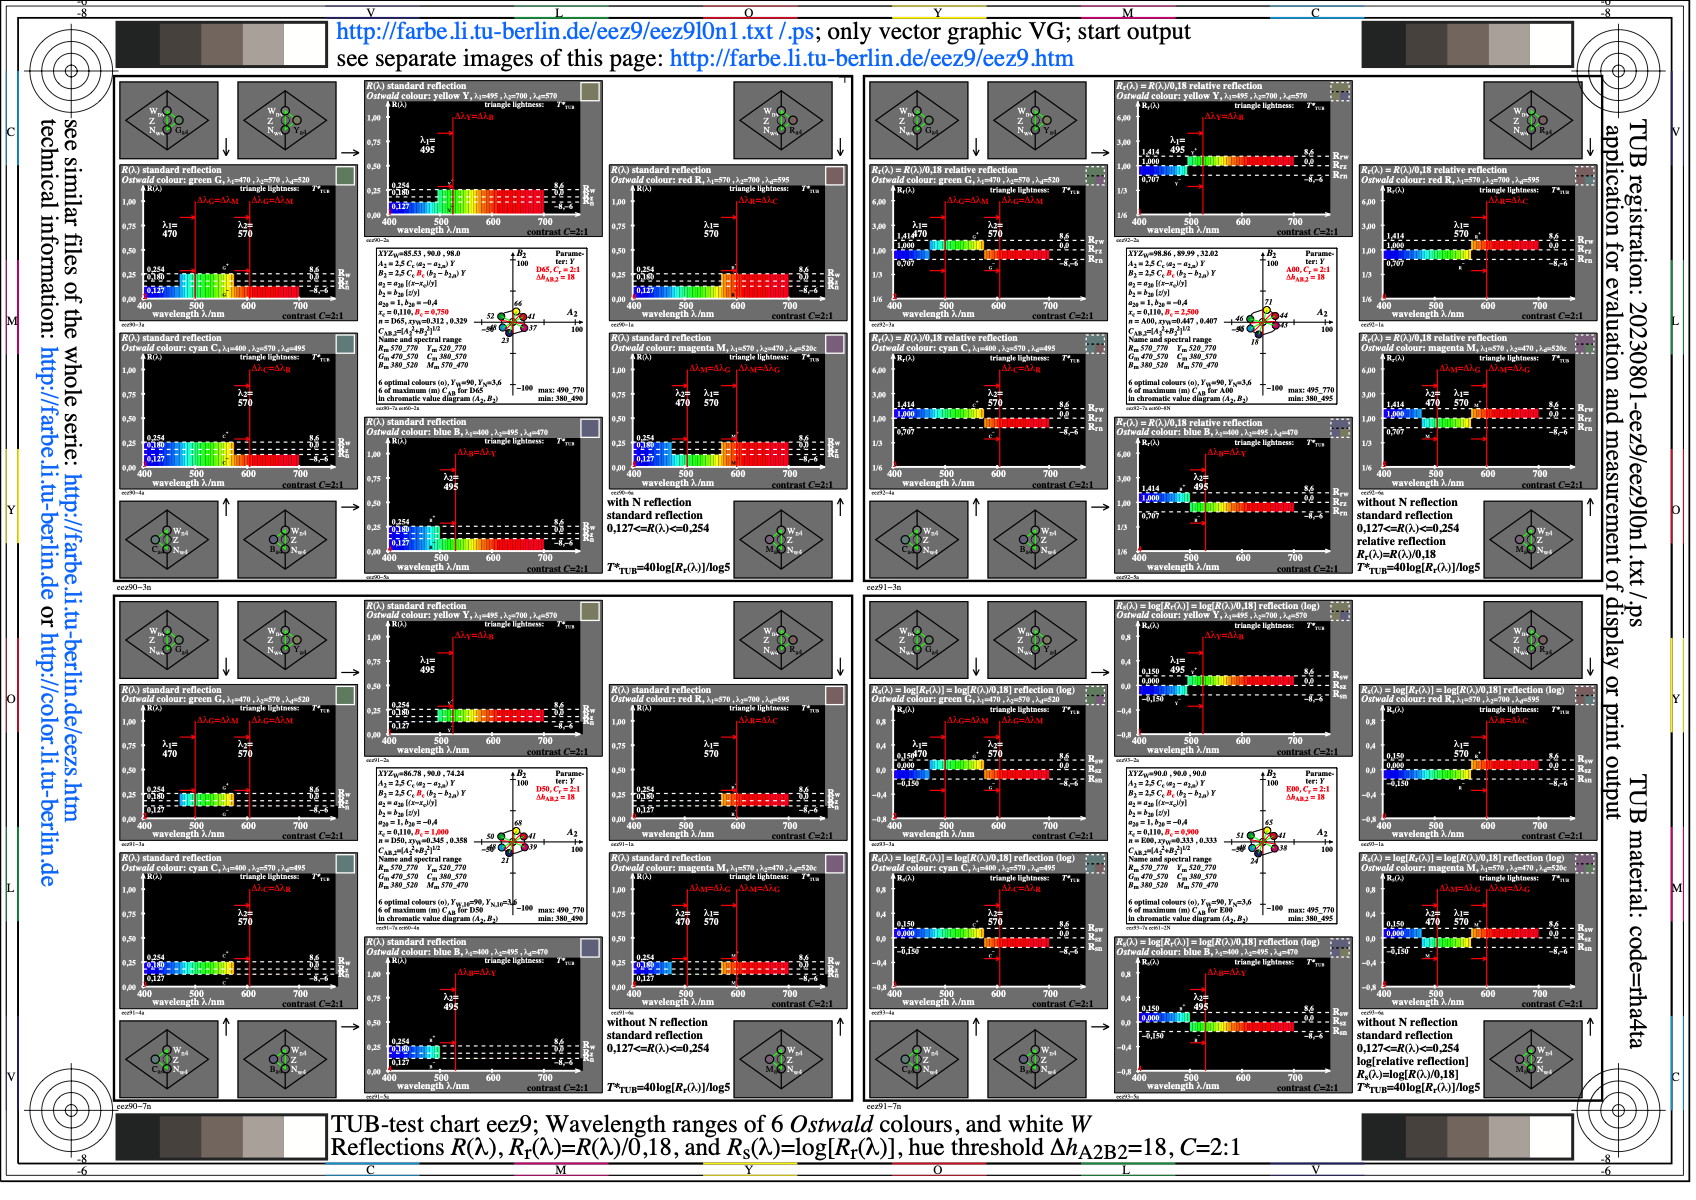
Image eez9l0n1.jpg: Output in format A6 of the file
eez9l0np.pdf, see
eez9l0n1.
PS /
TXT /
PDF /
jpg
eez9: TUB-test chart eez9; Wavelength ranges of 6
Ostwald colours, chromatic values, C=2:1, +-signals
Reflections R, Rr=R/0,18, Rs=log(Rr), hue threshold dhA2B2=18
Section 2, Chapter E:
Colour Metrics, Differences, and Appearance (2023)
This image page with 260 image series:
ee2s in English,
eg2s in German.
Previous image page:
de2s in English,
dg2s in German.
Next image page, see
fe2s in English,
fg2s in German.
Introduction, content list and summary:
eeai,
eea_i,
eea_s in English or
egai,
ega_i,
ega_s in German.
-------
Für Archiv-Information (2000-2009) des BAM servers "www.ps.bam.de"
(2000-2018)
über Prüfvorlagen,
farbmetrische Berechnungen, Normen und Veröffentlichungen, siehe
indexAE.html in englisch,
indexAG.html in deutsch.
Zurück zur TUB-Hauptseite (NICHT Archiv), siehe
index.html in englisch,
indexDE.html. in deutsch.