Figure AEA0L0N1.jpg: Output in format A6 of the file AEA0L0NP.PDF, see
AEA0L0N1. PS / TXT / PDF / jpg
Section 2, Chapter A:
Colour Image Technology and Colour Management (2019)
This image page with 260 image series:
ae2s in English,
ag2s in German.
Previous image page:
ze2s in English,
zg2s in German.
Next image page:
be2s in English,
bg2s in German.
Introduction, content list and summary:
AEAI,
AEA_I,
AEA_S in English or
AGAI,
AGA_I,
AGA_S in German.
Section 2: Colourimetry, Colour Vision and Applications for Colour Image Technology (2019-2024), Image part ae2s
Chapter A: Colour Image Technology and Colour Management (2019)
The following 260 image series between aea0 and aez9
show the content with links to the single figures
in up to six formats.
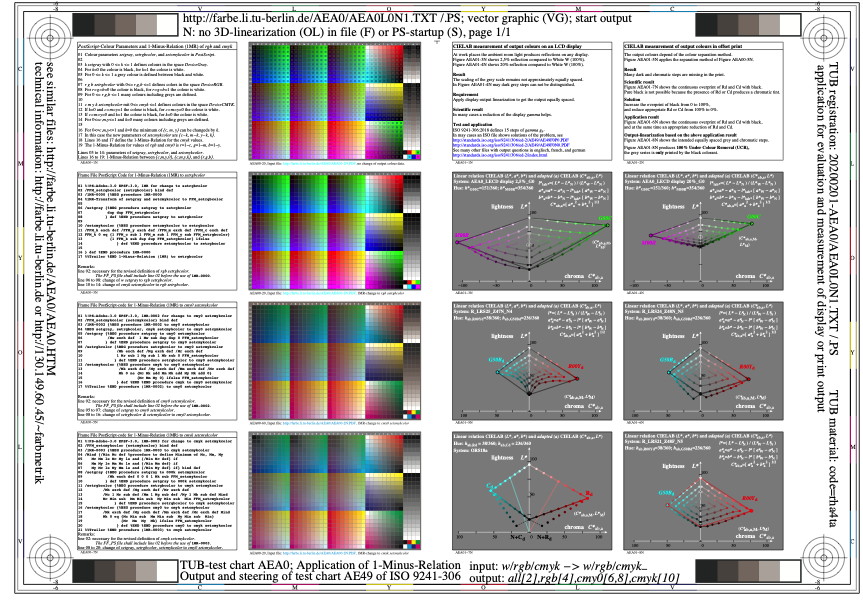
Figure AEA0L0N1.jpg: Output in format A6 of the file
AEA0L0NP.PDF, see
AEA0L0N1.
PS /
TXT /
PDF /
jpg
AEA0: TUB-test chart AEA0; Application of the 1-Minus-Relation
Output and steering of the test chart AE49
of the ergonomic standard ISO 9241-306:2018
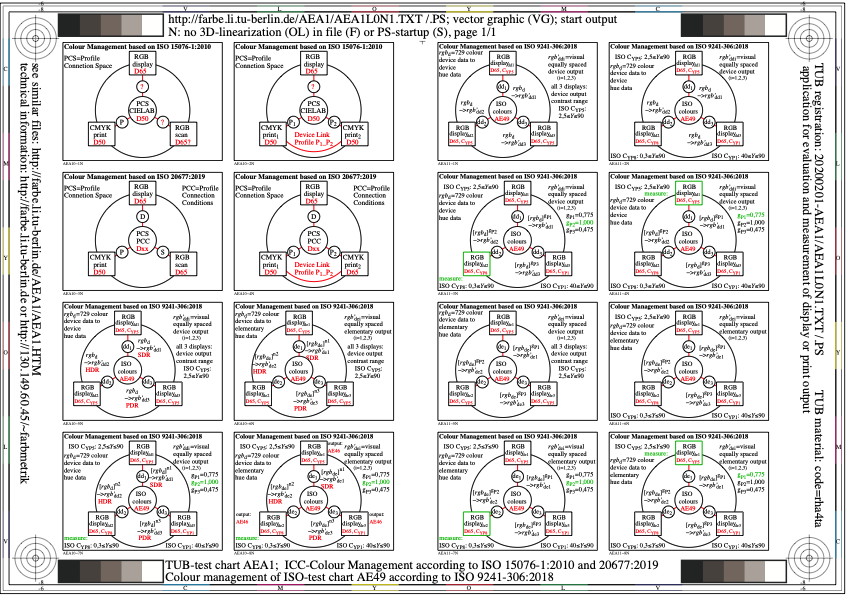
Figure AEA1L0N1.jpg: Output in format A6 of the file
AEA1L0NP.PDF, see
AEA1L0N1.
PS /
TXT /
PDF /
jpg
AEA1: TUB-Test chart AEA1; Colour Management
according to ISO 15076-1:2010, ISO 20677:2019,
and ISO-test charts according to ISO 9241-306:2018
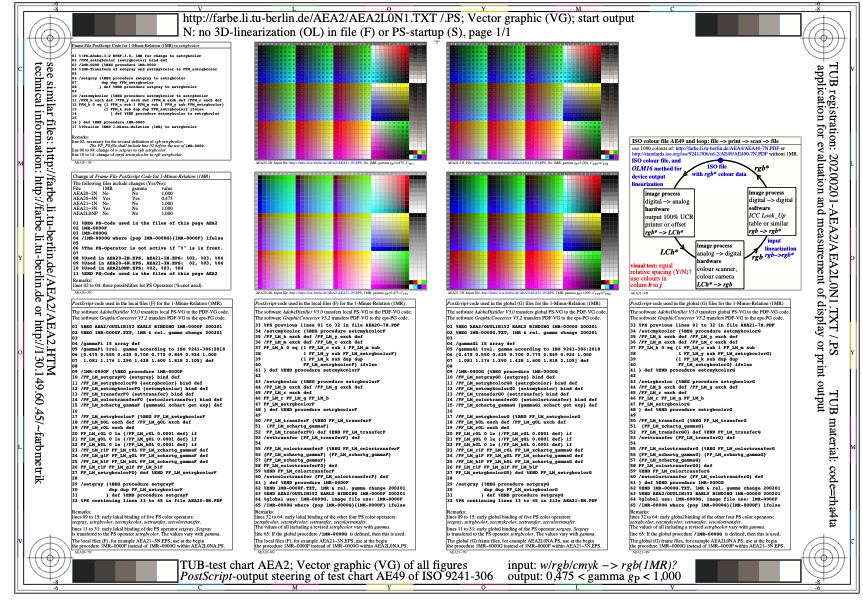
Figure AEA2L0N1.jpg: Output in format A6 of the file
AEA2L0NP.PDF, see
AEA2L0N1.
PS /
TXT /
PDF /
jpg
AEA2: TUB-test chart AEA2; Vector and/or pixel graphic
PostScript-output steering of the test chart AE49
of the ergonomic standard ISO 9241-306:2018
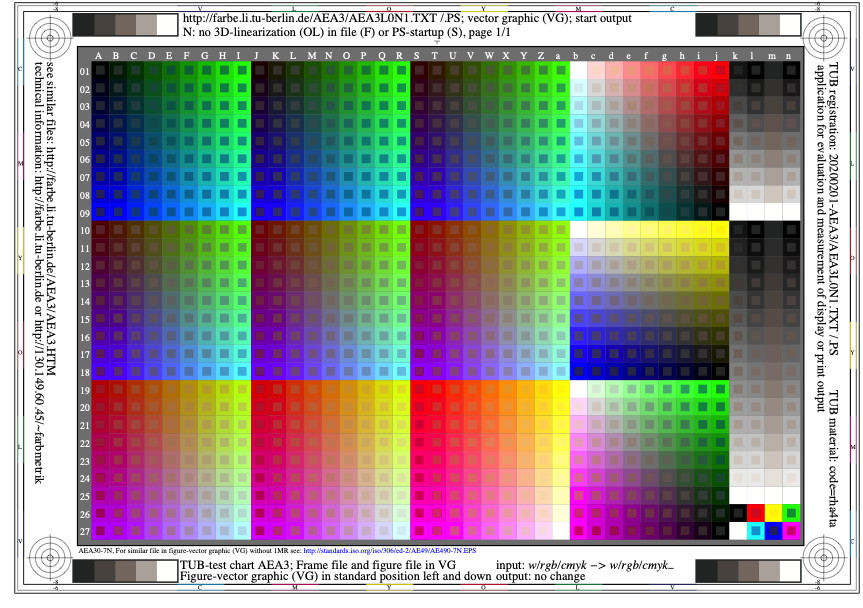
Figure AEA3L0N1.jpg: Output in format A6 of the file
AEA3L0NP.PDF, see
AEA3L0N1.
PS /
TXT /
PDF /
jpg
AEA3: TUB-test chart AEA3; Frame file and figure file without 1MR
Output of the frame (VG) and the figure (VG) file, compare
http://standards.iso.org/iso/9241/306/ed-2/AE49/AE49.HTM

Figure AEA4L0N1.jpg: Output in format A6 of the file
AEA4L0NP.PDF, see
AEA4L0N1.
PS /
TXT /
PDF /
jpg
AEA4: TUB-test chart AEA4; Frame file and figure file with 1MR
Output of the frame (VG) and the figure (VG) file, compare
http://standards.iso.org/iso/9241/306/ed-2/AE49/AE49.HTM
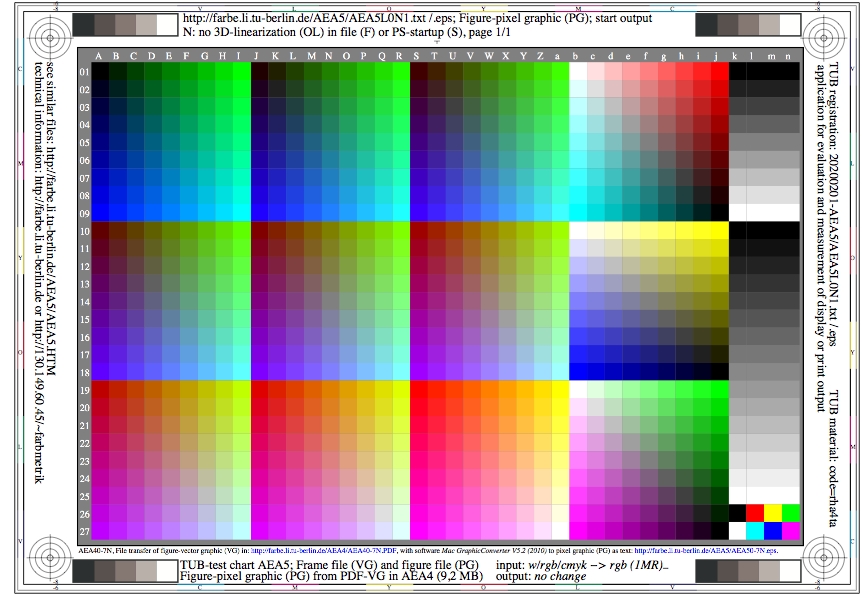
Figure AEA5L0N1.jpg: Output in format A6 of the file
AEA5L0NP.PDF, see
AEA5L0N1.
PS /
TXT /
PDF /
jpg
AEA5: TUB-test chart AEA5; Frame file and figure file
Output of the frame (VG) and the figure (PG) file
VG of AEA4 transfered to PG in AEA5 (9,2 MB as text)
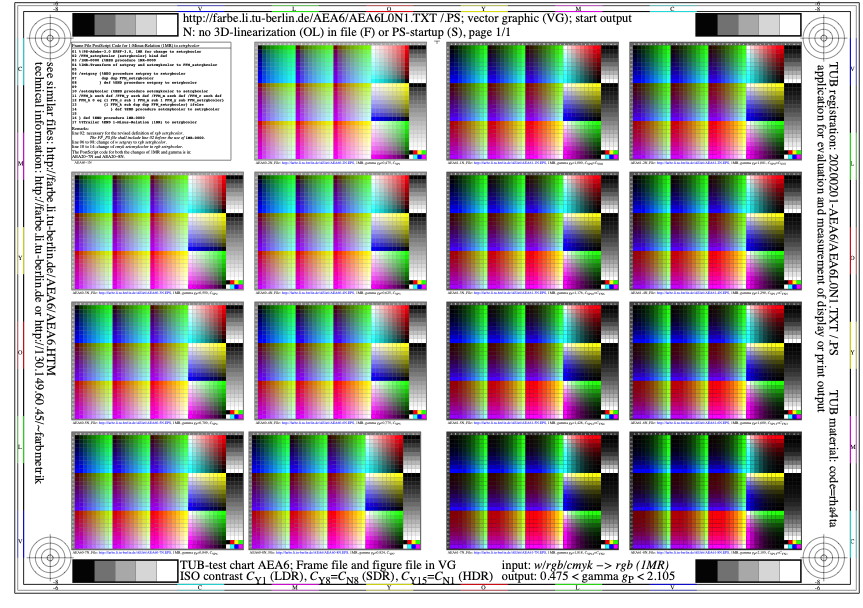
Figure AEA6L0N1.jpg: Output in format A6 of the file
AEA6L0NP.PDF, see
AEA6L0N1.
PS /
TXT /
PDF /
jpg
AEA6: TUB-test chart AEA6; Frame file and figure files
Output of the frame (VG) file and 16 figure (VG) files
For relative gamma gP in 15 steps between 0,475 < gP < 2,105
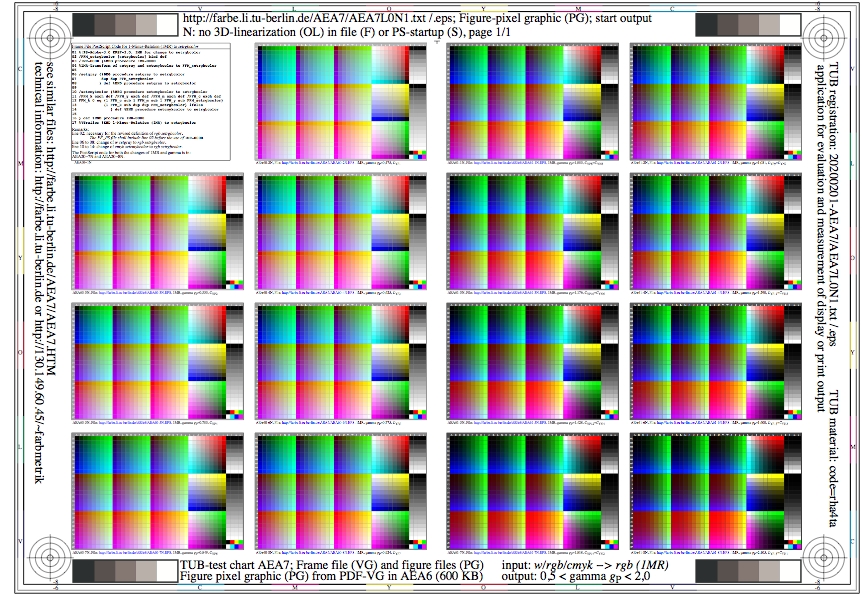
Figure AEA7L0N1.jpg: Output in format A6 of the file
AEA7L0NP.PDF, see
AEA7L0N1.
PS /
TXT /
PDF /
jpg
AEA7: TUB-test chart AEA7; Frame file and figure files
Output of the frame (VG) file and 16 figure (PG) files
VG of AEA6 transfered to PG in AEA7 (8,6 MB as text)

Figure AEA8L0N1.jpg: Output in format A6 of the file
AEA8L0NP.PDF, see
AEA8L0N1.
PS /
TXT /
PDF /
jpg
AEA8: TUB-test chart AEA8; Frame file and figure file with cmy0
Output of the frame (VG) and the figure (VG) file, compare
http://standards.iso.org/iso/9241/306/ed-2/AE49/AE49.HTM
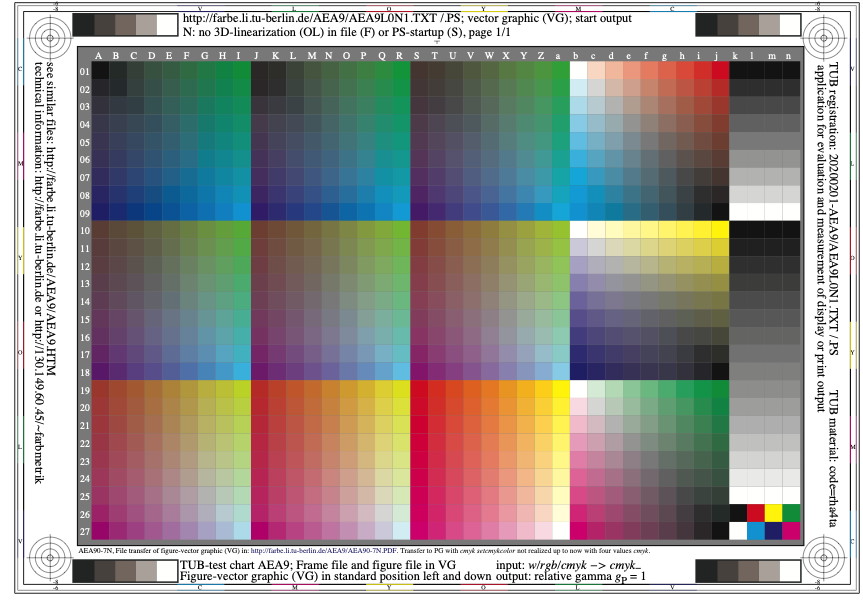
Figure AEA9L0N1.jpg: Output in format A6 of the file
AEA9L0NP.PDF, see
AEA9L0N1.
PS /
TXT /
PDF /
jpg
AEA9: TUB-test chart AEA9; Frame file and figure file with cmyk
Output of the frame (VG) and the figure (VG) file, compare
http://standards.iso.org/iso/9241/306/ed-2/AE49/AE49.HTM
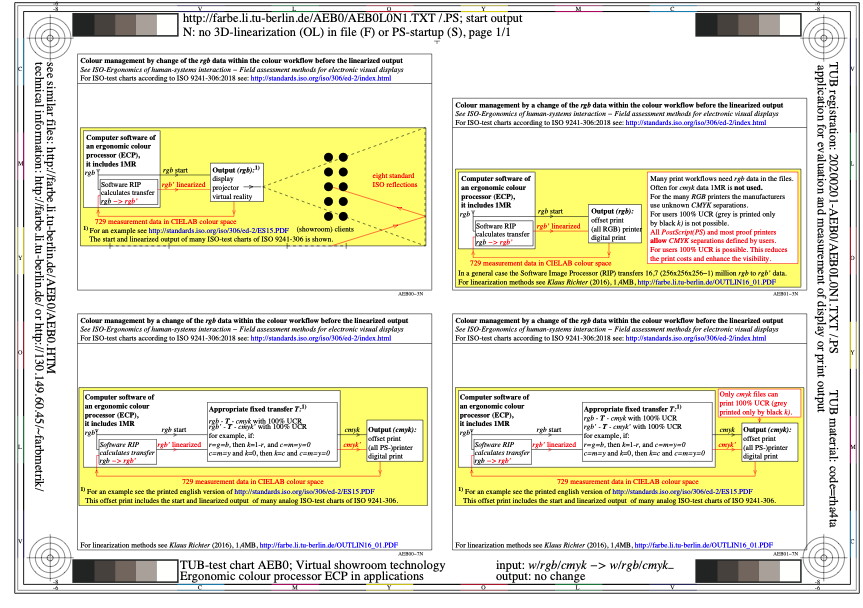
Figure AEB0L0N1.jpg: Output in format A6 of the file
AEB0L0NP.PDF, see
AEB0L0N1.
PS /
TXT /
PDF /
jpg
AEB0: TUB-test chart AEB0; Ergonomic colour output
Ergonomic and colorimetric colour processor (ECP)
Virtual showroom technic
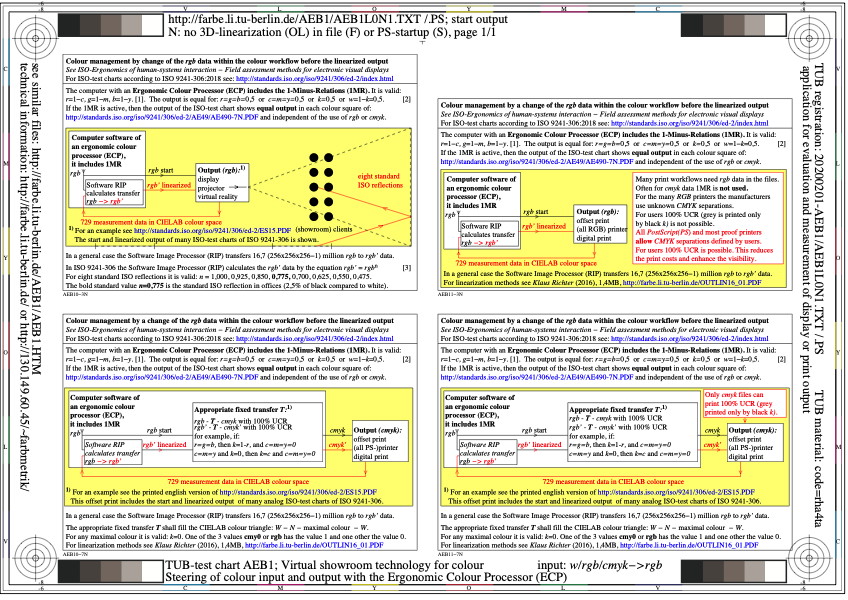
Figure AEB1L0N1.jpg: Output in format A6 of the file
AEB1L0NP.PDF, see
AEB1L0N1.
PS /
TXT /
PDF /
jpg
AEB1: TUB-test chart AEB1; Ergonomic colour output
Ergonomic and colorimetric colour processor (ECP)
Virtual showroom technic with explanations
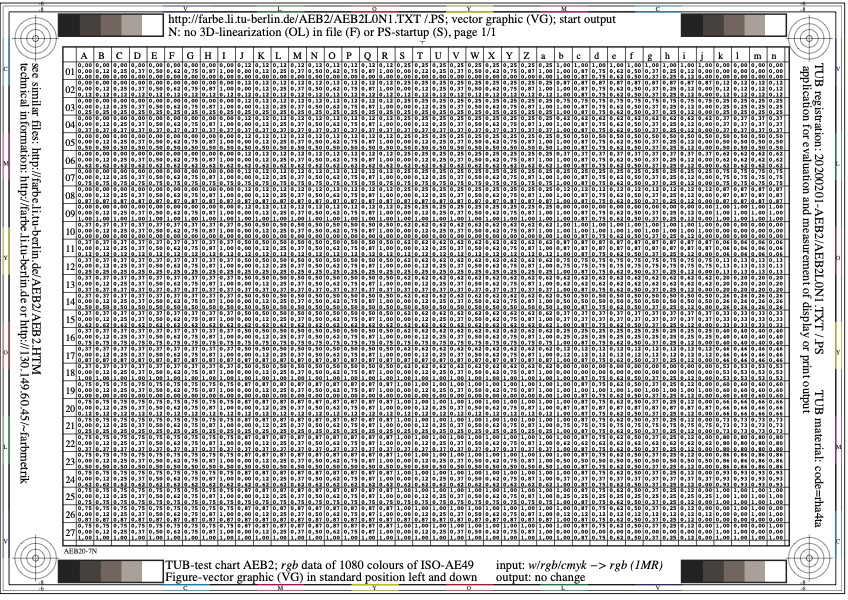
Figure AEB2L0N1.jpg: Output in format A6 of the file
AEB2L0NP.PDF, see
AEB2L0N1.
PS /
TXT /
PDF /
jpg
AEB2: TUB-test chart AEB2; rgb data of 1080 colours
of the test chart AE49 according to ISO 9241-306:218
calculated from the w/n/cmyk data with the 1-minus-relation 1MR

Figure AEB3L0N1.jpg: Output in format A6 of the file
AEB3L0NP.PDF, see
AEB3L0N1.
PS /
TXT /
PDF /
jpg
AEB3: TUB-test chart AEB3; PostScript-output steering of ISO-AE49
hand coded PS files of frame and 16 figures
application of 1-minus-relation, transfer 1 VG -> 1 VG and 2 PG

Figure AEB4L0N1.jpg: Output in format A6 of the file
AEB4L0NP.PDF, see
AEB4L0N1.
PS /
TXT /
PDF /
jpg
AEB4: TUB-test chart AEB4; PostScript-output steering of ISO-AE49
hand coded VG-PS files of frame and 16 figures
for 0,475 <= gammaP <=2,105, transfer of 1 VG -> 5 PG
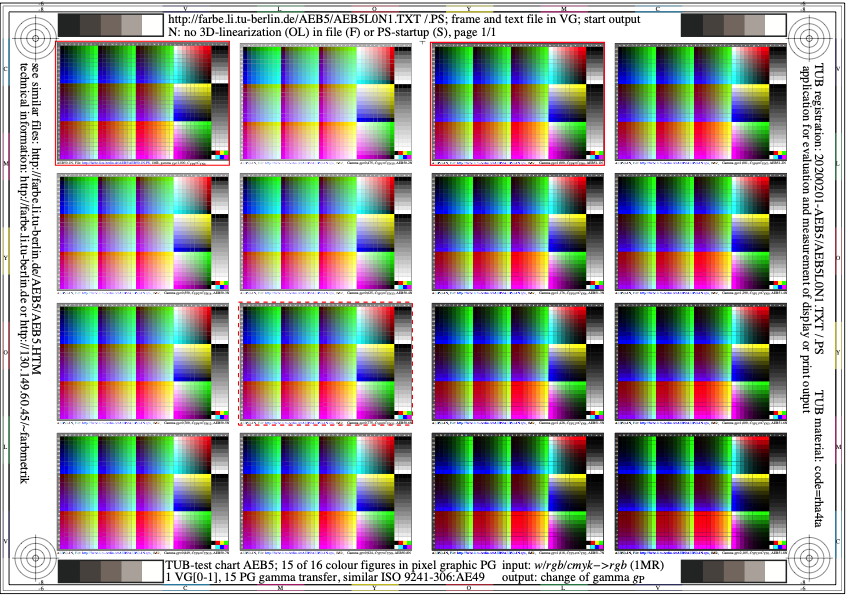
Figure AEB5L0N1.jpg: Output in format A6 of the file
AEB5L0NP.PDF, see
AEB5L0N1.
PS /
TXT /
PDF /
jpg
AEB5: TUB-test chart AEB5; PostScript-output steering of ISO-AE49
hand coded VG-PS files of frame and 16 figures
for 0,475 <= gammaP <=2,105, transfer of 1 VG -> 15 PG
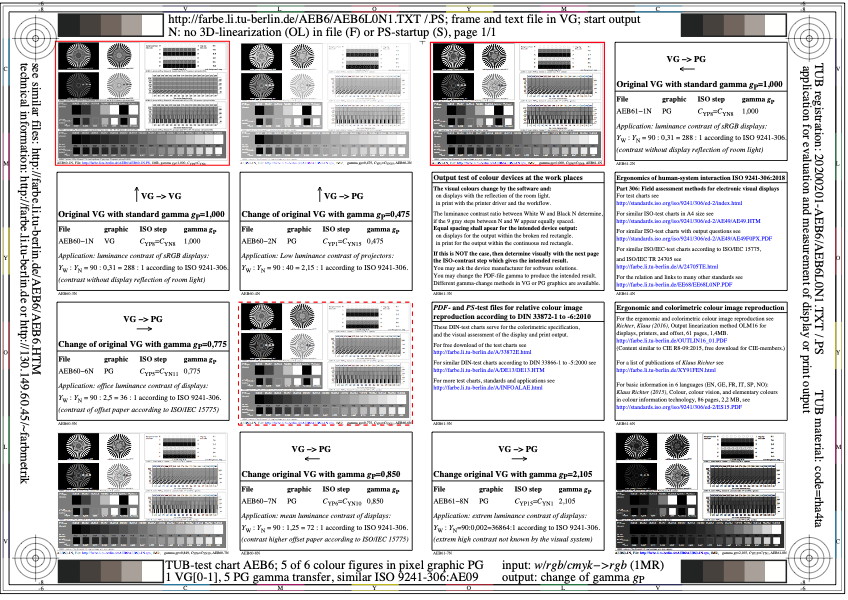
Figure AEB6L0N1.jpg: Output in format A6 of the file
AEB6L0NP.PDF, see
AEB6L0N1.
PS /
TXT /
PDF /
jpg
AEB6: TUB-test chart AEB6; PostScript-output steering of ISO-AE09
hand coded VG-PS files of frame and 16 figures
for 0,475 <= gammaP <=2,105, transfer of 1 VG -> 5 PG
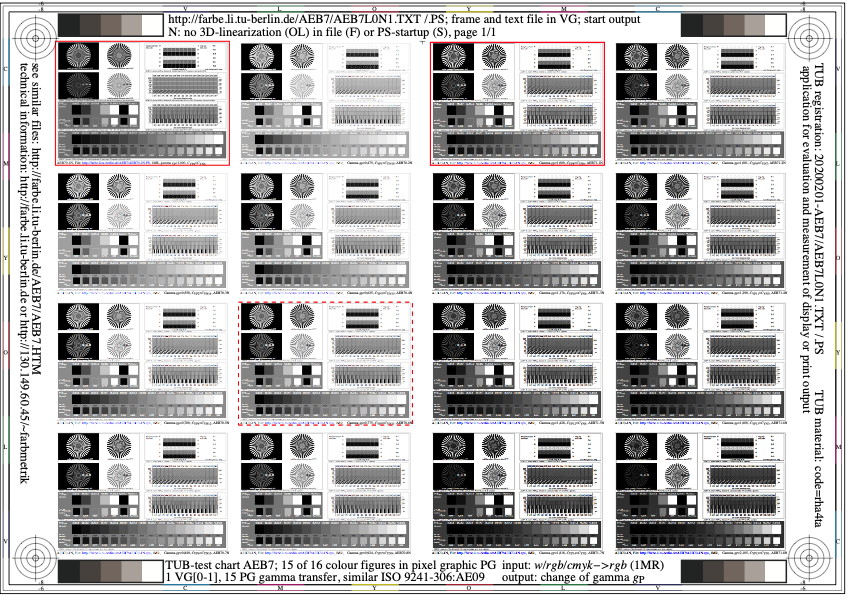
Figure AEB7L0N1.jpg: Output in format A6 of the file
AEB7L0NP.PDF, see
AEB7L0N1.
PS /
TXT /
PDF /
jpg
AEB7: TUB-test chart AEB7; PostScript-output steering of ISO-AE09
hand coded VG-PS files of frame and 16 figures
for 0,475 <= gammaP <=2,105, transfer of 1 VG -> 15 PG
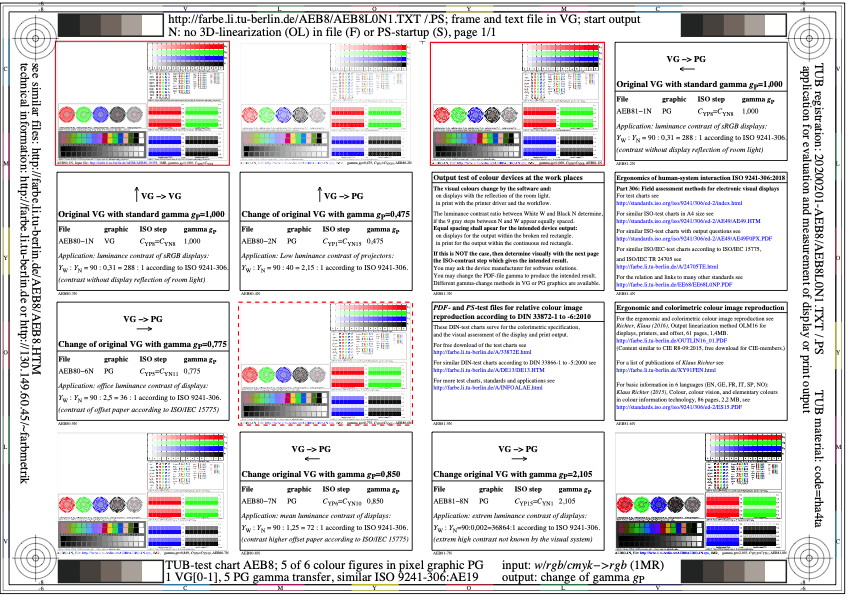
Figure AEB8L0N1.jpg: Output in format A6 of the file
AEB8L0NP.PDF, see
AEB8L0N1.
PS /
TXT /
PDF /
jpg
AEB8: TUB-test chart AEB8; PostScript-output steering of ISO-AE19
hand coded VG-PS files of frame and 16 figures
for 0,475 <= gammaP <=2,105, transfer of 1 VG -> 5 PG
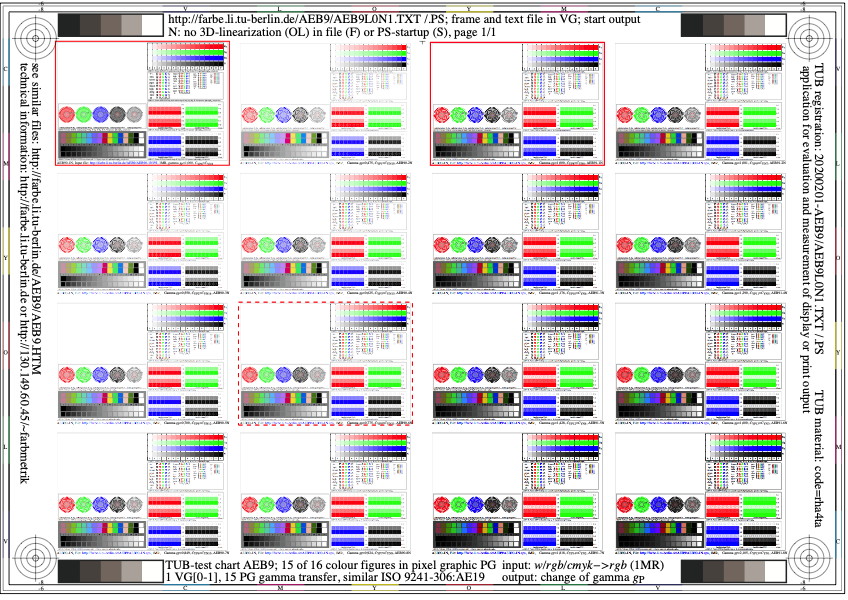
Figure AEB9L0N1.jpg: Output in format A6 of the file
AEB9L0NP.PDF, see
AEB9L0N1.
PS /
TXT /
PDF /
jpg
AEB9: TUB-test chart AEB9; PostScript-output steering of ISO-AE19
hand coded VG-PS files of frame and 16 figures
for 0,475 <= gammaP <=2,105, transfer of 1 VG -> 15 PG
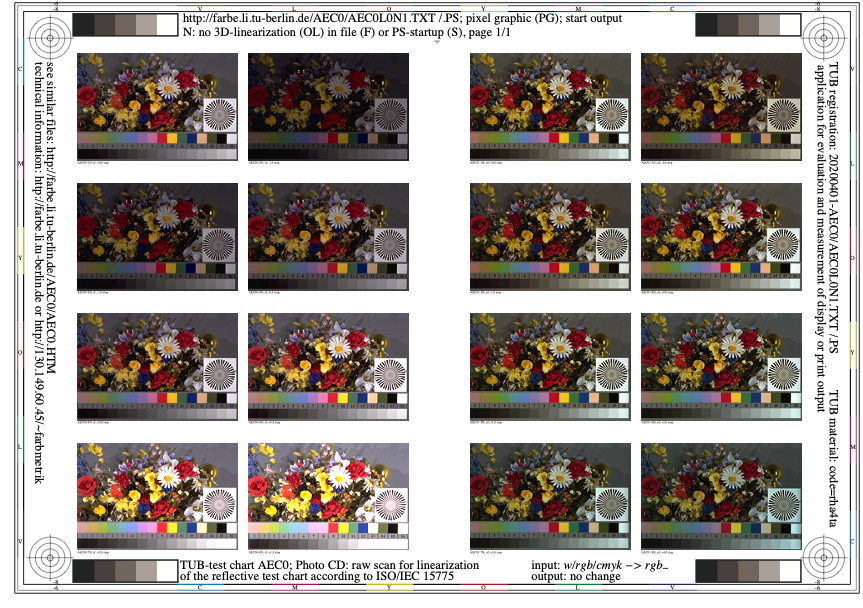
Figure AEC0L0N1.jpg: Output in format A6 of the file
AEC0L0NP.PDF, see
AEC0L0N1.
PS /
TXT /
PDF /
jpg
AEC0: TUB-Test chart AEC0; raw scan of slide film (sf, left)
and negative film (nf, right) of the reflective test chart
according to ISO/IEC 157
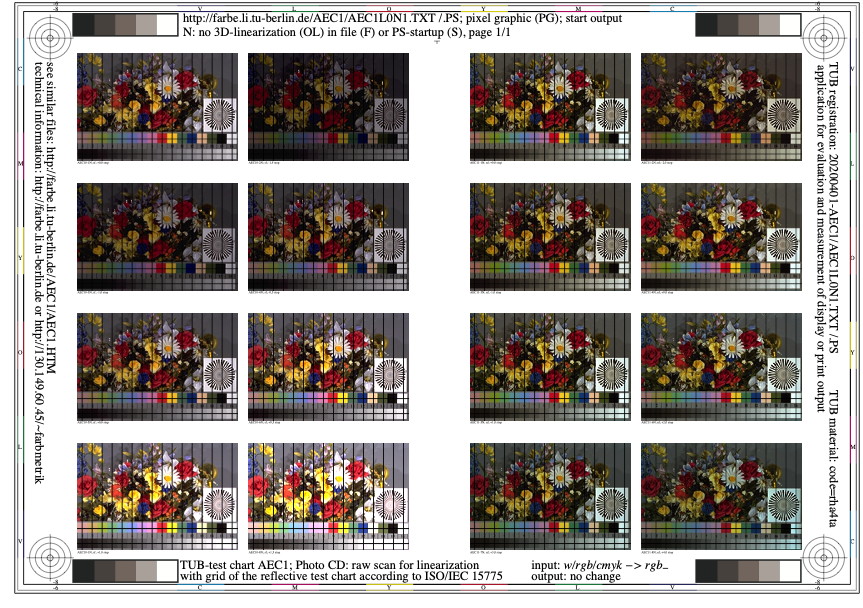
Figure AEC1L0N1.jpg: Output in format A6 of the file
AEC1L0NP.PDF, see
AEC1L0N1.
PS /
TXT /
PDF /
jpg
AEC1: TUB-Test chart AEC1; raw scan of slide film (sf, left)
and negative film (nf, right) of the reflective test chart
according to ISO/IEC 15775 with grid
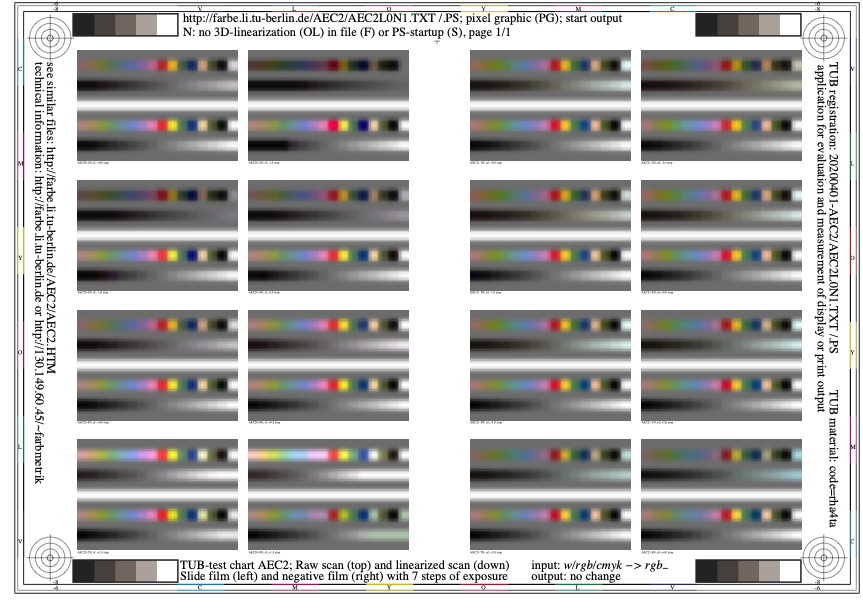
Figure AEC2L0N1.jpg: Output in format A6 of the file
AEC2L0NP.PDF, see
AEC2L0N1.
PS /
TXT /
PDF /
jpg
AEC2: TUB-Test chart AEC2; raw and linearized scan
of the 16 step gray scale and CIE-test colours
according to ISO/IEC 157
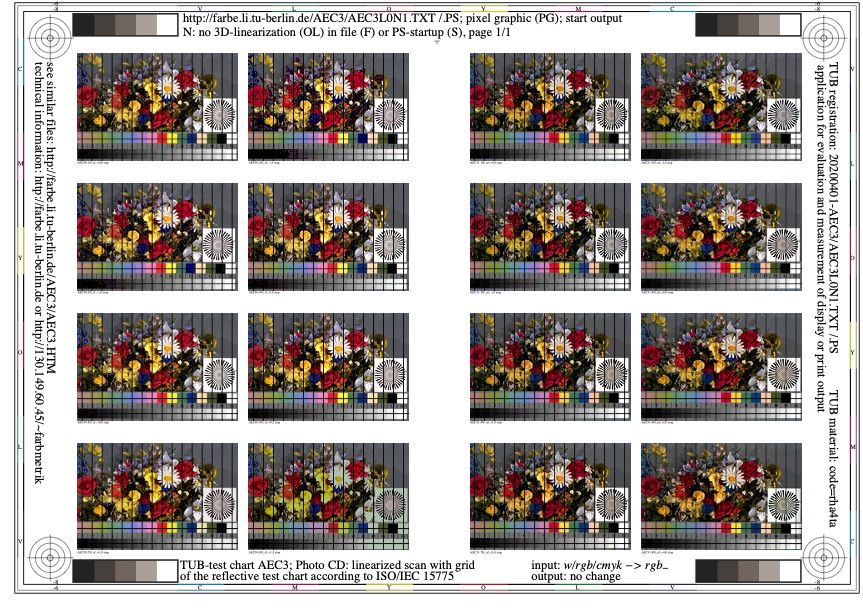
Figure AEC3L0N1.jpg: Output in format A6 of the file
AEC3L0NP.PDF, see
AEC3L0N1.
PS /
TXT /
PDF /
jpg
AEC3: TUB-Test chart AEC3; linearized scan of slide film (sf)
and negative film (nf) with grid of the reflective test chart
according to ISO/IEC 157
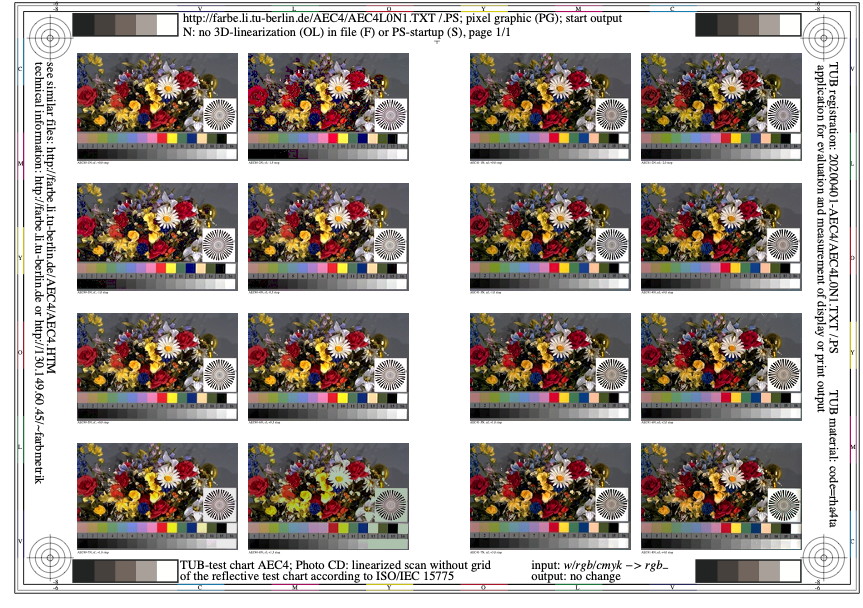
Figure AEC4L0N1.jpg: Output in format A6 of the file
AEC4L0NP.PDF, see
AEC4L0N1.
PS /
TXT /
PDF /
jpg
AEC4: TUB-Test chart AEC4; linearized scan of slide film (sf)
and negative film (nf) of the reflective test chart
according to ISO/IEC 157
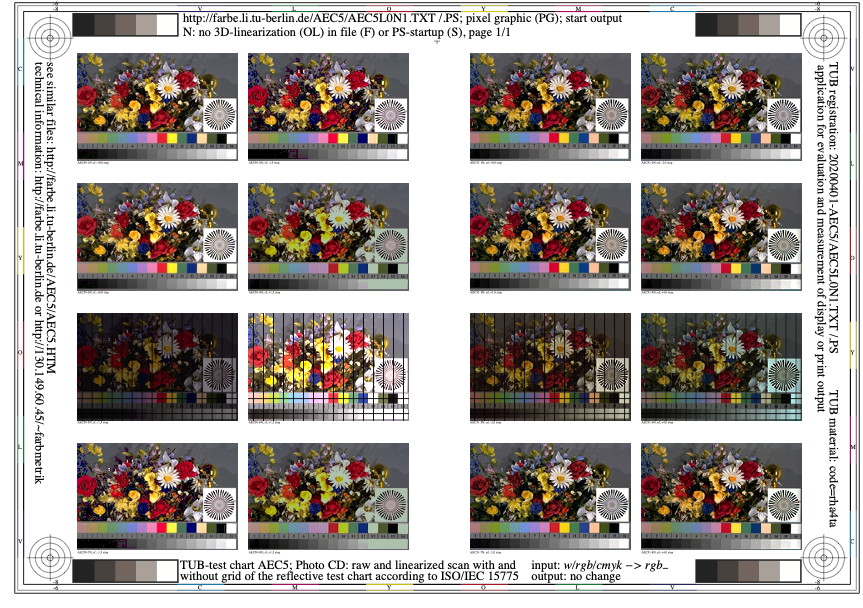
Figure AEC5L0N1.jpg: Output in format A6 of the file
AEC5L0NP.PDF, see
AEC5L0N1.
PS /
TXT /
PDF /
jpg
AEC5: TUB-Test chart AEC5; raw and linearized scan
with and without grid of the reflective test chart
according to ISO/IEC 157
Figure AEC6L0N1.jpg: Output in format A6 of the file
AEC6L0NP.PDF, see
AEC6L0N1.
PS /
TXT /
PDF /
jpg
AEC6: TUB-test chart AEC6; ISO/IEC image in rgb-pixel graphic
slidefilm (sf), 3 colorimage, see ISO/IEC 15775 and ISO 9241-30
4 image resolutions 192x128, 384x256, 768x512, 1536x102
Figure AEC7L0N1.jpg: Output in format A6 of the file
AEC7L0NP.PDF, see
AEC7L0N1.
PS /
TXT /
PDF /
jpg
AEC7: TUB-test chart AEC7; ISO/IEC image in rgb-pixel graphic
negative film (nf), 3 colorimage, ISO/IEC 15775 and ISO 9241-30
4 image resolutions 192x128, 384x256, 768x512, 1536x102
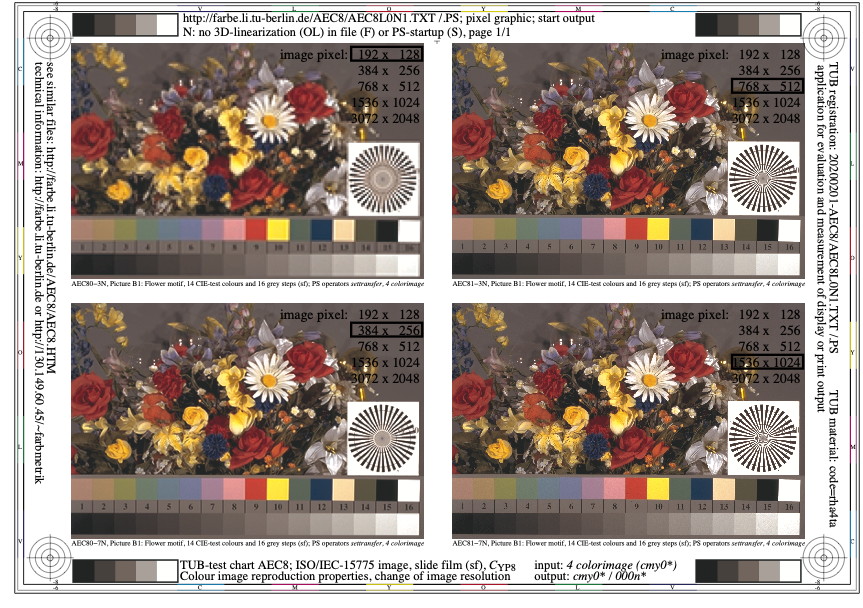
Figure AEC8L0N1.jpg: Output in format A6 of the file
AEC8L0NP.PDF, see
AEC8L0N1.
PS /
TXT /
PDF /
jpg
AEC8: TUB-test chart AEC8; ISO/IEC image in cmy0-pixel graphic
slidefilm (sf), 4 colorimage, see ISO/IEC 15775 and ISO 9241-30
4 image resolutions 192x128, 384x256, 768x512, 1536x102
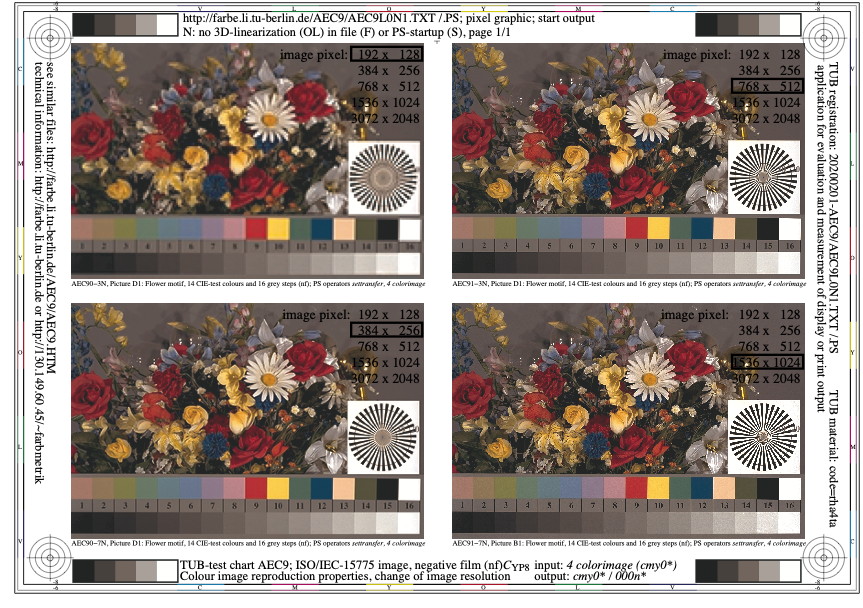
Figure AEC9L0N1.jpg: Output in format A6 of the file
AEC9L0NP.PDF, see
AEC9L0N1.
PS /
TXT /
PDF /
jpg
AEC9: TUB-test chart AEC9; ISO/IEC image in cmy0-pixel graphic
negative film (nf), 4 colorimage, ISO/IEC 15775 and ISO 9241-30
4 image resolutions 192x128, 384x256, 768x512, 1536x102
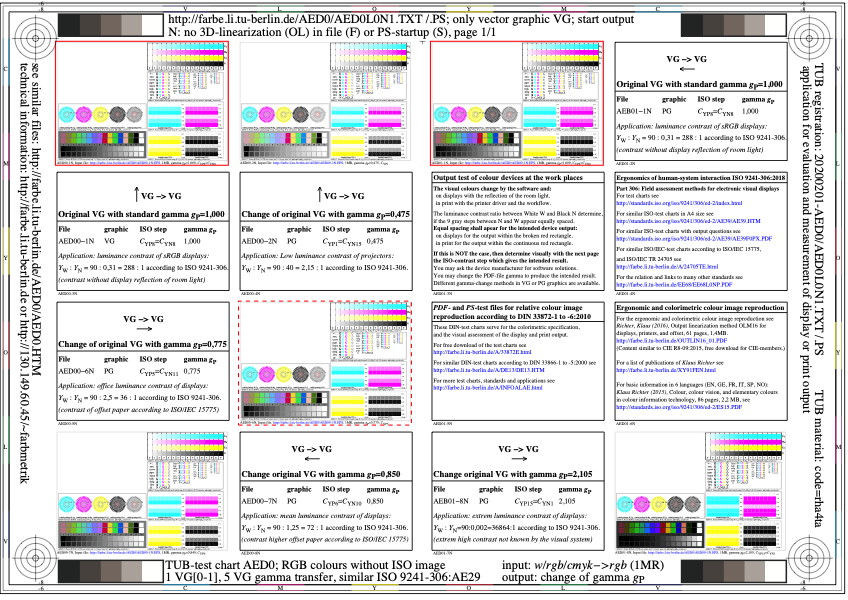
Figure AED0L0N1.jpg: Output in format A6 of the file
AED0L0NP.PDF, see
AED0L0N1.
PS /
TXT /
PDF /
jpg
AED0: TUB-test chart AED0; CMYK colours without ISO/IEC image
1 VG[0-1], transfer to 5 VG[0-2, 0-6, 0-7, 1-1, 1-8] with text
5 VG with 0,475<=gp<=2,105, similar to ISO 9241-306:AG2

Figure AED1L0N1.jpg: Output in format A6 of the file
AED1L0NP.PDF, see
AED1L0N1.
PS /
TXT /
PDF /
jpg
AED1: TUB-test chart AED1; CMYK colours without ISO/IEC image
1 VG[0-1], transfer to 15 VG[0-2 to 0-8, 1-1 to 1-8]
15 VG with 0,475<=gp<=2,105, similar to ISO 9241-306:AG2
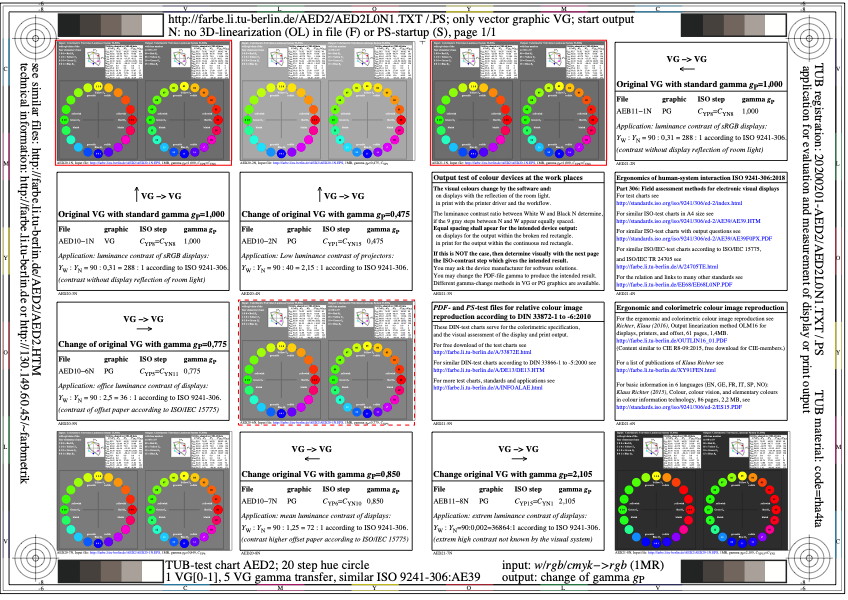
Figure AED2L0N1.jpg: Output in format A6 of the file
AED2L0NP.PDF, see
AED2L0N1.
PS /
TXT /
PDF /
jpg
AED2: TUB-test chart AED2; 20 step hue circle
1 VG[0-1], transfer to 5 VG[0-2, 0-6, 0-7, 1-1, 1-8] with text
5 VG with 0,475<=gp<=2,105, similar to ISO 9241-306:AG3

Figure AED3L0N1.jpg: Output in format A6 of the file
AED3L0NP.PDF, see
AED3L0N1.
PS /
TXT /
PDF /
jpg
AED3: TUB-test chart AED3; 20 step hue circle
1 VG[0-1], transfer to 15 VG[0-2 to 0-8, 1-1 to 1-8]
15 VG with 0,475<=gp<=2,105, similar to ISO 9241-306:AG3
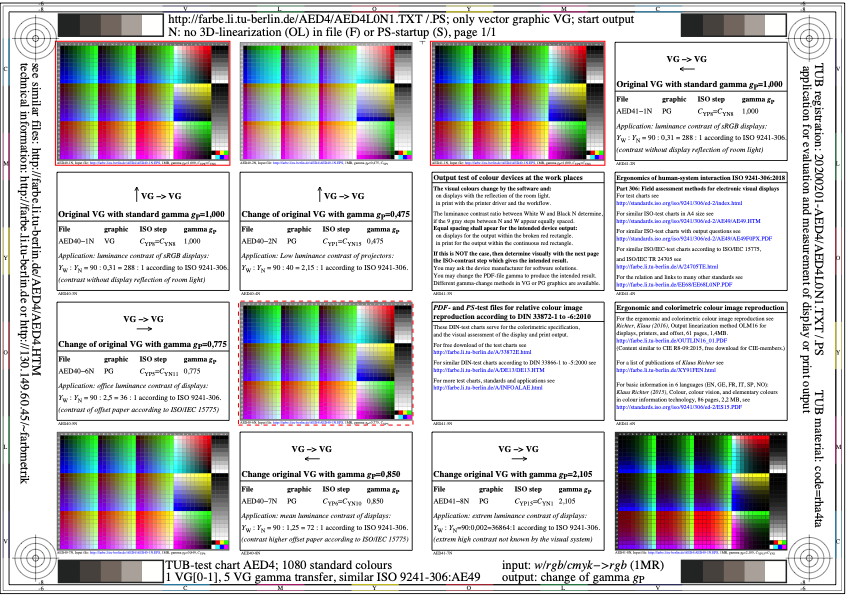
Figure AED4L0N1.jpg: Output in format A6 of the file
AED4L0NP.PDF, see
AED4L0N1.
PS /
TXT /
PDF /
jpg
AED4: TUB-test chart AED4; 1080 standard colours, Code (row/column)
1 VG[0-1], transfer to 5 VG[0-2, 0-6, 0-7, 1-1, 1-8] with text
5 VG with 0,475<=gp<=2,105, similar to ISO 9241-306:AG4
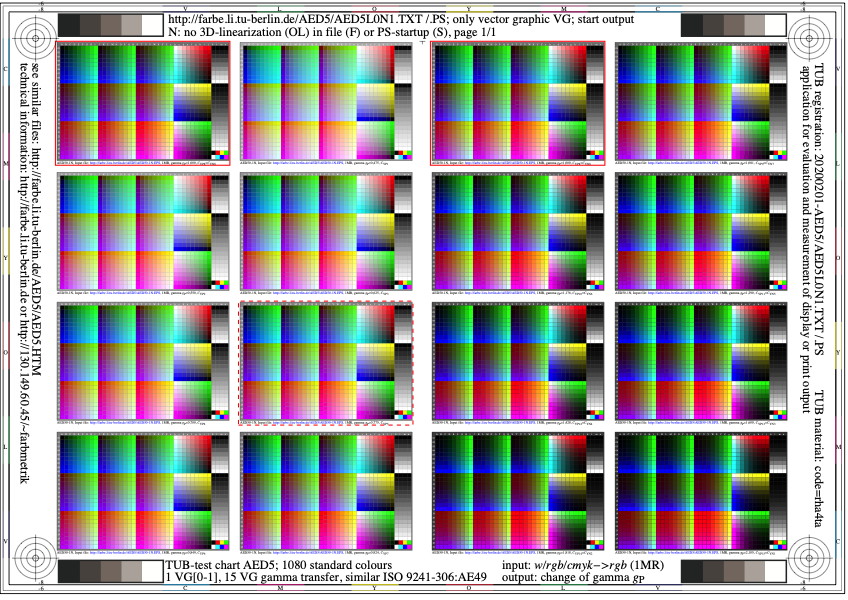
Figure AED5L0N1.jpg: Output in format A6 of the file
AED5L0NP.PDF, see
AED5L0N1.
PS /
TXT /
PDF /
jpg
AED5: TUB-test chart AED5; 1080 standard colours, Code (row/column)
1 VG[0-1], transfer to 15 VG[0-2 to 0-8, 1-1 to 1-8]
15 VG with 0,475<=gp<=2,105, similar to ISO 9241-306:AG4
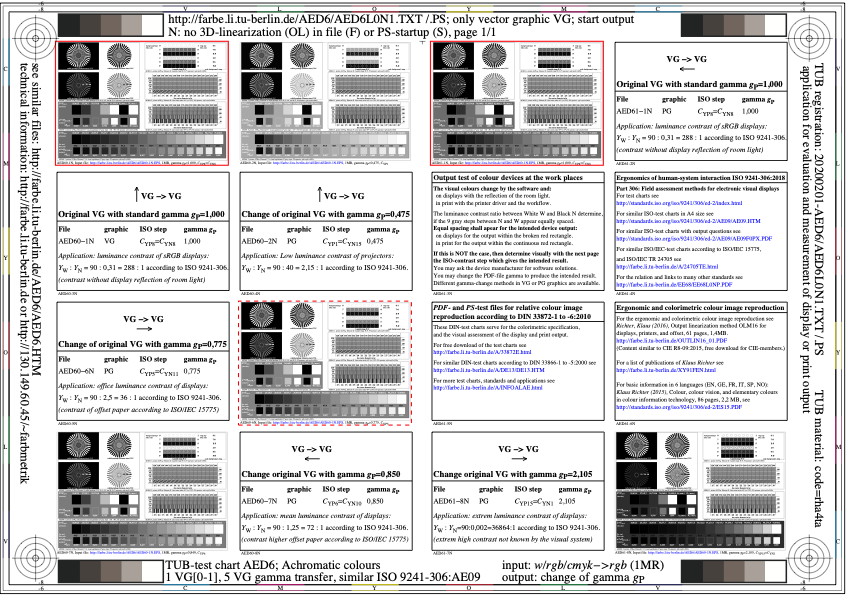
Figure AED6L0N1.jpg: Output in format A6 of the file
AED6L0NP.PDF, see
AED6L0N1.
PS /
TXT /
PDF /
jpg
AED6: TUB-test chart AED6; achromatic standard elements
1 VG[0-1], transfer to 5 VG[0-2, 0-6, 0-7, 1-1, 1-8] with text
5 VG with 0,475<=gp<=2,105, similar to ISO 9241-306:AG0
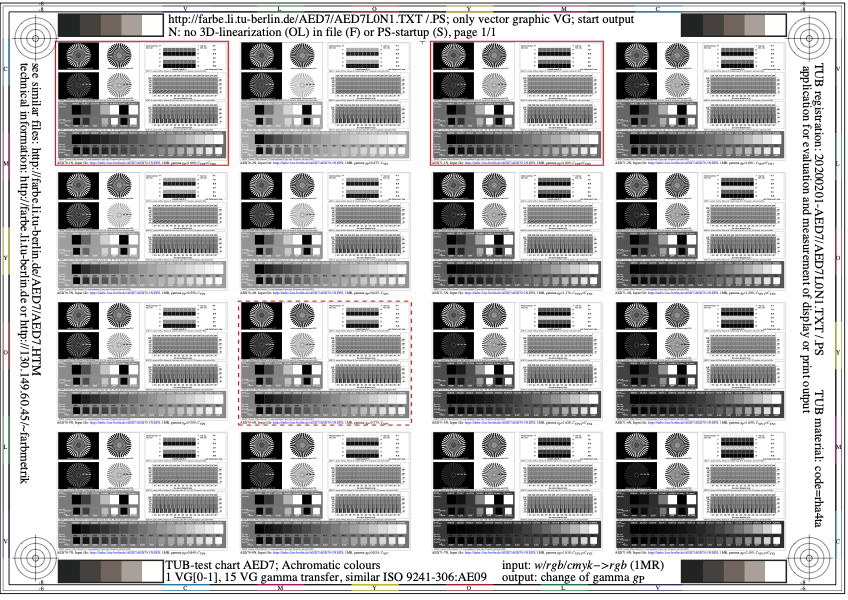
Figure AED7L0N1.jpg: Output in format A6 of the file
AED7L0NP.PDF, see
AED7L0N1.
PS /
TXT /
PDF /
jpg
AED7: TUB-test chart AED7; achromatic standard elements
1 VG[0-1], transfer to 15 VG[0-2 to 0-8, 1-1 to 1-8]
15 VG with 0,475<=gp<=2,105, similar to ISO 9241-306:AG0
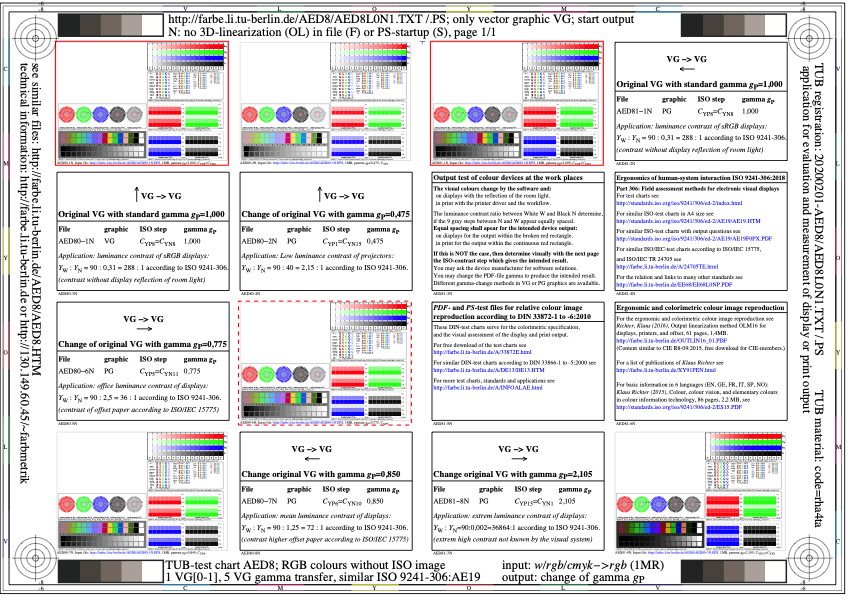
Figure AED8L0N1.jpg: Output in format A6 of the file
AED8L0NP.PDF, see
AED8L0N1.
PS /
TXT /
PDF /
jpg
AED8: TUB-test chart AED8; RGB colours without ISO/IEC image
1 VG[0-1], transfer to 5 VG[0-2, 0-6, 0-7, 1-1, 1-8] with text
5 VG with 0,475<=gp<=2,105, similar to ISO 9241-306:AG1
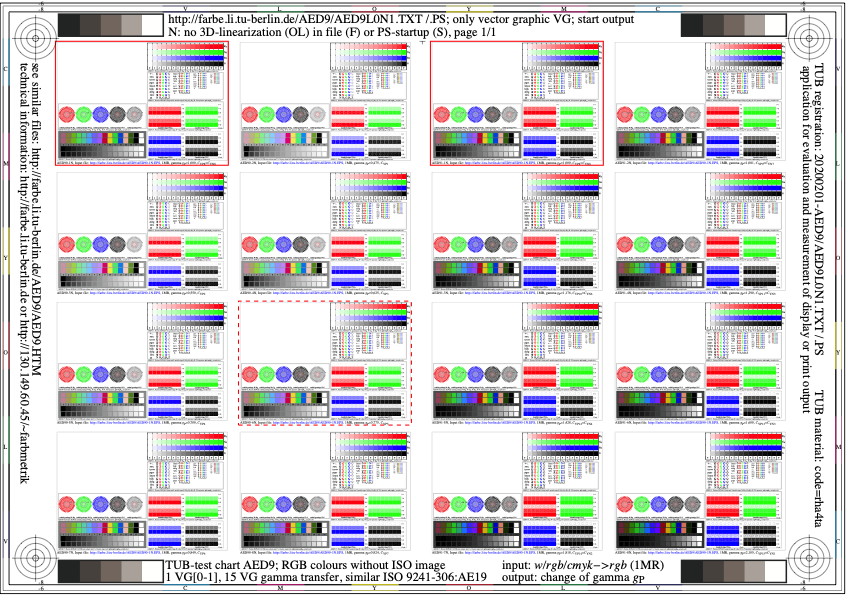
Figure AED9L0N1.jpg: Output in format A6 of the file
AED9L0NP.PDF, see
AED9L0N1.
PS /
TXT /
PDF /
jpg
AED9: TUB-test chart AED9; RGB colours without ISO/IEC image
1 VG[0-1], transfer to 15 VG[0-2 to 0-8, 1-1 to 1-8]
15 VG with 0,475<=gp<=2,105, similar to ISO 9241-306:AG1
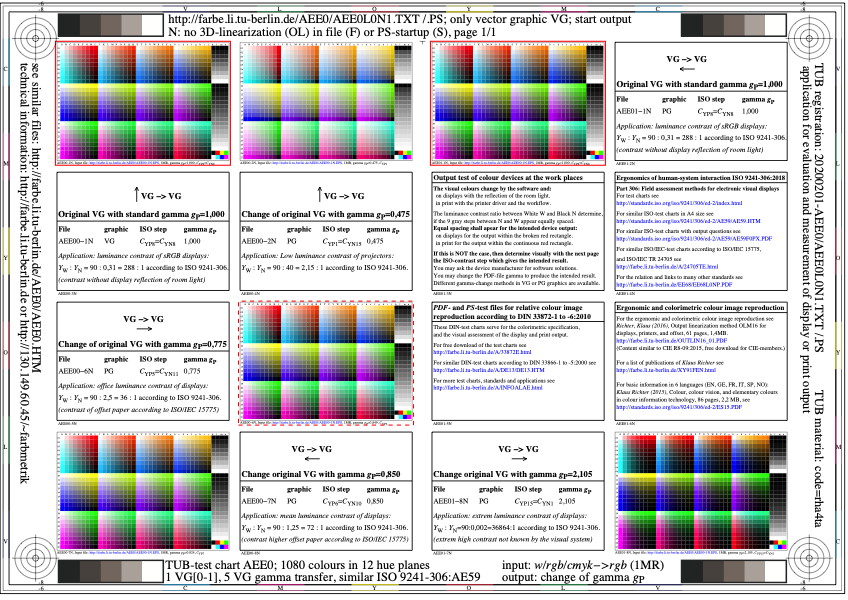
Figure AEE0L0N1.jpg: Output in format A6 of the file
AEE0L0NP.PDF, see
AEE0L0N1.
PS /
TXT /
PDF /
jpg
AEE0: TUB-test chart AEE0; 1080 colours in 12 hue planes
1 VG[0-1], transfer to 5 VG[0-2, 0-6, 0-7, 1-1, 1-8] with text
5 VG with 0,475<=gp<=2,105, similar to ISO 9241-306:AG5
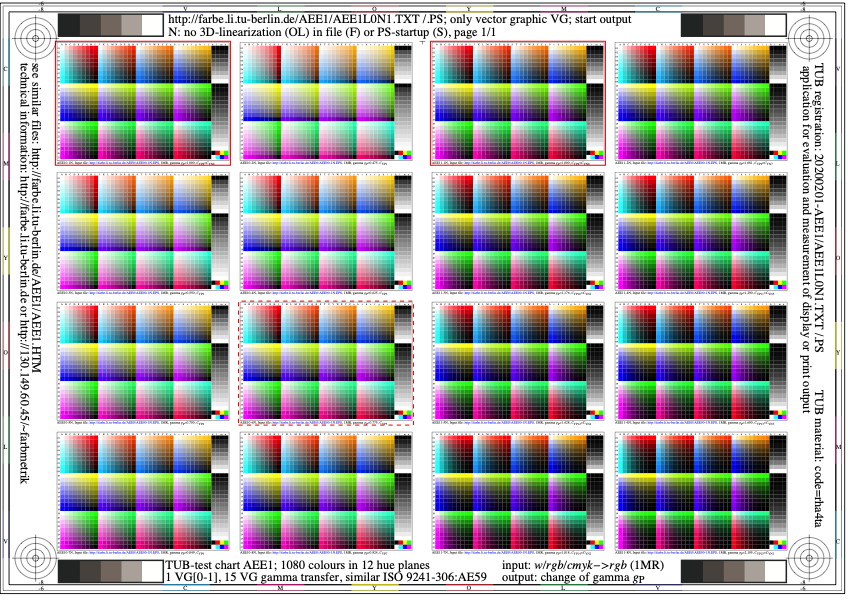
Figure AEE1L0N1.jpg: Output in format A6 of the file
AEE1L0NP.PDF, see
AEE1L0N1.
PS /
TXT /
PDF /
jpg
AEE1: TUB-test chart AEE1; 1080 colours in 12 hue planes
1 VG[0-1], transfer to 15 VG[0-2 to 0-8, 1-1 to 1-8]
15 VG with 0,475<=gp<=2,105, similar to ISO 9241-306:AG5
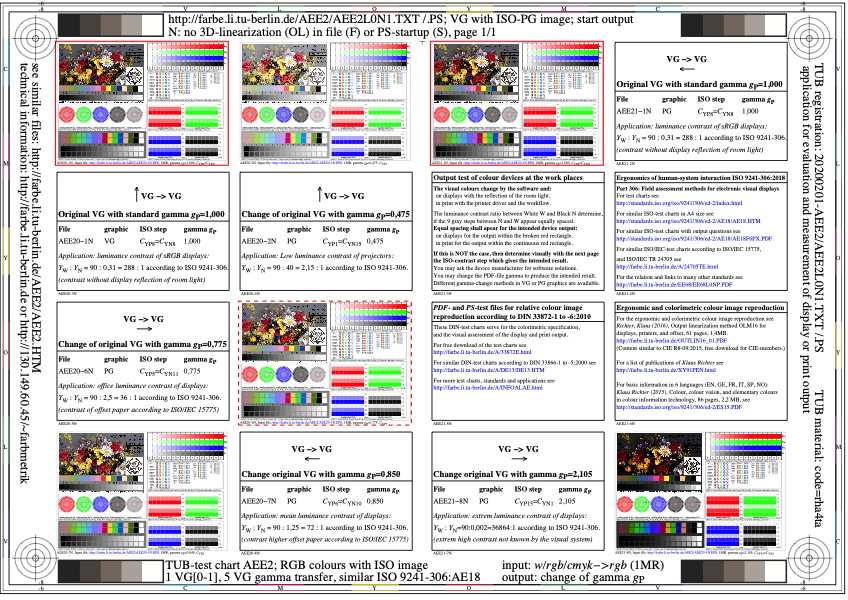
Figure AEE2L0N1.jpg: Output in format A6 of the file
AEE2L0NP.PDF, see
AEE2L0N1.
PS /
TXT /
PDF /
jpg
AEE2: TUB-test chart AEE2; RGB colours with ISO/IEC image
1 VG[0-1], transfer to 5 VG[0-2, 0-6, 0-7, 1-1, 1-8] with text
5 VG with 0,475<=gp<=2,105, similar to ISO 9241-306:AG1
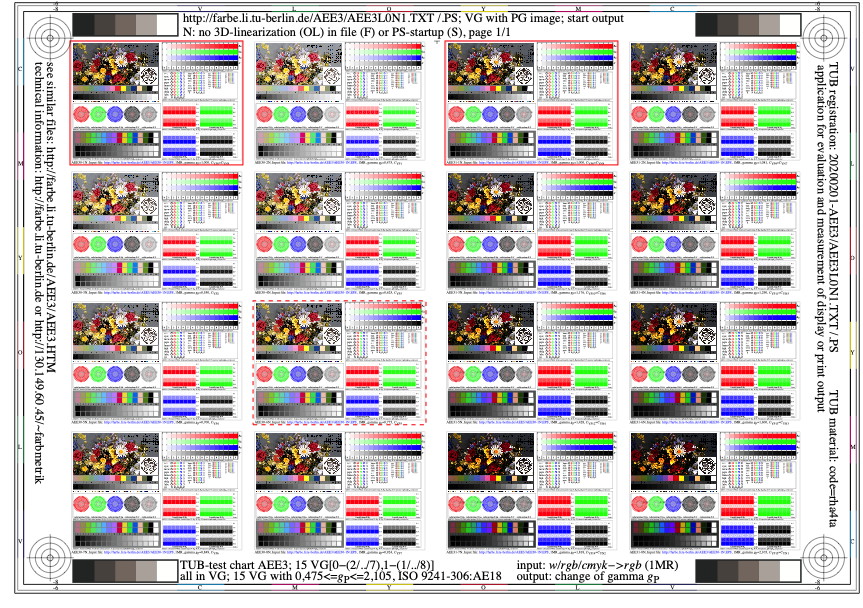
Figure AEE3L0N1.jpg: Output in format A6 of the file
AEE3L0NP.PDF, see
AEE3L0N1.
PS /
TXT /
PDF /
jpg
AEE3: TUB-test chart AEE3; RGB colours with ISO/IEC image
1 VG[0-1], transfer to 15 VG[0-2 to 0-8, 1-1 to 1-8]
15 VG with 0,475<=gp<=2,105, similar to ISO 9241-306:AG1
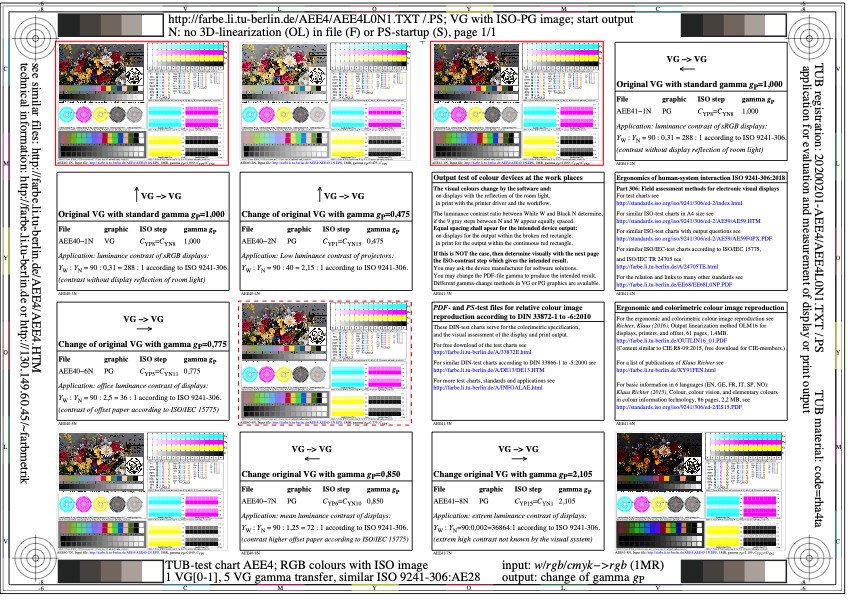
Figure AEE4L0N1.jpg: Output in format A6 of the file
AEE4L0NP.PDF, see
AEE4L0N1.
PS /
TXT /
PDF /
jpg
AEE4: TUB-test chart AEE4; CMYK colours with ISO/IEC image
1 VG[0-1], transfer to 5 VG[0-2, 0-6, 0-7, 1-1, 1-8] with text
5 VG with 0,475<=gp<=2,105, similar to ISO 9241-306:AG2
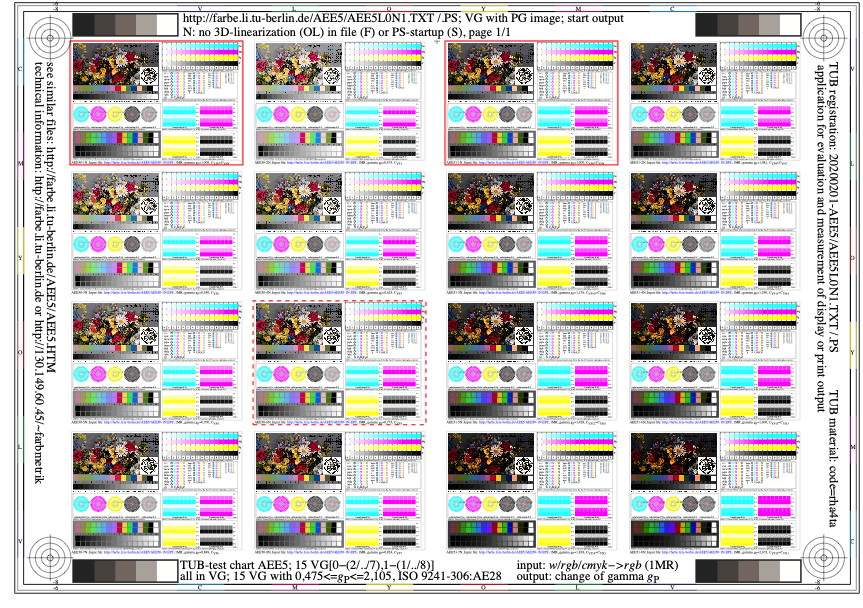
Figure AEE5L0N1.jpg: Output in format A6 of the file
AEE5L0NP.PDF, see
AEE5L0N1.
PS /
TXT /
PDF /
jpg
AEE5: TUB-test chart AEE5; CMYK colours with ISO/IEC image
1 VG[0-1], transfer to 15 VG[0-2 to 0-8, 1-1 to 1-8]
15 VG with 0,475<=gp<=2,105, similar to ISO 9241-306:AG2
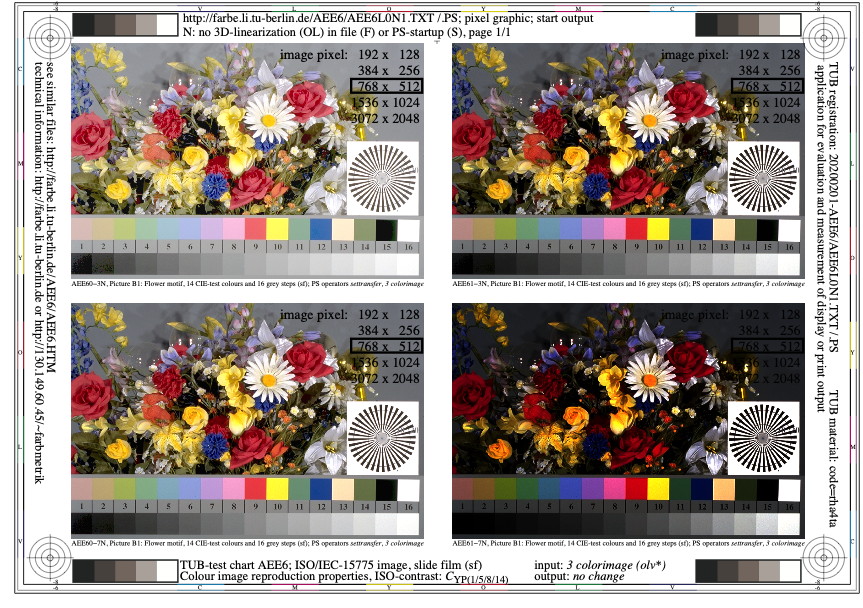
Figure AEE6L0N1.jpg: Output in format A6 of the file
AEE6L0NP.PDF, see
AEE6L0N1.
PS /
TXT /
PDF /
jpg
AEE6: TUB-test chart AEE6; ISO/IEC image in rgb-pixel graphic
slidefilm (sf), 3 colorimage, see ISO/IEC 15775 and ISO 9241-30
four contrasts gP=0,475; 0,775; 1,000; 2,105 (CYP1,P5,P8,P15)
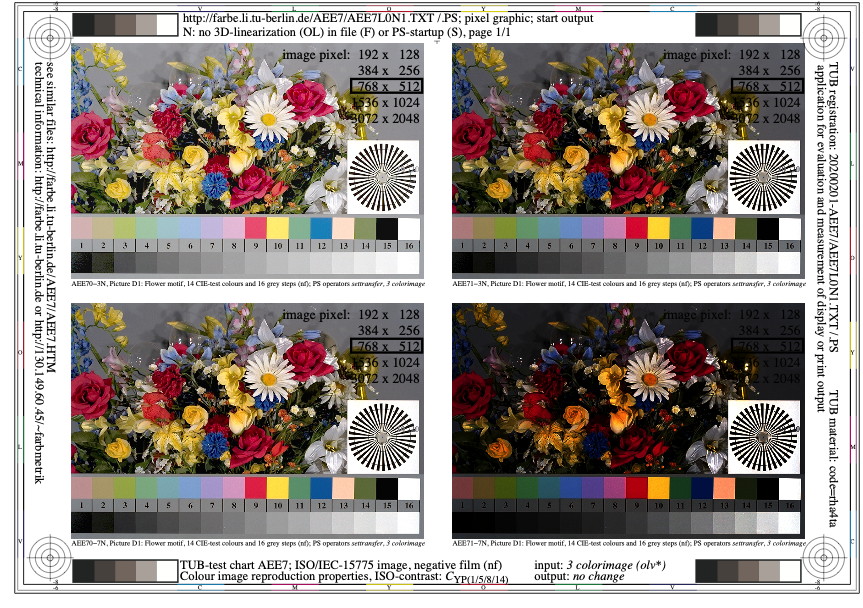
Figure AEE7L0N1.jpg: Output in format A6 of the file
AEE7L0NP.PDF, see
AEE7L0N1.
PS /
TXT /
PDF /
jpg
AEE7: TUB-test chart AEE7; ISO/IEC image in rgb-pixel graphic
negative film (nf), 3 colorimage, ISO/IEC 15775 and ISO 9241-30
four contrasts gP=0,475; 0,775; 1,000; 2,105 (CYP1,P5,P8,P15)
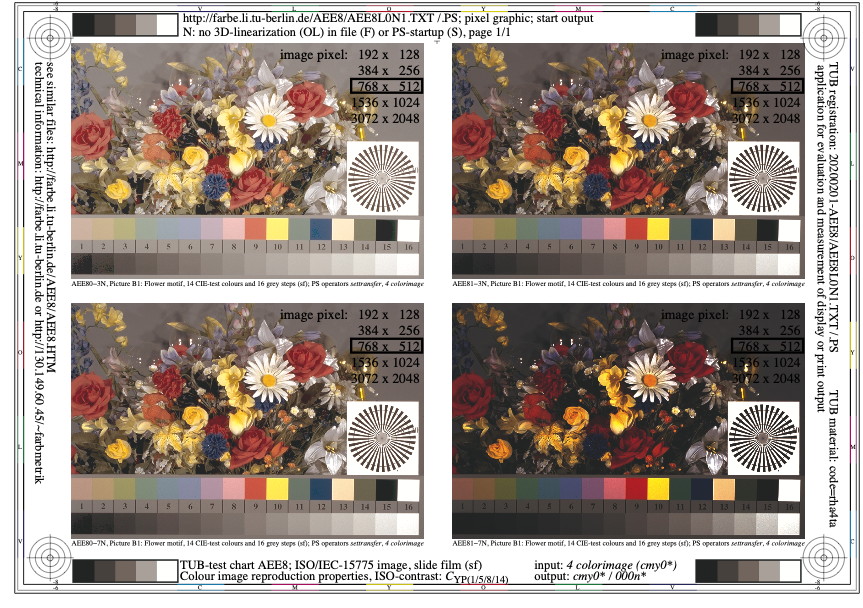
Figure AEE8L0N1.jpg: Output in format A6 of the file
AEE8L0NP.PDF, see
AEE8L0N1.
PS /
TXT /
PDF /
jpg
AEE8: TUB-test chart AEE8; ISO/IEC image in cmy0-pixel graphic
slidefilm (sf), 4 colorimage, see ISO/IEC 15775 and ISO 9241-30
four contrasts gP=0,475; 0,775; 1,000; 2,105 (CYP1,P5,P8,P15)
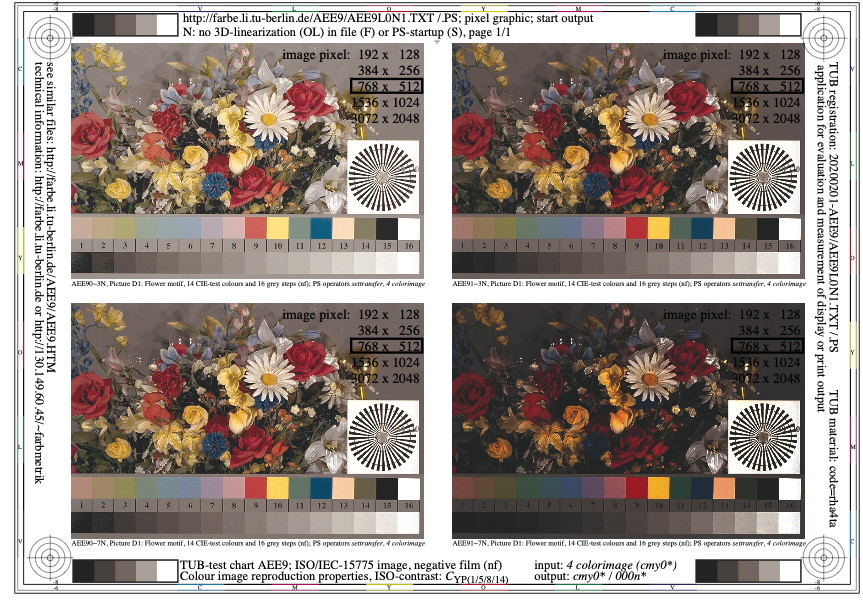
Figure AEE9L0N1.jpg: Output in format A6 of the file
AEE9L0NP.PDF, see
AEE9L0N1.
PS /
TXT /
PDF /
jpg
AEE9: TUB-test chart AEE9; ISO/IEC image in cmy0-pixel graphic
negative film (nf), 4 colorimage, ISO/IEC 15775 and ISO 9241-30
four contrasts gP=0,475; 0,775; 1,000; 2,105 (CYP1,P5,P8,P15)
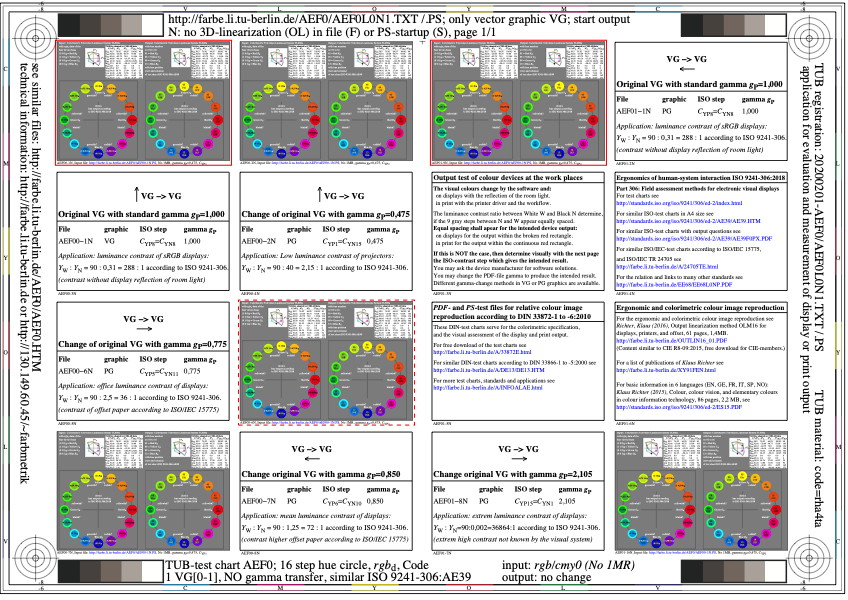
Figure AEF0L0N1.jpg: Output in format A6 of the file
AEF0L0NP.PDF, see
AEF0L0N1.
PS /
TXT /
PDF /
jpg
AEF0: TUB-test chart AEF0; 16 step hue circle, (rgb+cym0)d
1 VG[0-1], transfer to 5 VG[0-2, 0-6, 0-7, 1-1, 1-8] with text
5 VG with 0,475<=gp<=2,105, similar to ISO 9241-306:AG3
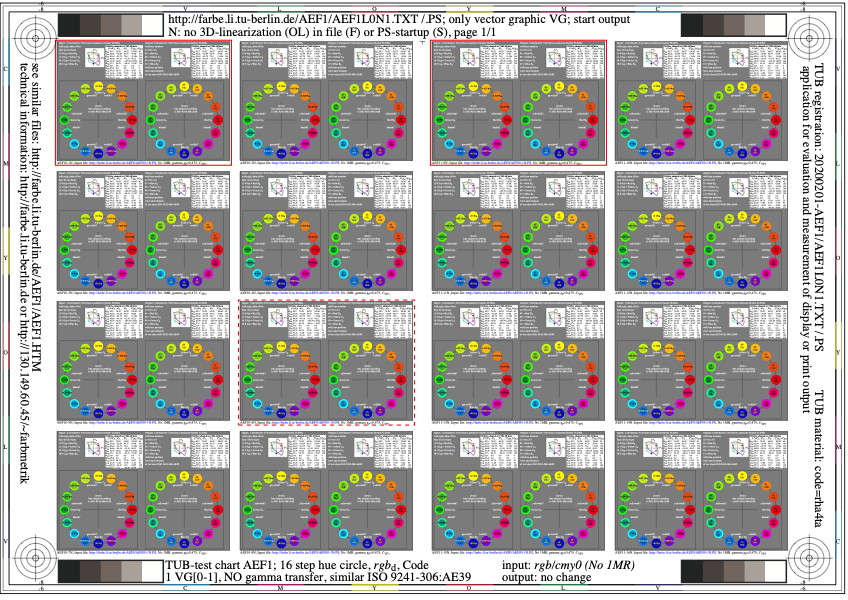
Figure AEF1L0N1.jpg: Output in format A6 of the file
AEF1L0NP.PDF, see
AEF1L0N1.
PS /
TXT /
PDF /
jpg
AEF1: TUB-test chart AEF1; 16 step hue circle, (rgb+cmy0)d
1 VG[0-1], transfer to 15 VG[0-2 to 0-8, 1-1 to 1-8]
15 VG with 0,475<=gp<=2,105, similar to ISO 9241-306:AG3
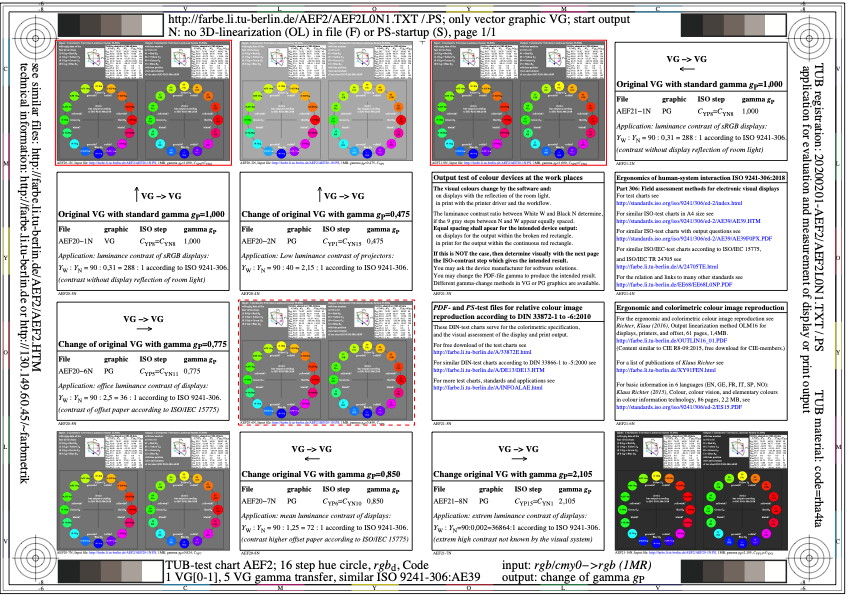
Figure AEF2L0N1.jpg: Output in format A6 of the file
AEF2L0NP.PDF, see
AEF2L0N1.
PS /
TXT /
PDF /
jpg
AEF2: TUB-test chart AEF2; 16 step hue circle, (rgb)d
1 VG[0-1], transfer to 5 VG[0-2, 0-6, 0-7, 1-1, 1-8] with text
5 VG with 0,475<=gp<=2,105, similar to ISO 9241-306:AG3

Figure AEF3L0N1.jpg: Output in format A6 of the file
AEF3L0NP.PDF, see
AEF3L0N1.
PS /
TXT /
PDF /
jpg
AEF3: TUB-test chart AEF3; 16 step hue circle, (rgb)d
1 VG[0-1], transfer to 15 VG[0-2 to 0-8, 1-1 to 1-8]
15 VG with 0,475<=gp<=2,105, similar to ISO 9241-306:AG3

Figure AEF4L0N1.jpg: Output in format A6 of the file
AEF4L0NP.PDF, see
AEF4L0N1.
PS /
TXT /
PDF /
jpg
AEF4: TUB-test chart AEF4; 16 step hue circle, (rgb)de
1 VG[0-1], transfer to 5 VG[0-2, 0-6, 0-7, 1-1, 1-8] with text
5 VG with 0,475<=gp<=2,105, similar to ISO 9241-306:AG3

Figure AEF5L0N1.jpg: Output in format A6 of the file
AEF5L0NP.PDF, see
AEF5L0N1.
PS /
TXT /
PDF /
jpg
AEF5: TUB-test chart AEF5; 16 step hue circle, (rgb)de
1 VG[0-1], transfer to 15 VG[0-2 to 0-8, 1-1 to 1-8]
15 VG with 0,475<=gp<=2,105, similar to ISO 9241-306:AG3
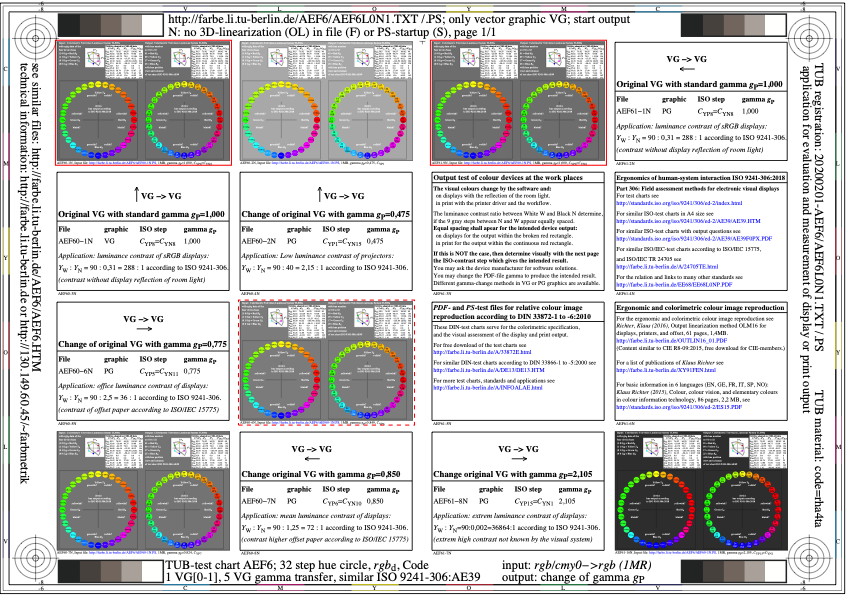
Figure AEF6L0N1.jpg: Output in format A6 of the file
AEF6L0NP.PDF, see
AEF6L0N1.
PS /
TXT /
PDF /
jpg
AEF6: TUB-test chart AEF6; 32 step hue circle, (rgb)d
1 VG[0-1], transfer to 5 VG[0-2, 0-6, 0-7, 1-1, 1-8] with text
5 VG with 0,475<=gp<=2,105, similar to ISO 9241-306:AG3

Figure AEF7L0N1.jpg: Output in format A6 of the file
AEF7L0NP.PDF, see
AEF7L0N1.
PS /
TXT /
PDF /
jpg
AEF7: TUB-test chart AEF7; 32 step hue circle, (rgb)d
1 VG[0-1], transfer to 15 VG[0-2 to 0-8, 1-1 to 1-8]
15 VG with 0,475<=gp<=2,105, similar to ISO 9241-306:AG3
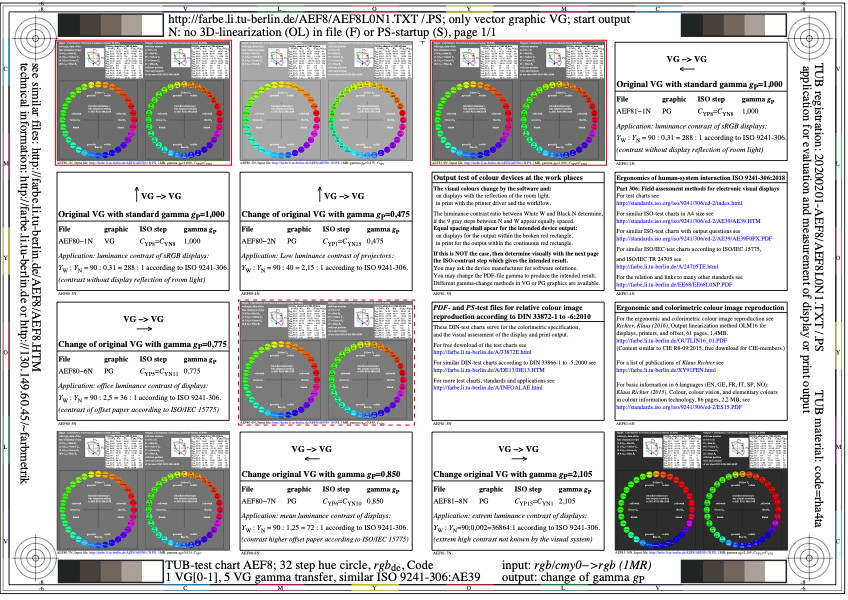
Figure AEF8L0N1.jpg: Output in format A6 of the file
AEF8L0NP.PDF, see
AEF8L0N1.
PS /
TXT /
PDF /
jpg
AEF8: TUB-test chart AEF8; 32 step hue circle, (rgb)de
1 VG[0-1], transfer to 5 VG[0-2, 0-6, 0-7, 1-1, 1-8] with text
5 VG with 0,475<=gp<=2,105, similar to ISO 9241-306:AG3
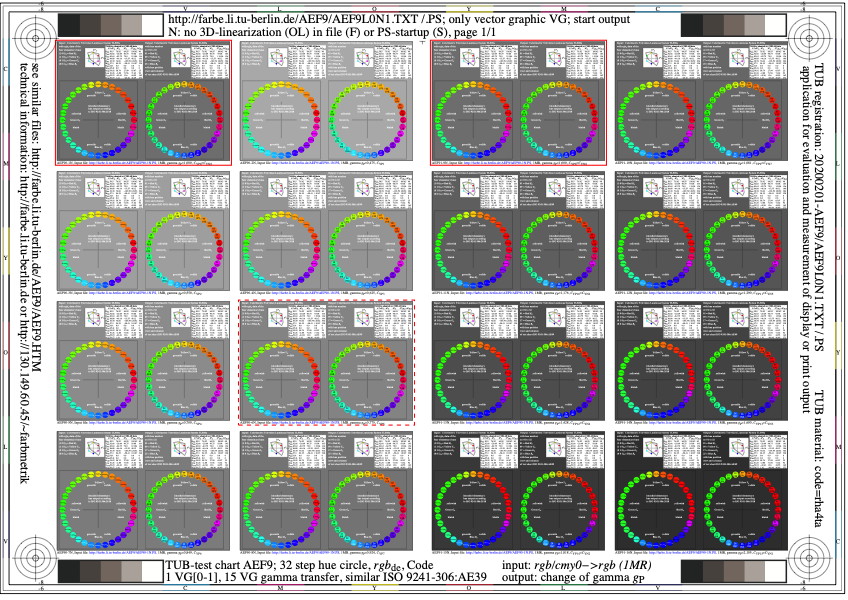
Figure AEF9L0N1.jpg: Output in format A6 of the file
AEF9L0NP.PDF, see
AEF9L0N1.
PS /
TXT /
PDF /
jpg
AEF9: TUB-test chart AEF9; 32 step hue circle, (rgb)de
1 VG[0-1], transfer to 15 VG[0-2 to 0-8, 1-1 to 1-8]
15 VG with 0,475<=gp<=2,105, similar to ISO 9241-306:AG3
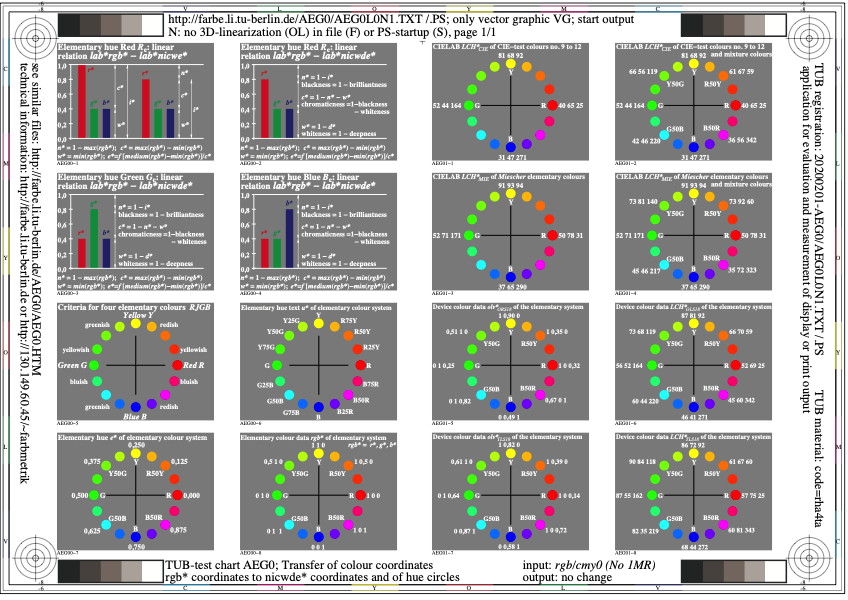
Figure AEG0L0N1.jpg: Output in format A6 of the file
AEG0L0NP.PDF, see
AEG0L0N1.
PS /
TXT /
PDF /
jpg
AEG0: TUB-test chart AEG0; Transfer of colour coordinates
transfer of rbg* to nicwde* coordinates
20 step elementary hue circles and CIELAB LCh* data
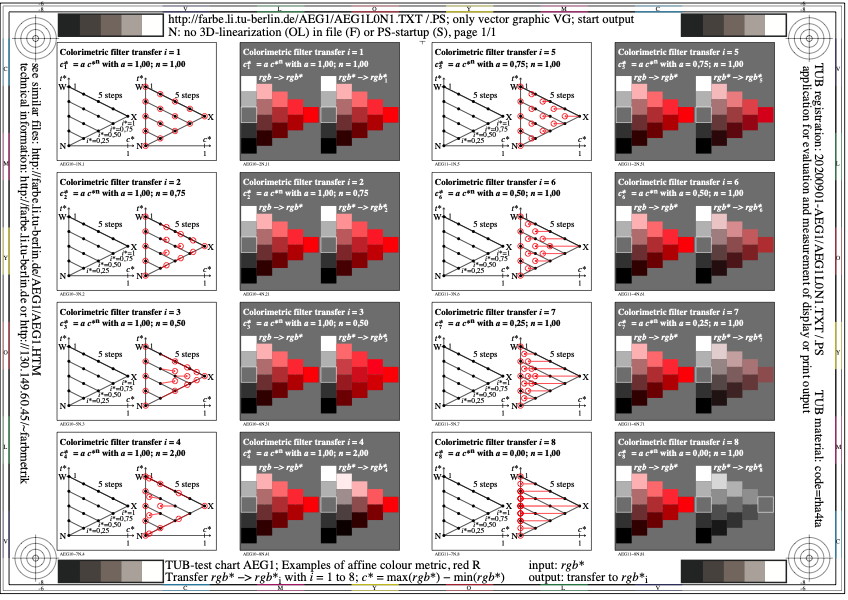
Figure AEG1L0N1.jpg: Output in format A6 of the file
AEG1L0NP.PDF, see
AEG1L0N1.
PS /
TXT /
PDF /
jpg
AEG1: TUB-test chart AEG1; Affine colour metric for Red R
eight example tranfers rgb* to rgb*i (i=0 to 8)
with use of c* = max(rgb*) - min(rgb*)
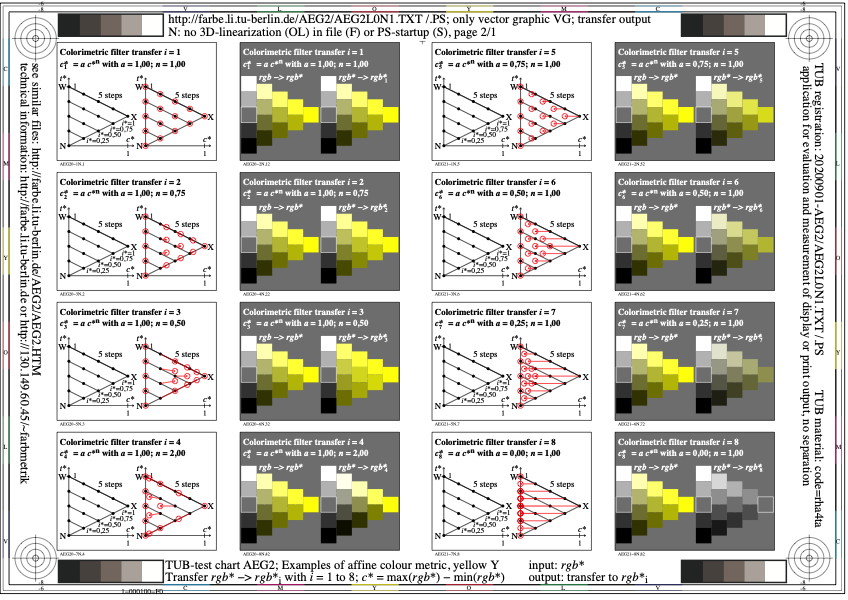
Figure AEG2L0N1.jpg: Output in format A6 of the file
AEG2L0NP.PDF, see
AEG2L0N1.
PS /
TXT /
PDF /
jpg
AEG2: TUB-test chart AEG2; Affine colour metric for Yellow Y
eight example tranfers rgb* to rgb*i (i=0 to 8)
with use of c* = max(rgb*) - min(rgb*)
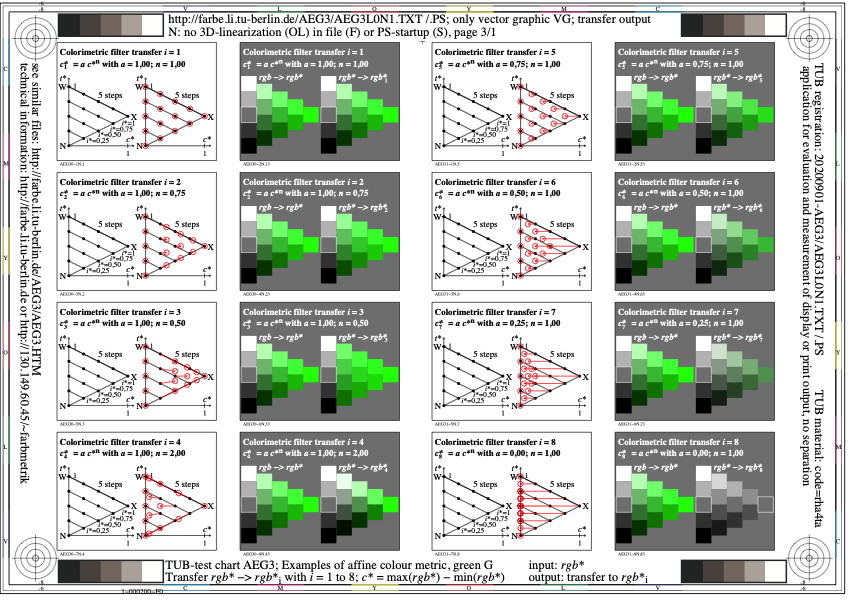
Figure AEG3L0N1.jpg: Output in format A6 of the file
AEG3L0NP.PDF, see
AEG3L0N1.
PS /
TXT /
PDF /
jpg
AEG3: TUB-test chart AEG3; Affine colour metric for Green G
eight example tranfers rgb* to rgb*i (i=0 to 8)
with use of c* = max(rgb*) - min(rgb*)
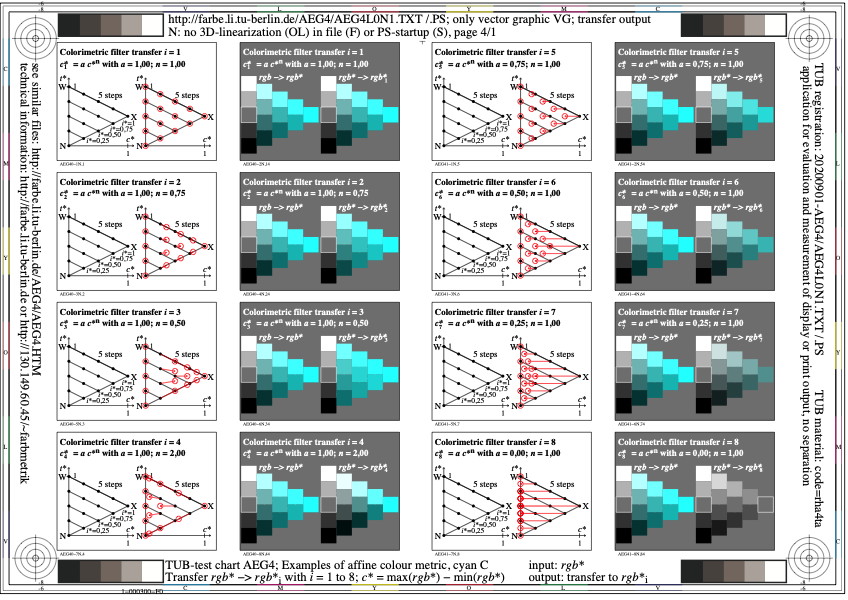
Figure AEG4L0N1.jpg: Output in format A6 of the file
AEG4L0NP.PDF, see
AEG4L0N1.
PS /
TXT /
PDF /
jpg
AEG4: TUB-test chart AEG4; Affine colour metric for Cyan C
eight example tranfers rgb* to rgb*i (i=0 to 8)
with use of c* = max(rgb*) - min(rgb*)
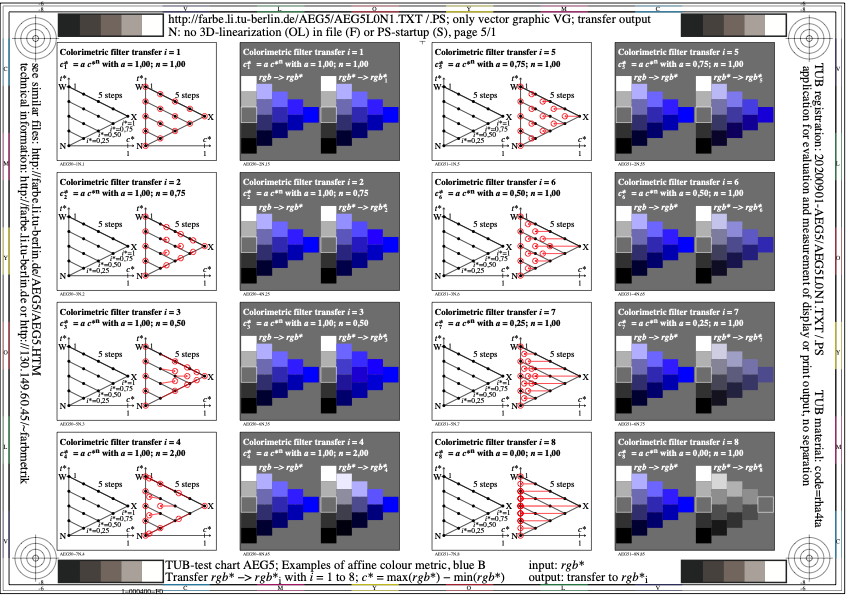
Figure AEG5L0N1.jpg: Output in format A6 of the file
AEG5L0NP.PDF, see
AEG5L0N1.
PS /
TXT /
PDF /
jpg
AEG5: TUB-test chart AEG5; Affine colour metric for Blue B
eight example tranfers rgb* to rgb*i (i=0 to 8)
with use of c* = max(rgb*) - min(rgb*)
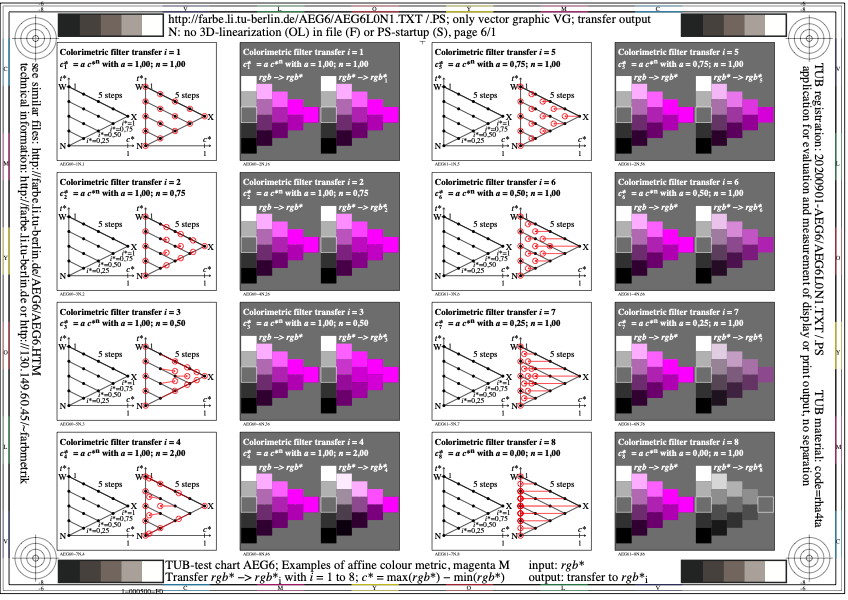
Figure AEG6L0N1.jpg: Output in format A6 of the file
AEG6L0NP.PDF, see
AEG6L0N1.
PS /
TXT /
PDF /
jpg
AEG6: TUB-test chart AEG6; Affine colour metric for Magenta M
eight example tranfers rgb* to rgb*i (i=0 to 8)
with use of c* = max(rgb*) - min(rgb*)
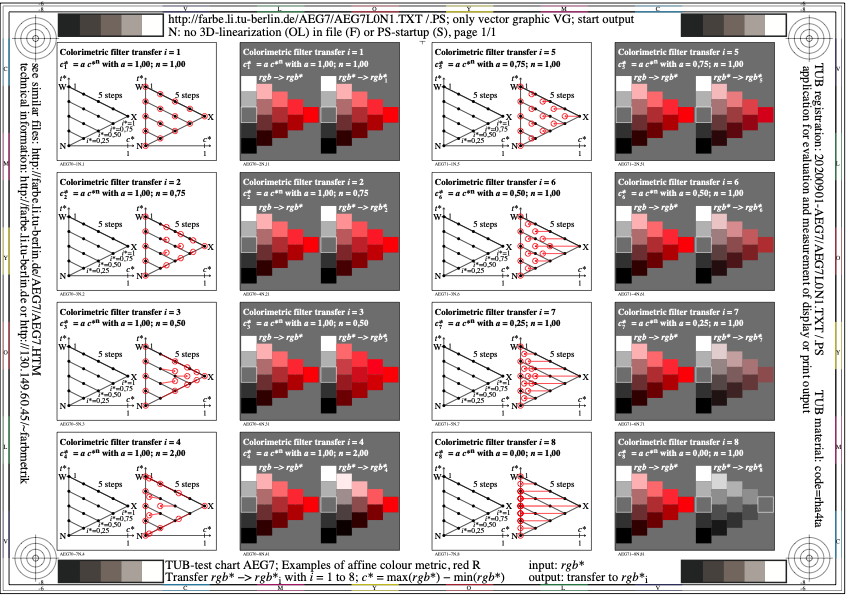
Figure AEG7L0N1.jpg: Output in format A6 of the file
AEG7L0NP.PDF, see
AEG7L0N1.
PS /
TXT /
PDF /
jpg
AEG7: TUB-test chart AEG7; Affine colour metric for RYGCBM
eight example tranfers rgb* to rgb*i (i=0 to 8)
with use of c* = max(rgb*) - min(rgb*)
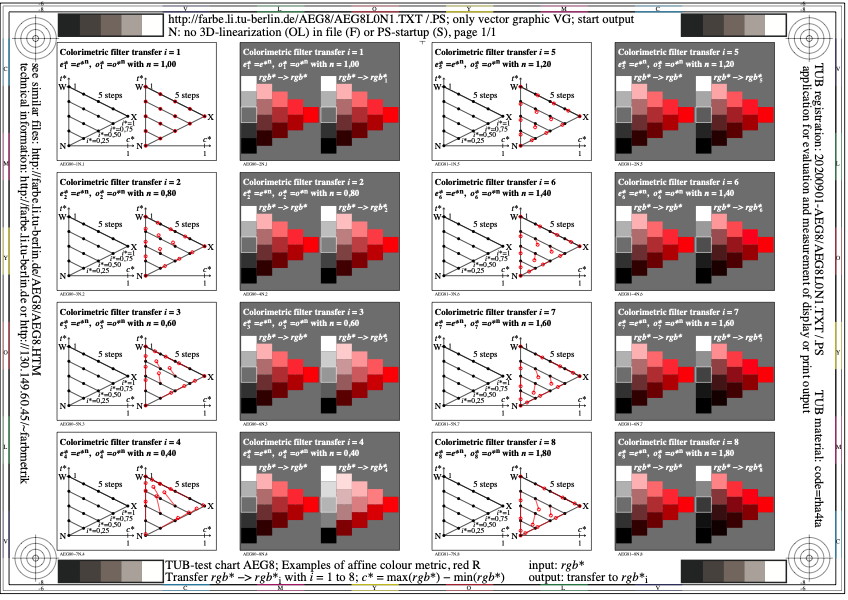
Figure AEG8L0N1.jpg: Output in format A6 of the file
AEG8L0NP.PDF, see
AEG8L0N1.
PS /
TXT /
PDF /
jpg
AEG8: TUB-test chart AEG8; Affine colour metric for RYGCBM
eight example tranfers rgb* to rgb*i (i=0 to 8)
with use of rgb*' = rgb*(n) with eight exponents n
Figure AEG9L0N1.jpg: Output in format A6 of the file
AEG9L0NP.PDF, see
AEG9L0N1.
PS /
TXT /
PDF /
jpg
AEG9: TUB-test chart AEG9; Affine colour metric for RYGCBM
special properties of eigen (e) and oponent (o) colours
with use of c* = max(rgb*) - min(rgb*)
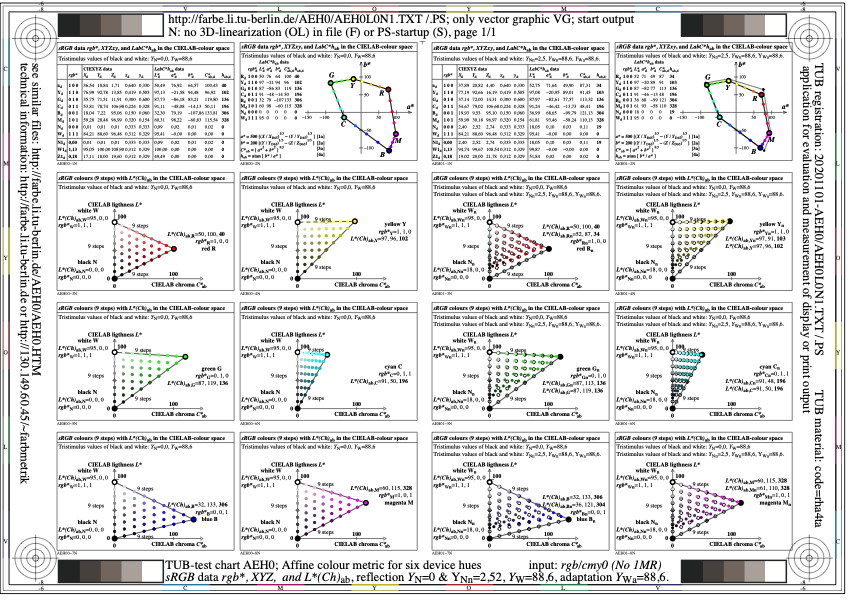
Figure AEH0L0N1.jpg: Output in format A6 of the file
AEH0L0NP.PDF, see
AEH0L0N1.
PS /
TXT /
PDF /
jpg
AEH0: TUB-test chart AEH0; sRGB-display reflections
rgb* input and LabC*h output in device hue planes
Reflections YN=0 and YNn=2,5, adaptation YWa=88,6
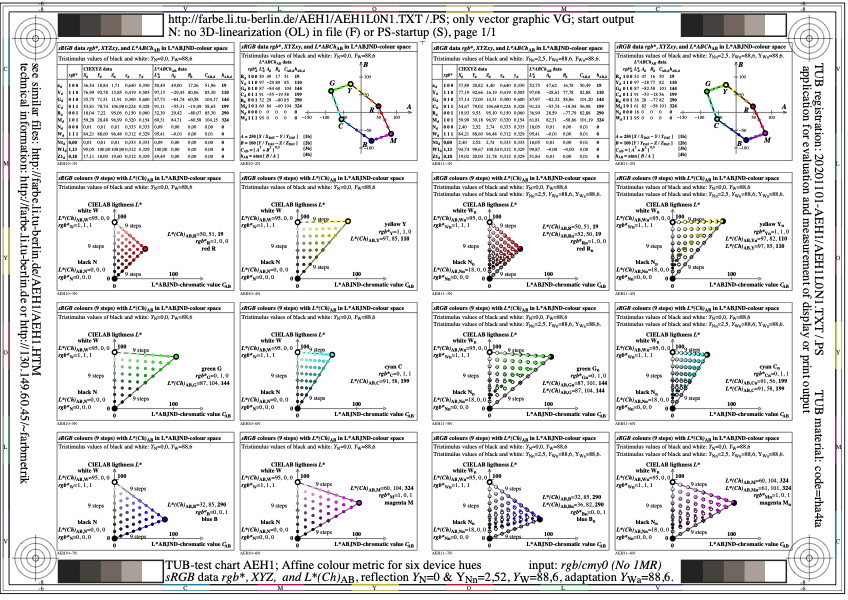
Figure AEH1L0N1.jpg: Output in format A6 of the file
AEH1L0NP.PDF, see
AEH1L0N1.
PS /
TXT /
PDF /
jpg
AEH1: TUB-test chart AEH1; sRGB-display reflections
rgb* input and L*ABCh output in device hue planes
Reflections YN=0 and YNn=2,5, adaptation YWa=88,6
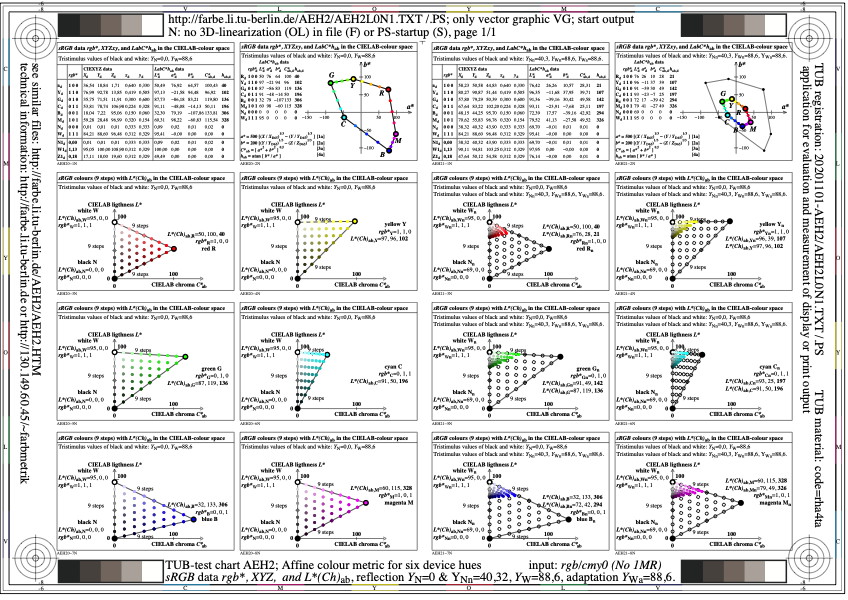
Figure AEH2L0N1.jpg: Output in format A6 of the file
AEH2L0NP.PDF, see
AEH2L0N1.
PS /
TXT /
PDF /
jpg
AEH2: TUB-test chart AEH2; sRGB-display reflections
rgb* input and LabC*h output in device hue planes
Reflections YN=0 and YNn=40,3, adaptation YWa=88,6
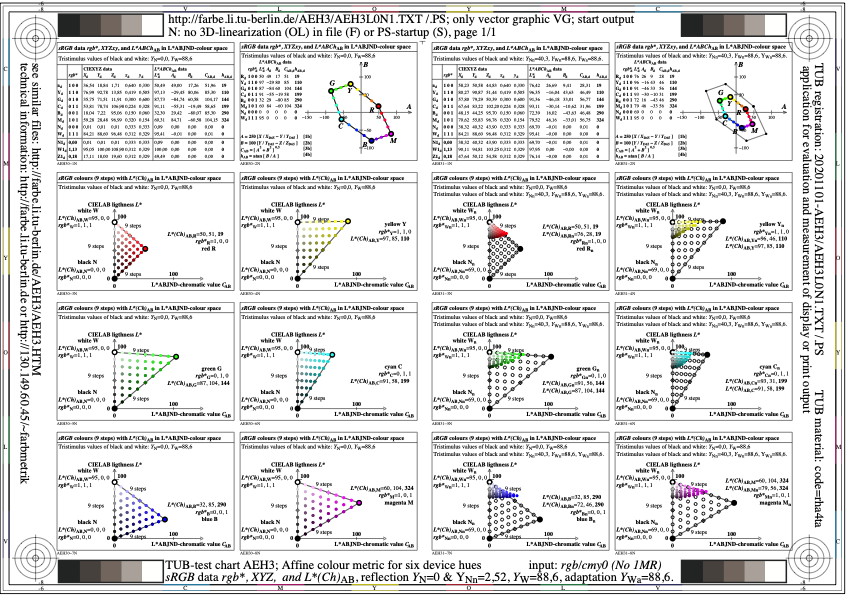
Figure AEH3L0N1.jpg: Output in format A6 of the file
AEH3L0NP.PDF, see
AEH3L0N1.
PS /
TXT /
PDF /
jpg
AEH3: TUB-test chart AEH3; sRGB-display reflections
rgb* input and L*ABCh output in device hue planes
Reflections YN=0 and YNn=40,3, adaptation YWa=88,6

Figure AEH4L0N1.jpg: Output in format A6 of the file
AEH4L0NP.PDF, see
AEH4L0N1.
PS /
TXT /
PDF /
jpg
AEH4: TUB-test chart AEH4; sRGB-display reflections, YWa=88,6
rgb* input and LabC*h output in device hue planes
Reflections for 8 contrast steps according to ISO 9241-306

Figure AEH5L0N1.jpg: Output in format A6 of the file
AEH5L0NP.PDF, see
AEH5L0N1.
PS /
TXT /
PDF /
jpg
AEH5: TUB-test chart AEH5; sRGB-display reflections, YWa=88,6
rgb* input and L*ABCh output in device hue planes
Reflections for 8 contrast steps according to ISO 9241-306
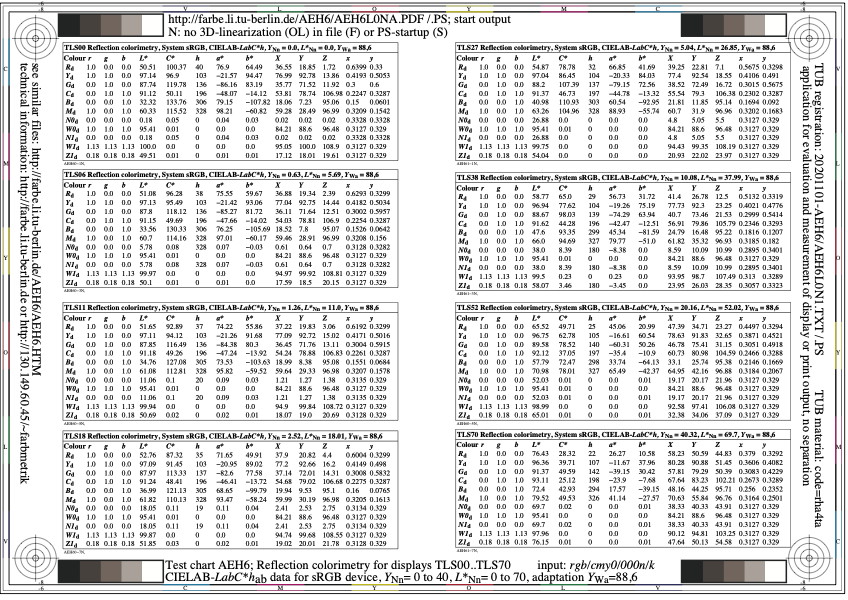
Figure AEH6L0N1.jpg: Output in format A6 of the file
AEH6L0NP.PDF, see
AEH6L0N1.
PS /
TXT /
PDF /
jpg
AEH6: TUB-test chart AEH6; sRGB-display reflections, YWa=88,6
rgb* input and LabC*h output in device hue planes
Reflections for 8 contrast steps according to ISO 9241-306
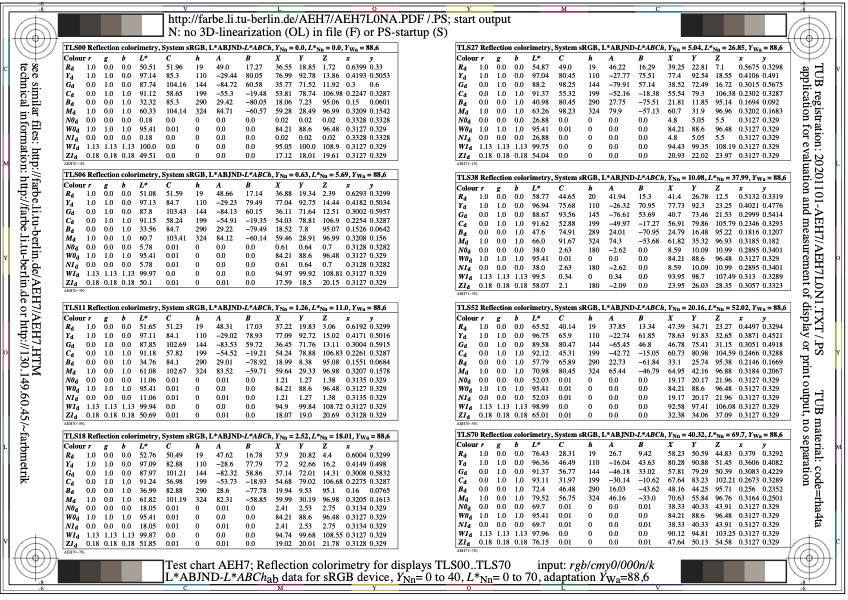
Figure AEH7L0N1.jpg: Output in format A6 of the file
AEH7L0NP.PDF, see
AEH7L0N1.
PS /
TXT /
PDF /
jpg
AEH7: TUB-test chart AEH7; sRGB-display reflections, YWa=88,6
rgb* input and L*ABCh output in device hue planes
Reflections for 8 contrast steps according to ISO 9241-306

Figure AEH8L0N1.jpg: Output in format A6 of the file
AEH8L0NP.PDF, see
AEH8L0N1.
PS /
TXT /
PDF /
jpg
AEH8: TUB-test chart AEH8; sRGB-display reflections, YWa=88,6
rgb* input and XYZ-output mixture in device hue planes
Reflections for 8 contrast steps according to ISO 9241-306

Figure AEH9L0N1.jpg: Output in format A6 of the file
AEH9L0NP.PDF, see
AEH9L0N1.
PS /
TXT /
PDF /
jpg
AEH9: TUB-test chart AEH9; sRGB-display reflections, YWa=88,6
rgb* input and XYZ-output mixture in device hue planes
Reflections for 8 contrast steps according to ISO 9241-306
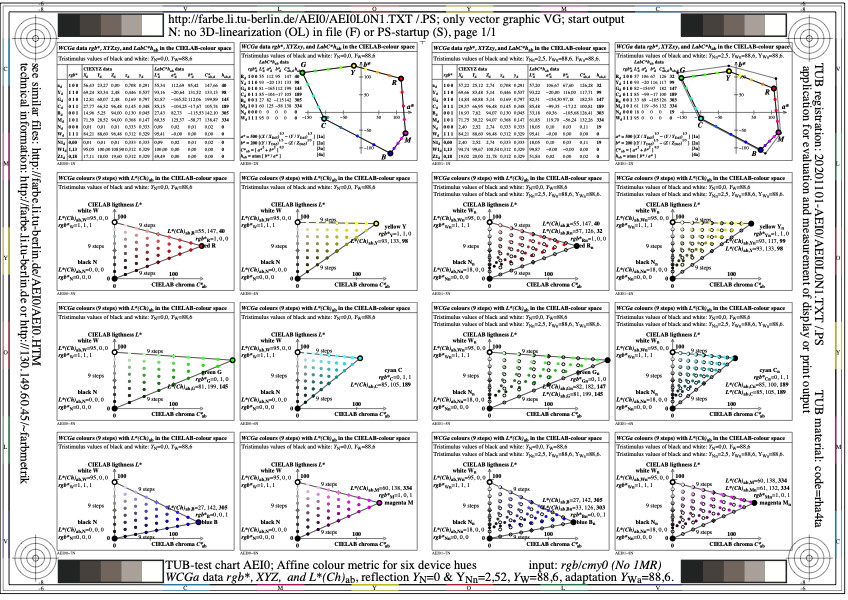
Figure AEI0L0N1.jpg: Output in format A6 of the file
AEI0L0NP.PDF, see
AEI0L0N1.
PS /
TXT /
PDF /
jpg
AEI0: TUB-test chart AEI0; WCGa-display reflections
rgb* input and LabC*h output in device hue planes
Reflections YN=0 and YNn=2,5, adaptation YWa=88,6
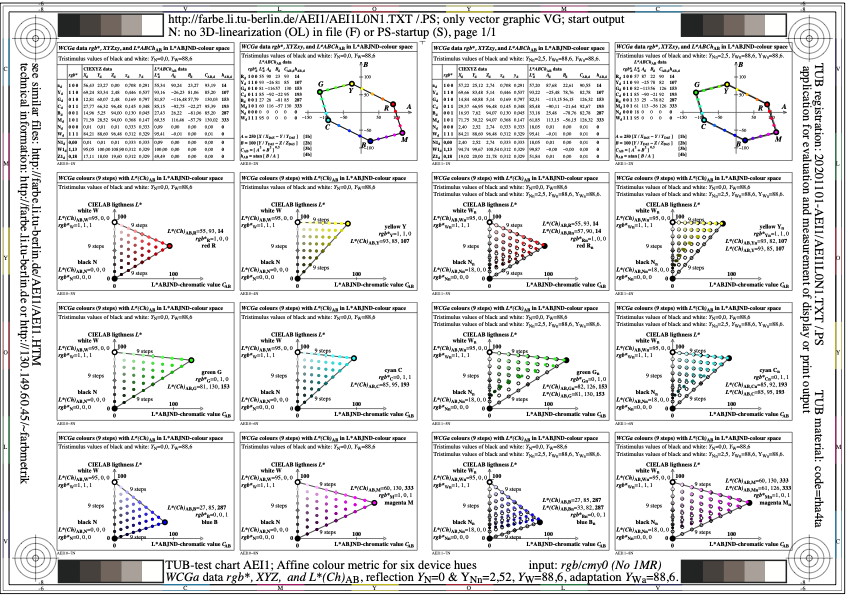
Figure AEI1L0N1.jpg: Output in format A6 of the file
AEI1L0NP.PDF, see
AEI1L0N1.
PS /
TXT /
PDF /
jpg
AEI1: TUB-test chart AEI1; WCGa-display reflections
rgb* input and L*ABCh output in device hue planes
Reflections YN=0 and YNn=2,5, adaptation YWa=88,6
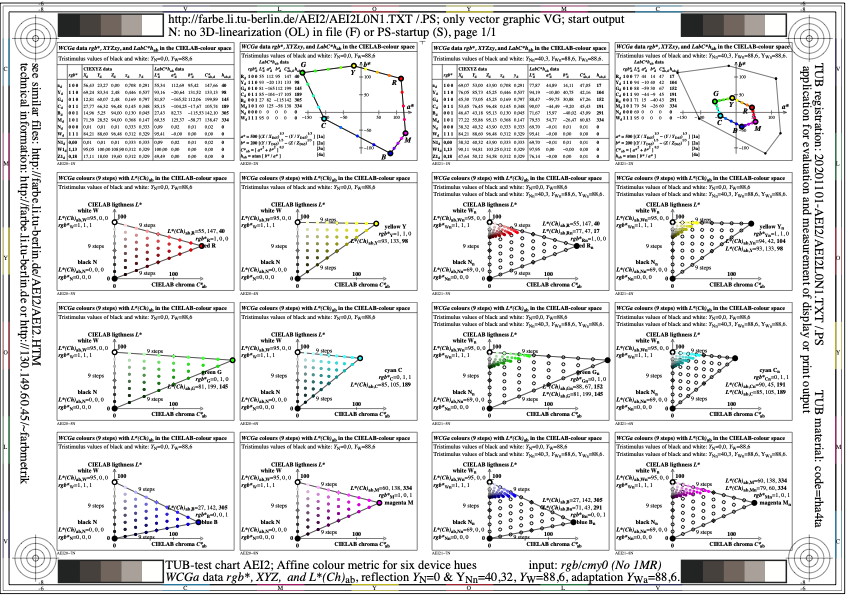
Figure AEI2L0N1.jpg: Output in format A6 of the file
AEI2L0NP.PDF, see
AEI2L0N1.
PS /
TXT /
PDF /
jpg
AEI2: TUB-test chart AEI2; WCGa-display reflections
rgb* input and LabC*h output in device hue planes
Reflections YN=0 and YNn=40,3, adaptation YWa=88,6
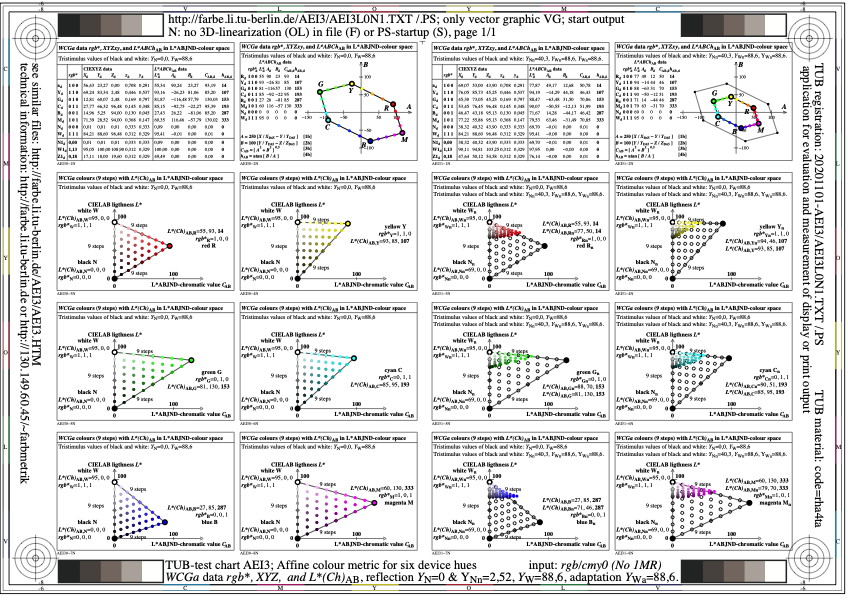
Figure AEI3L0N1.jpg: Output in format A6 of the file
AEI3L0NP.PDF, see
AEI3L0N1.
PS /
TXT /
PDF /
jpg
AEI3: TUB-test chart AEI3; WCGa-display reflections
rgb* input and L*ABCh output in device hue planes
Reflections YN=0 and YNn=40,3, adaptation YWa=88,6

Figure AEI4L0N1.jpg: Output in format A6 of the file
AEI4L0NP.PDF, see
AEI4L0N1.
PS /
TXT /
PDF /
jpg
AEI4: TUB-test chart AEI4; WCGa-display reflections, YWa=88,6
rgb* input and LabC*h output in device hue planes
Reflections for 8 contrast steps according to ISO 9241-306

Figure AEI5L0N1.jpg: Output in format A6 of the file
AEI5L0NP.PDF, see
AEI5L0N1.
PS /
TXT /
PDF /
jpg
AEI5: TUB-test chart AEI5; WCGa-display reflections, YWa=88,6
rgb* input and L*ABCh output in device hue planes
Reflections for 8 contrast steps according to ISO 9241-306
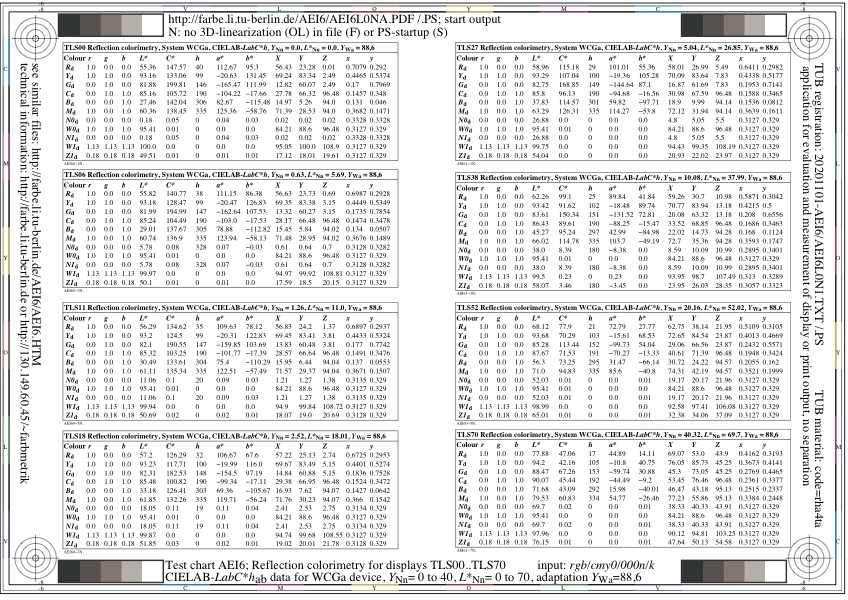
Figure AEI6L0N1.jpg: Output in format A6 of the file
AEI6L0NP.PDF, see
AEI6L0N1.
PS /
TXT /
PDF /
jpg
AEI6: TUB-test chart AEI6; WCGa-display reflections, YWa=88,6
rgb* input and LabC*h output in device hue planes
Reflections for 8 contrast steps according to ISO 9241-306
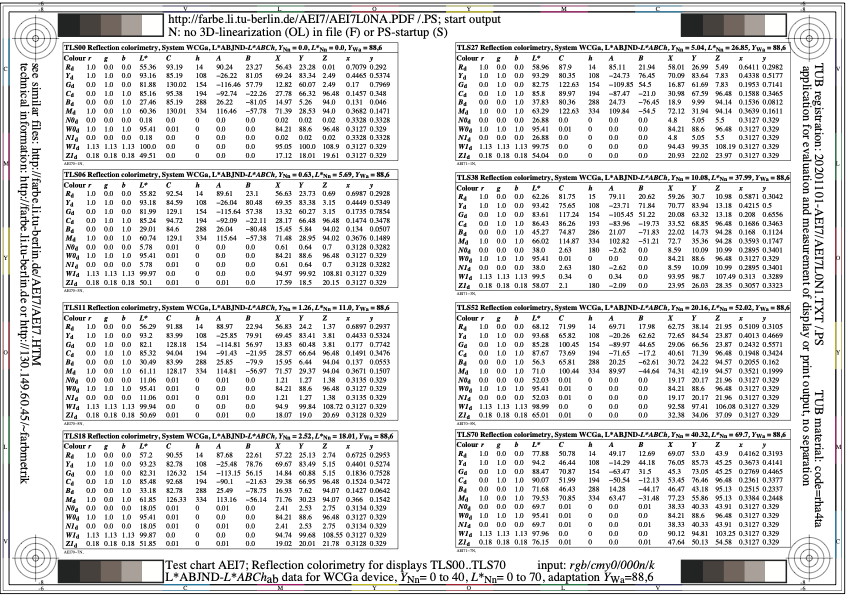
Figure AEI7L0N1.jpg: Output in format A6 of the file
AEI7L0NP.PDF, see
AEI7L0N1.
PS /
TXT /
PDF /
jpg
AEI7: TUB-test chart AEI7; WCGa-display reflections, YWa=88,6
rgb* input and L*ABCh output in device hue planes
Reflections for 8 contrast steps according to ISO 9241-306
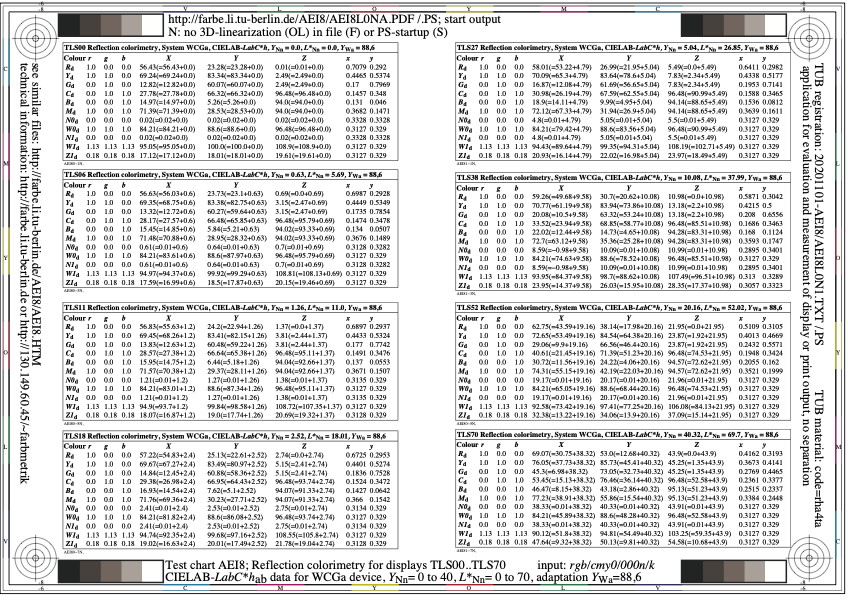
Figure AEI8L0N1.jpg: Output in format A6 of the file
AEI8L0NP.PDF, see
AEI8L0N1.
PS /
TXT /
PDF /
jpg
AEI8: TUB-test chart AEI8; WCGa-display reflections, YWa=88,6
rgb* input and XYZ-output mixture in device hue planes
Reflections for 8 contrast steps according to ISO 9241-306
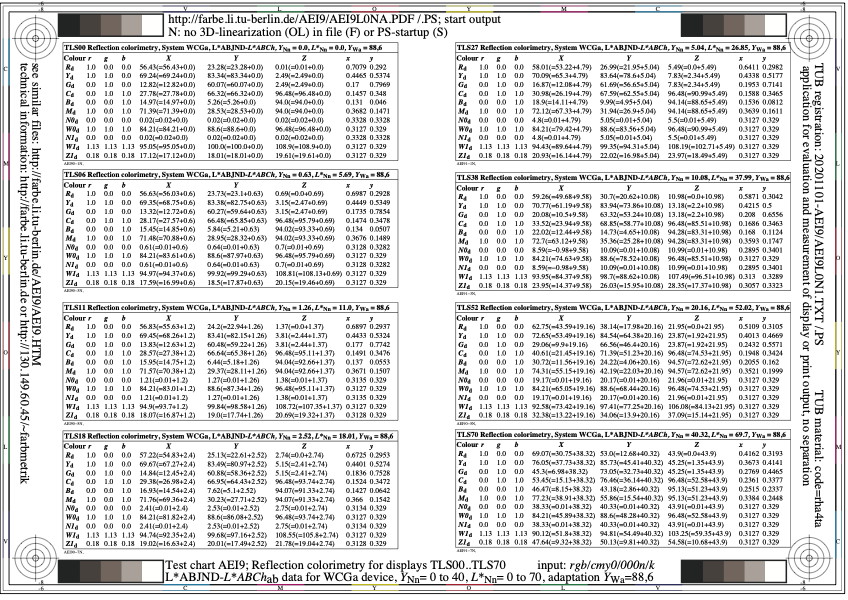
Figure AEI9L0N1.jpg: Output in format A6 of the file
AEI9L0NP.PDF, see
AEI9L0N1.
PS /
TXT /
PDF /
jpg
AEI9: TUB-test chart AEI9; WCGa-display reflections, YWa=88,6
rgb* input and XYZ-output mixture in device hue planes
Reflections for 8 contrast steps according to ISO 9241-306
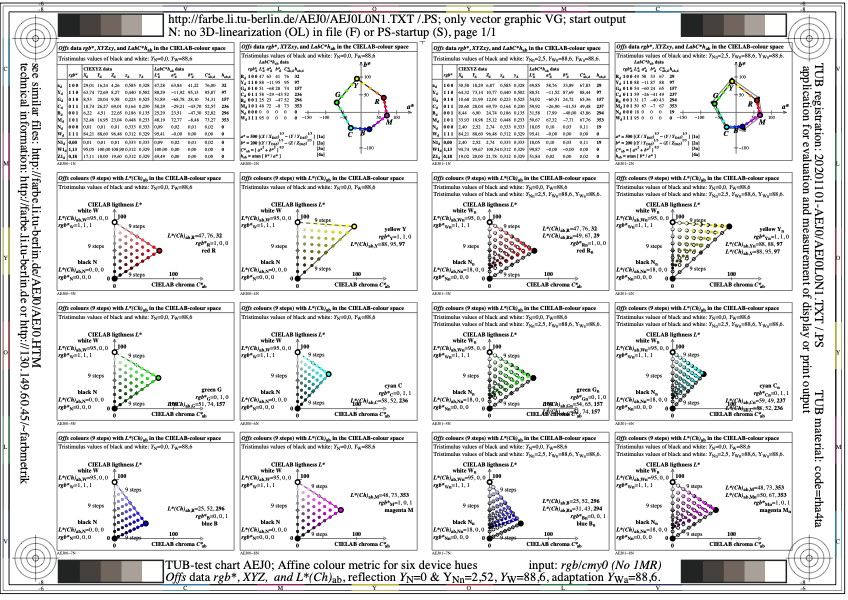
Figure AEJ0L0N1.jpg: Output in format A6 of the file
AEJ0L0NP.PDF, see
AEJ0L0N1.
PS /
TXT /
PDF /
jpg
AEJ0: TUB-test chart AEJ0; Offs-display reflections
rgb* input and LabC*h output in device hue planes
Reflections YN=0 and YNn=2,5, adaptation YWa=88,6
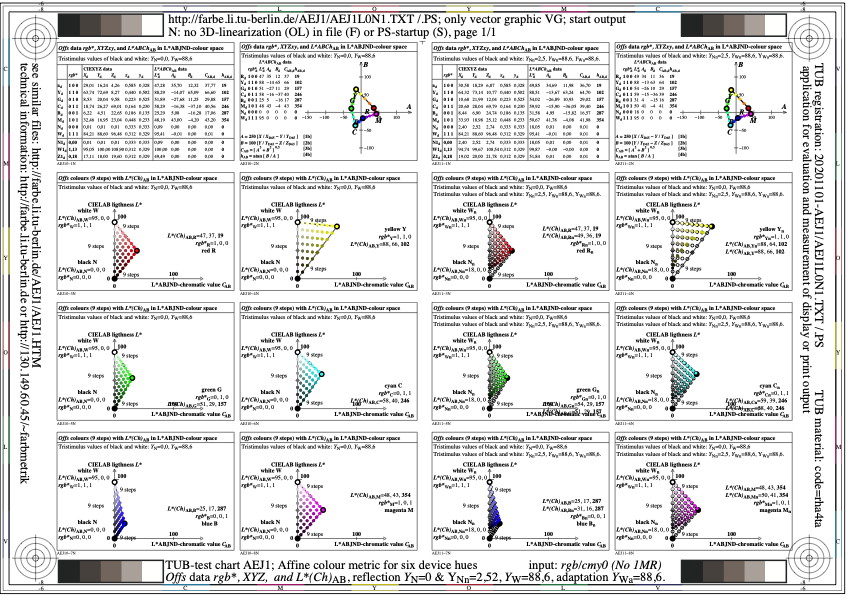
Figure AEJ1L0N1.jpg: Output in format A6 of the file
AEJ1L0NP.PDF, see
AEJ1L0N1.
PS /
TXT /
PDF /
jpg
AEJ1: TUB-test chart AEJ1; Offs-display reflections
rgb* input and L*ABCh output in device hue planes
Reflections YN=0 and YNn=2,5, adaptation YWa=88,6
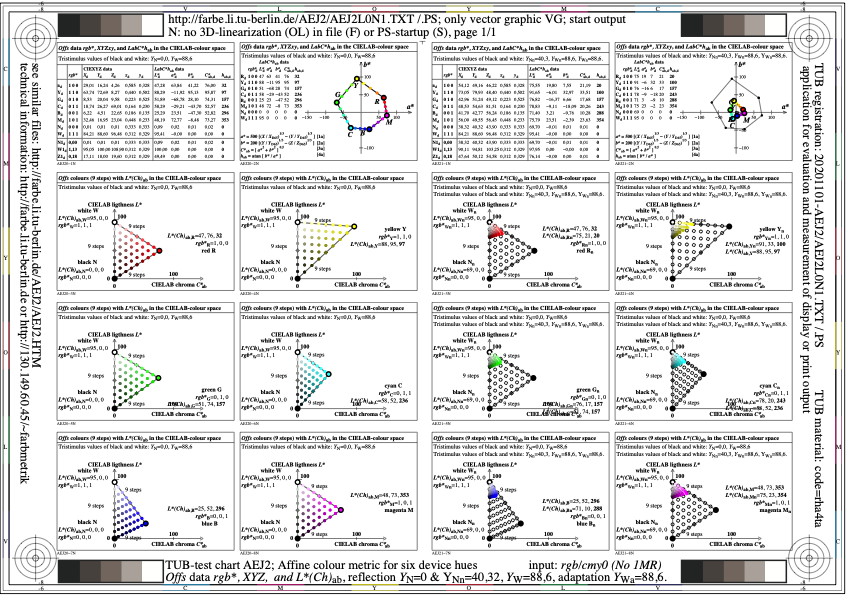
Figure AEJ2L0N1.jpg: Output in format A6 of the file
AEJ2L0NP.PDF, see
AEJ2L0N1.
PS /
TXT /
PDF /
jpg
AEJ2: TUB-test chart AEJ2; Offs-display reflections
rgb* input and LabC*h output in device hue planes
Reflections YN=0 and YNn=40,3, adaptation YWa=88,6
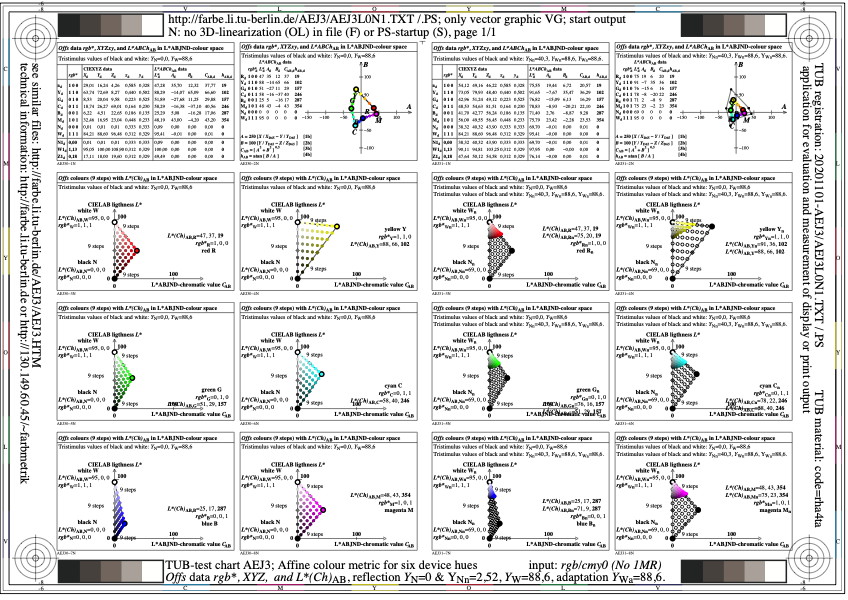
Figure AEJ3L0N1.jpg: Output in format A6 of the file
AEJ3L0NP.PDF, see
AEJ3L0N1.
PS /
TXT /
PDF /
jpg
AEJ3: TUB-test chart AEJ3; Offs-display reflections
rgb* input and L*ABCh output in device hue planes
Reflections YN=0 and YNn=40,3, adaptation YWa=88,6

Figure AEJ4L0N1.jpg: Output in format A6 of the file
AEJ4L0NP.PDF, see
AEJ4L0N1.
PS /
TXT /
PDF /
jpg
AEJ4: TUB-test chart AEJ4; Offs-display reflections, YWa=88,6
rgb* input and LabC*h output in device hue planes
Reflections for 8 contrast steps according to ISO 9241-306

Figure AEJ5L0N1.jpg: Output in format A6 of the file
AEJ5L0NP.PDF, see
AEJ5L0N1.
PS /
TXT /
PDF /
jpg
AEJ5: TUB-test chart AEJ5; Offs-display reflections, YWa=88,6
rgb* input and L*ABCh output in device hue planes
Reflections for 8 contrast steps according to ISO 9241-306
Figure AEJ6L0N1.jpg: Output in format A6 of the file
AEJ6L0NP.PDF, see
AEJ6L0N1.
PS /
TXT /
PDF /
jpg
AEJ6: TUB-test chart AEJ6; Offs-display reflections, YWa=88,6
rgb* input and LabC*h output in device hue planes
Reflections for 8 contrast steps according to ISO 9241-306
Figure AEJ7L0N1.jpg: Output in format A6 of the file
AEJ7L0NP.PDF, see
AEJ7L0N1.
PS /
TXT /
PDF /
jpg
AEJ7: TUB-test chart AEJ7; Offs-display reflections, YWa=88,6
rgb* input and L*ABCh output in device hue planes
Reflections for 8 contrast steps according to ISO 9241-306

Figure AEJ8L0N1.jpg: Output in format A6 of the file
AEJ8L0NP.PDF, see
AEJ8L0N1.
PS /
TXT /
PDF /
jpg
AEJ8: TUB-test chart AEJ8; Offs-display reflections, YWa=88,6
rgb* input and XYZ-output mixture in device hue planes
Reflections for 8 contrast steps according to ISO 9241-306

Figure AEJ9L0N1.jpg: Output in format A6 of the file
AEJ9L0NP.PDF, see
AEJ9L0N1.
PS /
TXT /
PDF /
jpg
AEJ9: TUB-test chart AEJ9; Offs-display reflections, YWa=88,6
rgb* input and XYZ-output mixture in device hue planes
Reflections for 8 contrast steps according to ISO 9241-306
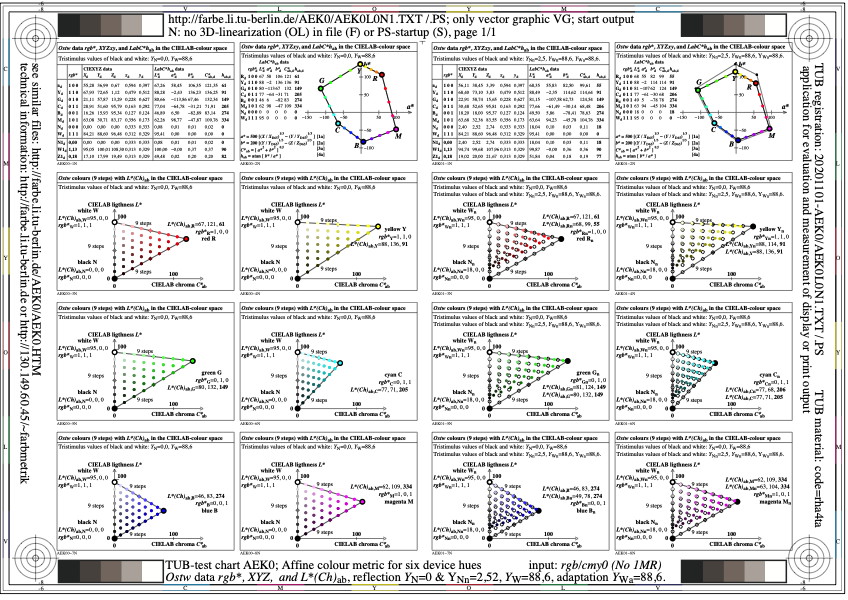
Figure AEK0L0N1.jpg: Output in format A6 of the file
AEK0L0NP.PDF, see
AEK0L0N1.
PS /
TXT /
PDF /
jpg
AEK0: TUB-test chart AEK0; Ostw-display reflections
rgb* input and LabC*h output in device hue planes
Reflections YN=0 and YNn=2,5, adaptation YWa=88,6
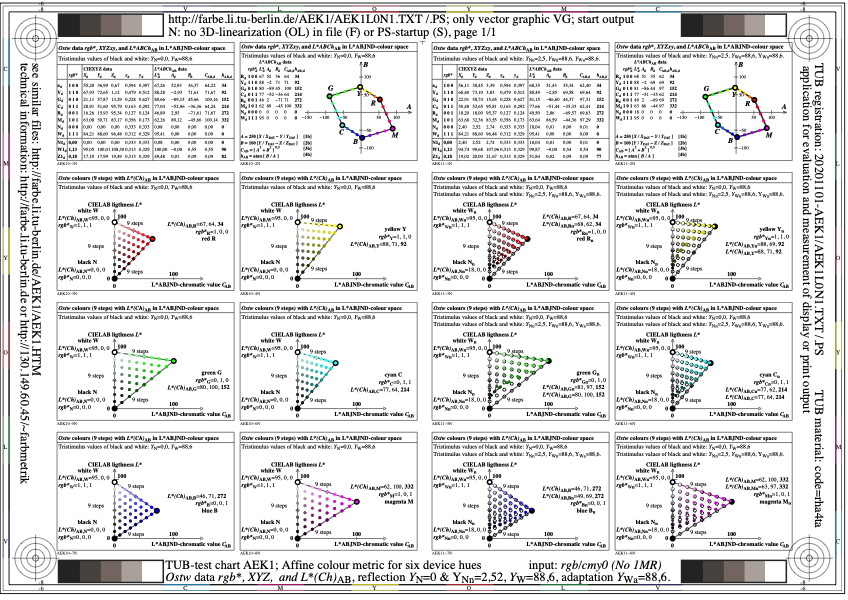
Figure AEK1L0N1.jpg: Output in format A6 of the file
AEK1L0NP.PDF, see
AEK1L0N1.
PS /
TXT /
PDF /
jpg
AEK1: TUB-test chart AEK1; Ostw-display reflections
rgb* input and L*ABCh output in device hue planes
Reflections YN=0 and YNn=2,5, adaptation YWa=88,6
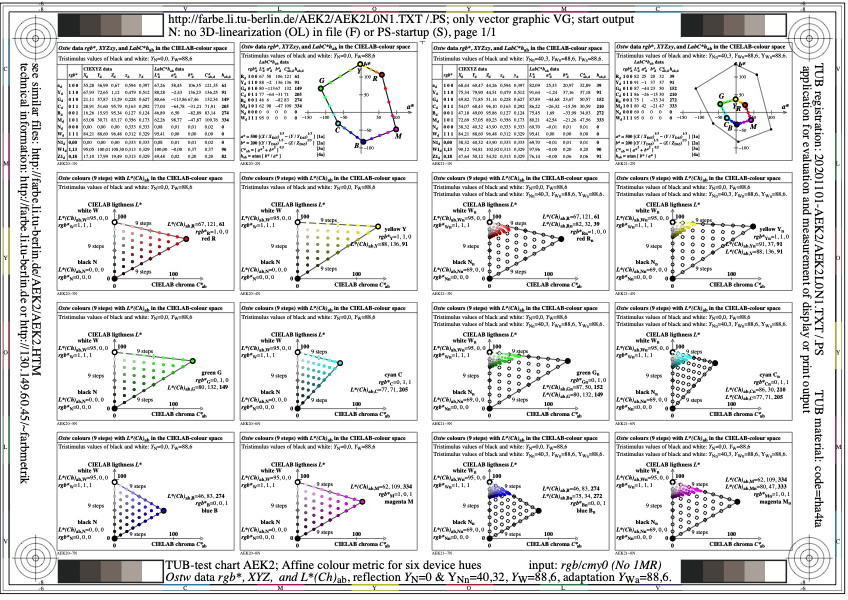
Figure AEK2L0N1.jpg: Output in format A6 of the file
AEK2L0NP.PDF, see
AEK2L0N1.
PS /
TXT /
PDF /
jpg
AEK2: TUB-test chart AEK2; Ostw-display reflections
rgb* input and LabC*h output in device hue planes
Reflections YN=0 and YNn=40,3, adaptation YWa=88,6
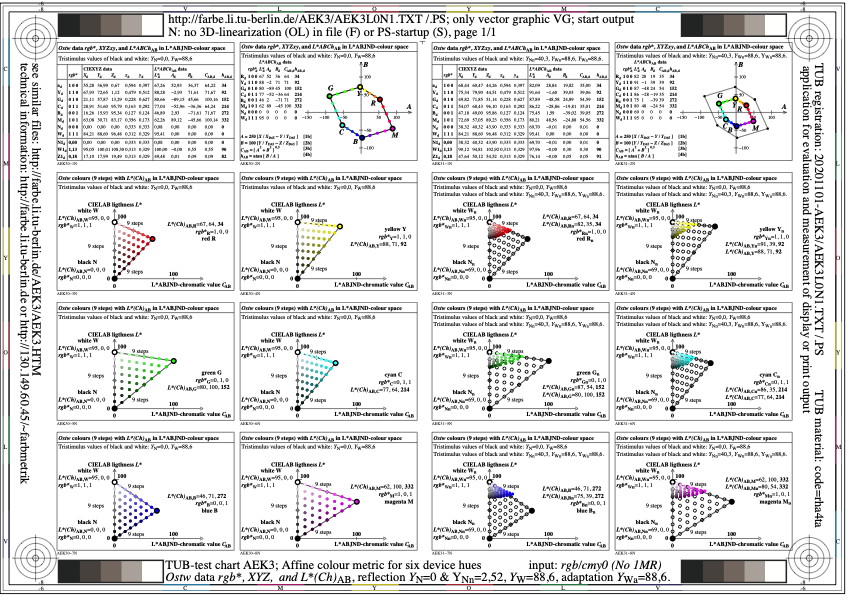
Figure AEK3L0N1.jpg: Output in format A6 of the file
AEK3L0NP.PDF, see
AEK3L0N1.
PS /
TXT /
PDF /
jpg
AEK3: TUB-test chart AEK3; Ostw-display reflections
rgb* input and L*ABCh output in device hue planes
Reflections YN=0 and YNn=40,3, adaptation YWa=88,6

Figure AEK4L0N1.jpg: Output in format A6 of the file
AEK4L0NP.PDF, see
AEK4L0N1.
PS /
TXT /
PDF /
jpg
AEK4: TUB-test chart AEK4; Ostw-display reflections, YWa=88,6
rgb* input and LabC*h output in device hue planes
Reflections for 8 contrast steps according to ISO 9241-306

Figure AEK5L0N1.jpg: Output in format A6 of the file
AEK5L0NP.PDF, see
AEK5L0N1.
PS /
TXT /
PDF /
jpg
AEK5: TUB-test chart AEK5; Ostw-display reflections, YWa=88,6
rgb* input and L*ABCh output in device hue planes
Reflections for 8 contrast steps according to ISO 9241-306

Figure AEK6L0N1.jpg: Output in format A6 of the file
AEK6L0NP.PDF, see
AEK6L0N1.
PS /
TXT /
PDF /
jpg
AEK6: TUB-test chart AEK6; Ostw-display reflections, YWa=88,6
rgb* input and LabC*h output in device hue planes
Reflections for 8 contrast steps according to ISO 9241-306
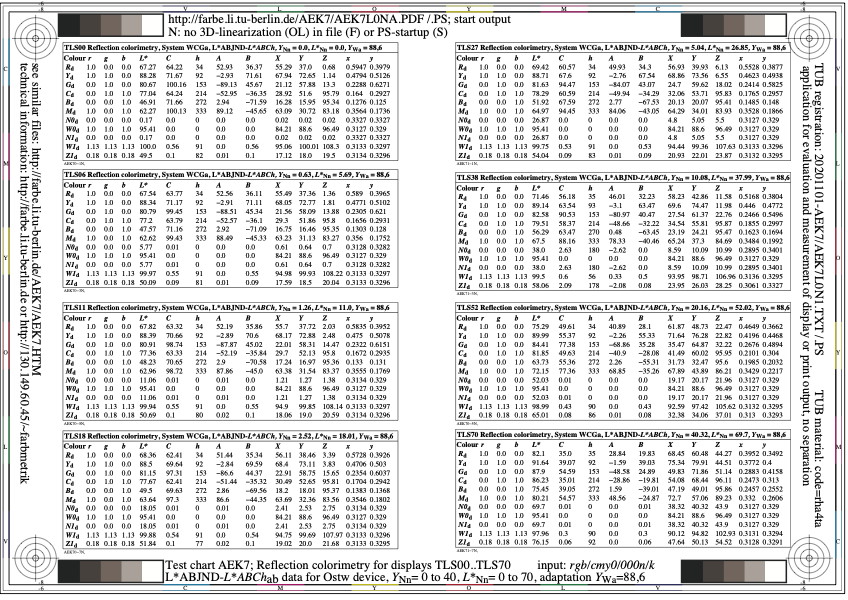
Figure AEK7L0N1.jpg: Output in format A6 of the file
AEK7L0NP.PDF, see
AEK7L0N1.
PS /
TXT /
PDF /
jpg
AEK7: TUB-test chart AEK7; Ostw-display reflections, YWa=88,6
rgb* input and L*ABCh output in device hue planes
Reflections for 8 contrast steps according to ISO 9241-306

Figure AEK8L0N1.jpg: Output in format A6 of the file
AEK8L0NP.PDF, see
AEK8L0N1.
PS /
TXT /
PDF /
jpg
AEK8: TUB-test chart AEK8; Ostw-display reflections, YWa=88,6
rgb* input and XYZ-output mixture in device hue planes
Reflections for 8 contrast steps according to ISO 9241-306

Figure AEK9L0N1.jpg: Output in format A6 of the file
AEK9L0NP.PDF, see
AEK9L0N1.
PS /
TXT /
PDF /
jpg
AEK9: TUB-test chart AEK9; Ostw-display reflections, YWa=88,6
rgb* input and XYZ-output mixture in device hue planes
Reflections for 8 contrast steps according to ISO 9241-306
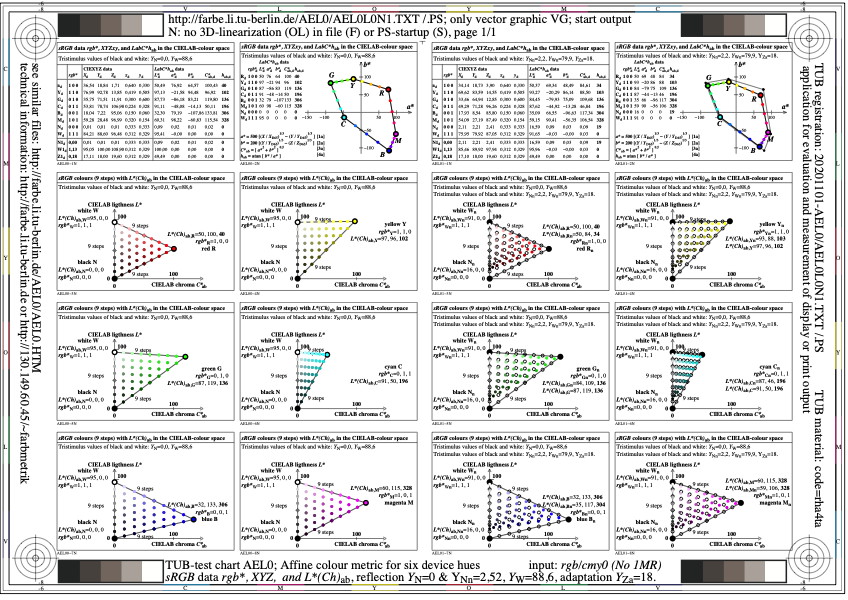
Figure AEL0L0N1.jpg: Output in format A6 of the file
AEL0L0NP.PDF, see
AEL0L0N1.
PS /
TXT /
PDF /
jpg
AEL0: TUB-test chart AEL0; sRGB-display reflections
rgb* input and LabC*h output in device hue planes
Reflections YN=0 and YNn=2,5, adaptation YZa=18,0

Figure AEL1L0N1.jpg: Output in format A6 of the file
AEL1L0NP.PDF, see
AEL1L0N1.
PS /
TXT /
PDF /
jpg
AEL1: TUB-test chart AEL1; sRGB-display reflections
rgb* input and L*ABCh output in device hue planes
Reflections YN=0 and YNn=2,5, adaptation YZa=18,0
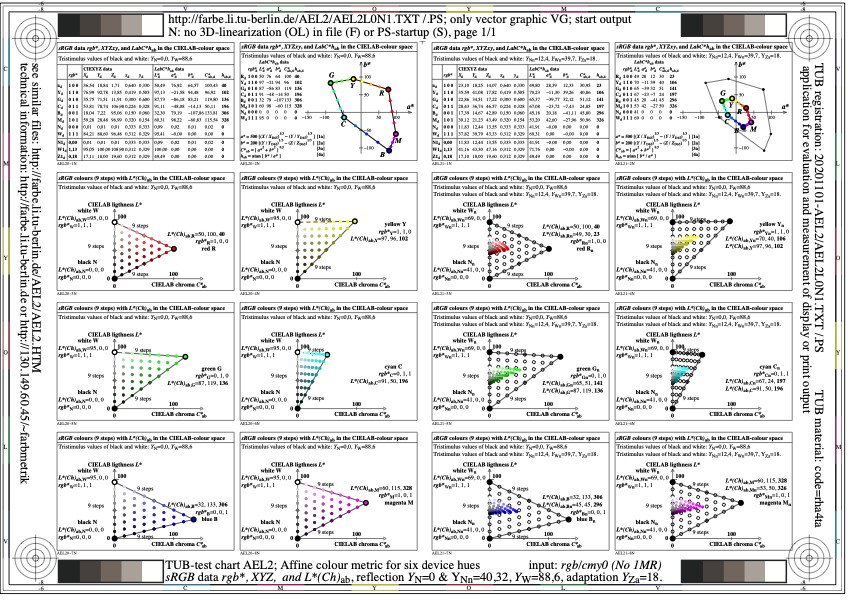
Figure AEL2L0N1.jpg: Output in format A6 of the file
AEL2L0NP.PDF, see
AEL2L0N1.
PS /
TXT /
PDF /
jpg
AEL2: TUB-test chart AEL2; sRGB-display reflections
rgb* input and LabC*h output in device hue planes
Reflections YN=0 and YNn=40,3, adaptation YZa=18,0
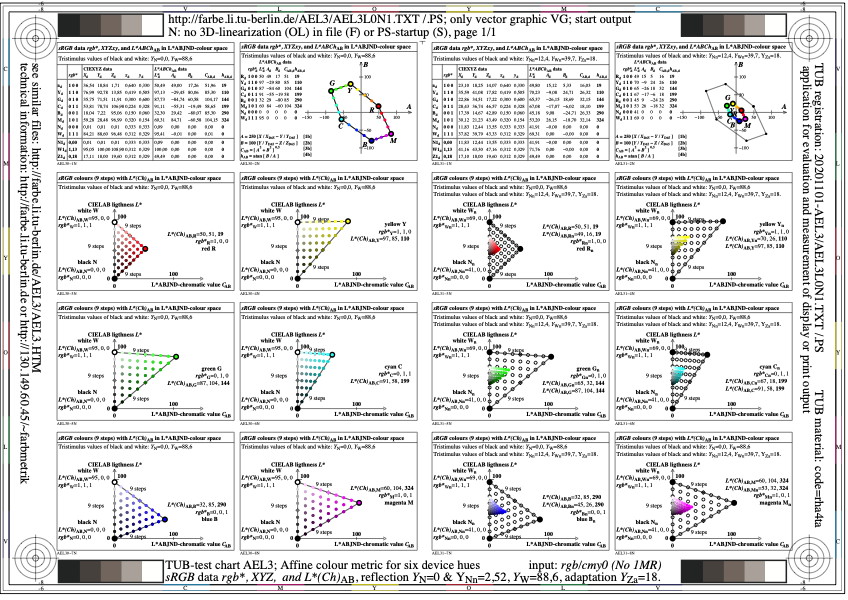
Figure AEL3L0N1.jpg: Output in format A6 of the file
AEL3L0NP.PDF, see
AEL3L0N1.
PS /
TXT /
PDF /
jpg
AEL3: TUB-test chart AEL3; sRGB-display reflections
rgb* input and L*ABCh output in device hue planes
Reflections YN=0 and YNn=40,3, adaptation YZa=18,0
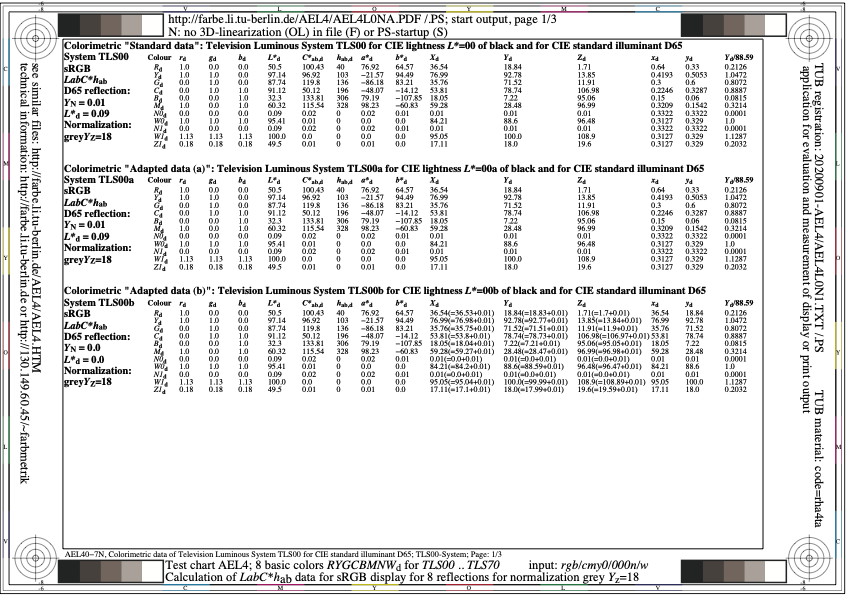
Figure AEL4L0N1.jpg: Output in format A6 of the file
AEL4L0NP.PDF, see
AEL4L0N1.
PS /
TXT /
PDF /
jpg
AEL4: TUB-test chart AEL4; sRGB-display reflections, YZa=18,0
rgb* input and LabC*h output in device hue planes
Reflections for 8 contrast steps according to ISO 9241-306
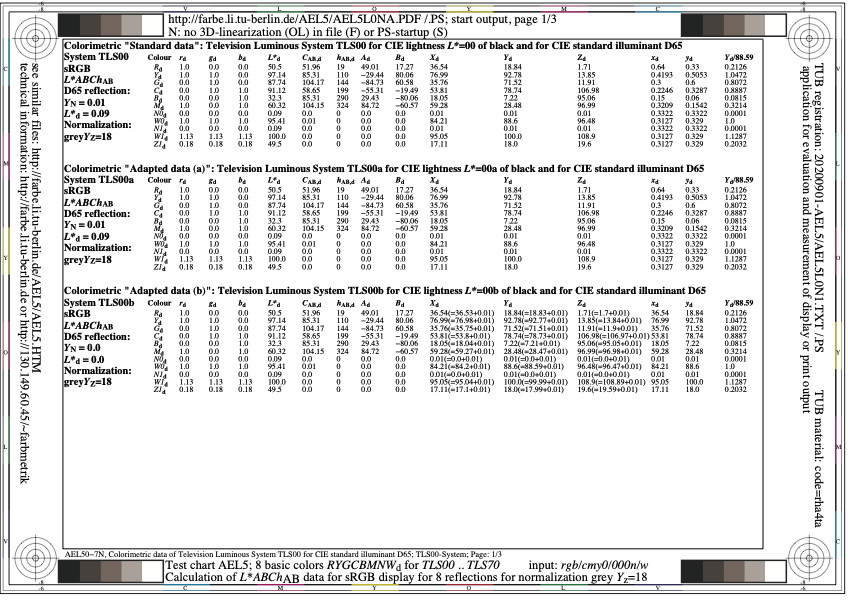
Figure AEL5L0N1.jpg: Output in format A6 of the file
AEL5L0NP.PDF, see
AEL5L0N1.
PS /
TXT /
PDF /
jpg
AEL5: TUB-test chart AEL5; sRGB-display reflections, YZa=18,0
rgb* input and L*ABCh output in device hue planes
Reflections for 8 contrast steps according to ISO 9241-306
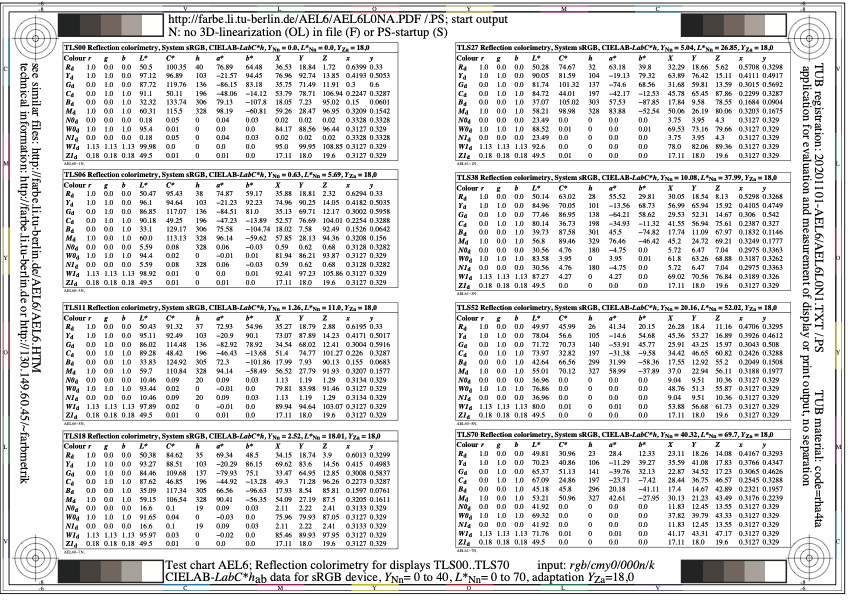
Figure AEL6L0N1.jpg: Output in format A6 of the file
AEL6L0NP.PDF, see
AEL6L0N1.
PS /
TXT /
PDF /
jpg
AEL6: TUB-test chart AEL6; sRGB-display reflections, YZa=18,0
rgb* input and LabC*h output in device hue planes
Reflections for 8 contrast steps according to ISO 9241-306
Figure AEL7L0N1.jpg: Output in format A6 of the file
AEL7L0NP.PDF, see
AEL7L0N1.
PS /
TXT /
PDF /
jpg
AEL7: TUB-test chart AEL7; sRGB-display reflections, YZa=18,0
rgb* input and L*ABCh output in device hue planes
Reflections for 8 contrast steps according to ISO 9241-306
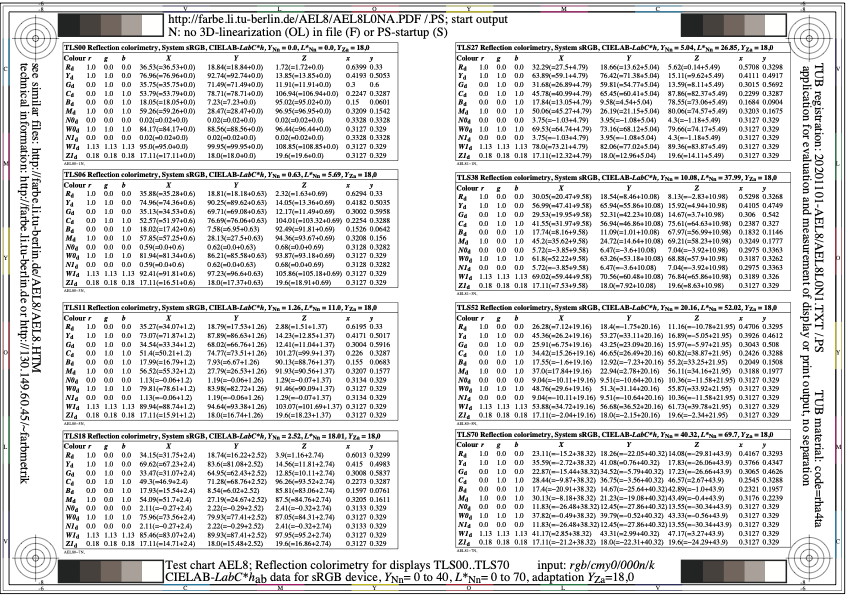
Figure AEL8L0N1.jpg: Output in format A6 of the file
AEL8L0NP.PDF, see
AEL8L0N1.
PS /
TXT /
PDF /
jpg
AEL8: TUB-test chart AEL8; sRGB-display reflections, YZa=18,0
rgb* input and XYZ-output mixture in device hue planes
Reflections for 8 contrast steps according to ISO 9241-306

Figure AEL9L0N1.jpg: Output in format A6 of the file
AEL9L0NP.PDF, see
AEL9L0N1.
PS /
TXT /
PDF /
jpg
AEL9: TUB-test chart AEL9; sRGB-display reflections, YZa=18,0
rgb* input and XYZ-output mixture in device hue planes
Reflections for 8 contrast steps according to ISO 9241-306
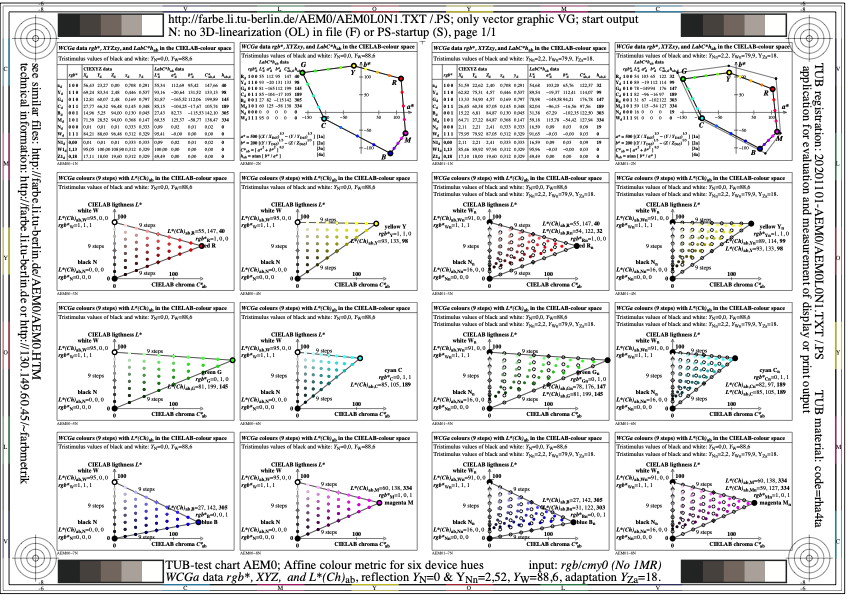
Figure AEM0L0N1.jpg: Output in format A6 of the file
AEM0L0NP.PDF, see
AEM0L0N1.
PS /
TXT /
PDF /
jpg
AEM0: TUB-test chart AEM0; WCGa-display reflections
rgb* input and LabC*h output in device hue planes
Reflections YN=0 and YNn=2,5, adaptation YZa=18,0
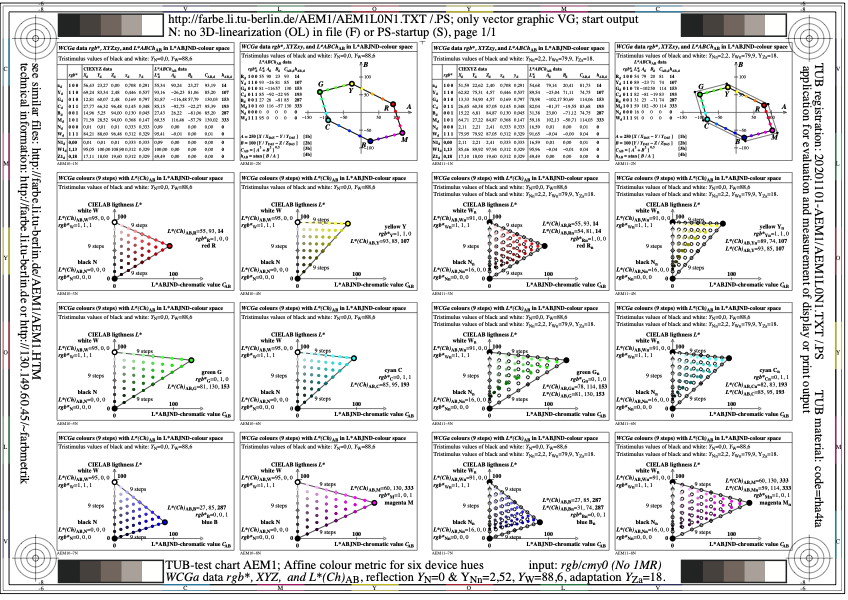
Figure AEM1L0N1.jpg: Output in format A6 of the file
AEM1L0NP.PDF, see
AEM1L0N1.
PS /
TXT /
PDF /
jpg
AEM1: TUB-test chart AEM1; WCGa-display reflections
rgb* input and L*ABCh output in device hue planes
Reflections YN=0 and YNn=2,5, adaptation YZa=18,0
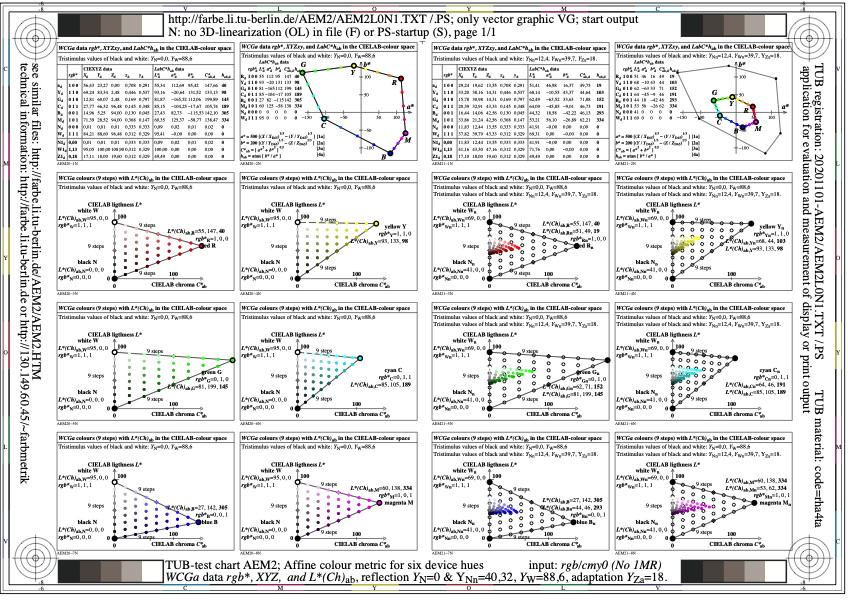
Figure AEM2L0N1.jpg: Output in format A6 of the file
AEM2L0NP.PDF, see
AEM2L0N1.
PS /
TXT /
PDF /
jpg
AEM2: TUB-test chart AEM2; WCGa-display reflections
rgb* input and LabC*h output in device hue planes
Reflections YN=0 and YNn=40,3, adaptation YZa=18,0
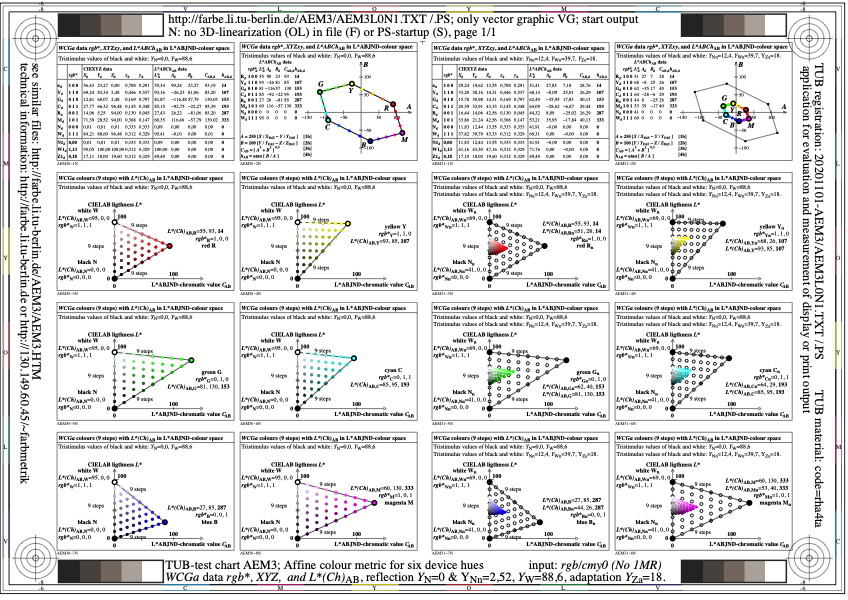
Figure AEM3L0N1.jpg: Output in format A6 of the file
AEM3L0NP.PDF, see
AEM3L0N1.
PS /
TXT /
PDF /
jpg
AEM3: TUB-test chart AEM3; WCGa-display reflections
rgb* input and L*ABCh output in device hue planes
Reflections YN=0 and YNn=40,3, adaptation YZa=18,0
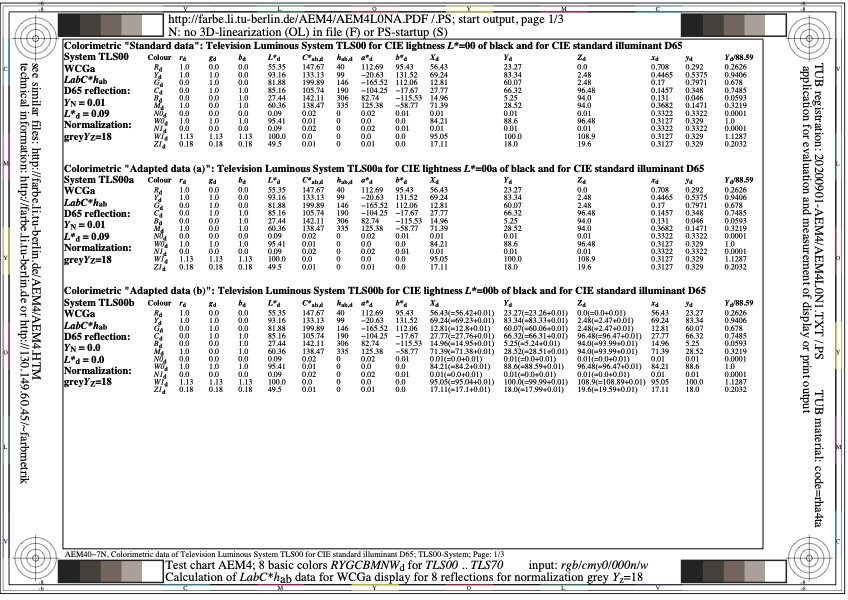
Figure AEM4L0N1.jpg: Output in format A6 of the file
AEM4L0NP.PDF, see
AEM4L0N1.
PS /
TXT /
PDF /
jpg
AEM4: TUB-test chart AEM4; WCGa-display reflections, YZa=18,0
rgb* input and LabC*h output in device hue planes
Reflections for 8 contrast steps according to ISO 9241-306
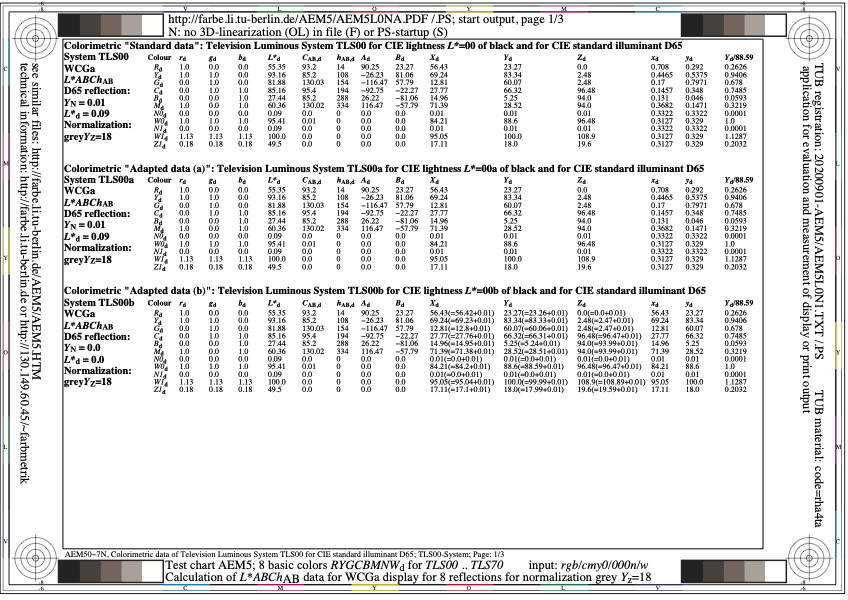
Figure AEM5L0N1.jpg: Output in format A6 of the file
AEM5L0NP.PDF, see
AEM5L0N1.
PS /
TXT /
PDF /
jpg
AEM5: TUB-test chart AEM5; WCGa-display reflections, YZa=18,0
rgb* input and L*ABCh output in device hue planes
Reflections for 8 contrast steps according to ISO 9241-306

Figure AEM6L0N1.jpg: Output in format A6 of the file
AEM6L0NP.PDF, see
AEM6L0N1.
PS /
TXT /
PDF /
jpg
AEM6: TUB-test chart AEM6; WCGa-display reflections, YZa=18,0
rgb* input and LabC*h output in device hue planes
Reflections for 8 contrast steps according to ISO 9241-306
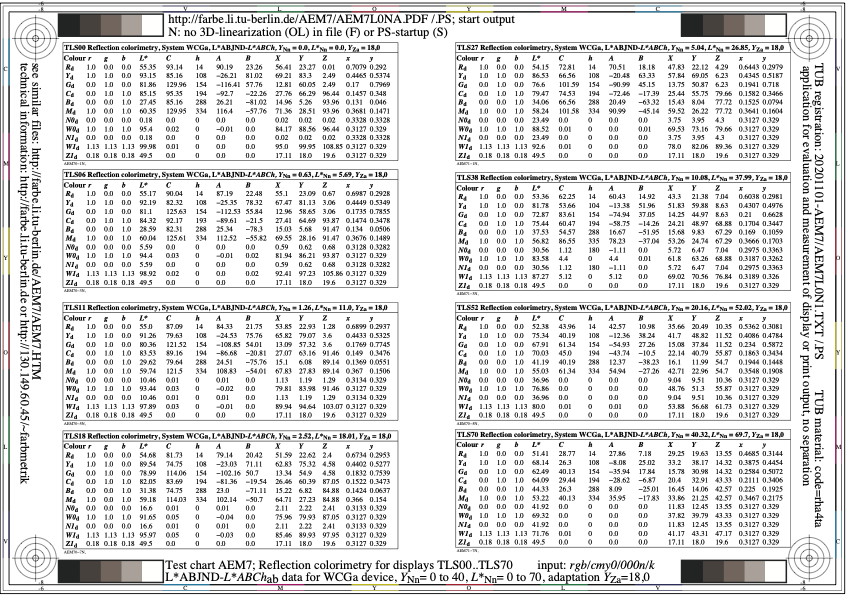
Figure AEM7L0N1.jpg: Output in format A6 of the file
AEM7L0NP.PDF, see
AEM7L0N1.
PS /
TXT /
PDF /
jpg
AEM7: TUB-test chart AEM7; WCGa-display reflections, YZa=18,0
rgb* input and L*ABCh output in device hue planes
Reflections for 8 contrast steps according to ISO 9241-306

Figure AEM8L0N1.jpg: Output in format A6 of the file
AEM8L0NP.PDF, see
AEM8L0N1.
PS /
TXT /
PDF /
jpg
AEM8: TUB-test chart AEM8; WCGa-display reflections, YZa=18,0
rgb* input and XYZ-output mixture in device hue planes
Reflections for 8 contrast steps according to ISO 9241-306
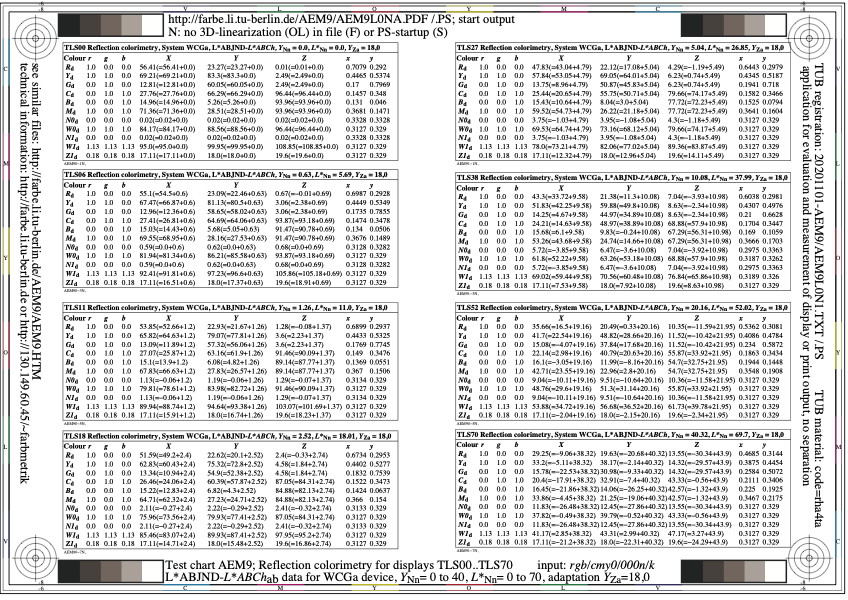
Figure AEM9L0N1.jpg: Output in format A6 of the file
AEM9L0NP.PDF, see
AEM9L0N1.
PS /
TXT /
PDF /
jpg
AEM9: TUB-test chart AEM9; WCGa-display reflections, YZa=18,0
rgb* input and XYZ-output mixture in device hue planes
Reflections for 8 contrast steps according to ISO 9241-306
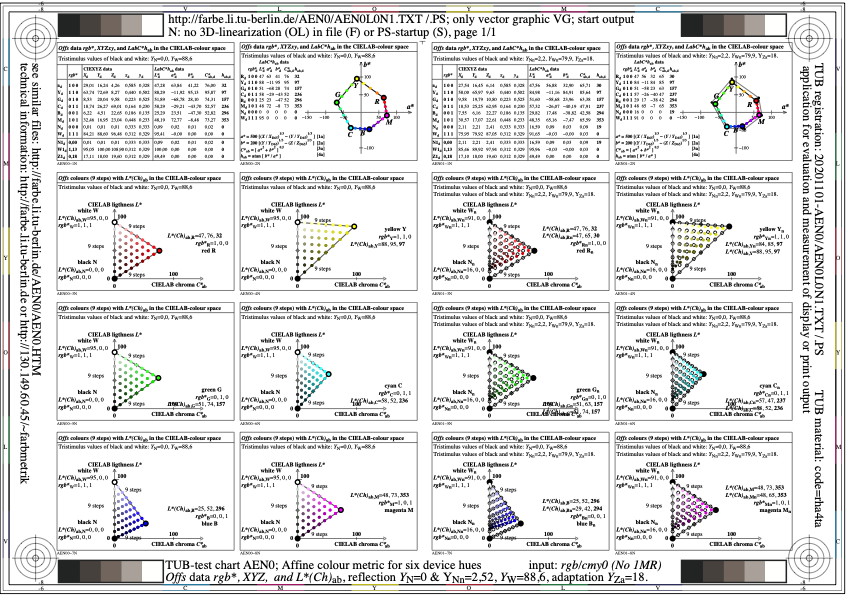
Figure AEN0L0N1.jpg: Output in format A6 of the file
AEN0L0NP.PDF, see
AEN0L0N1.
PS /
TXT /
PDF /
jpg
AEN0: TUB-test chart AEN0; Offs-display reflections
rgb* input and LabC*h output in device hue planes
Reflections YN=0 and YNn=2,5, adaptation YZa=18,0
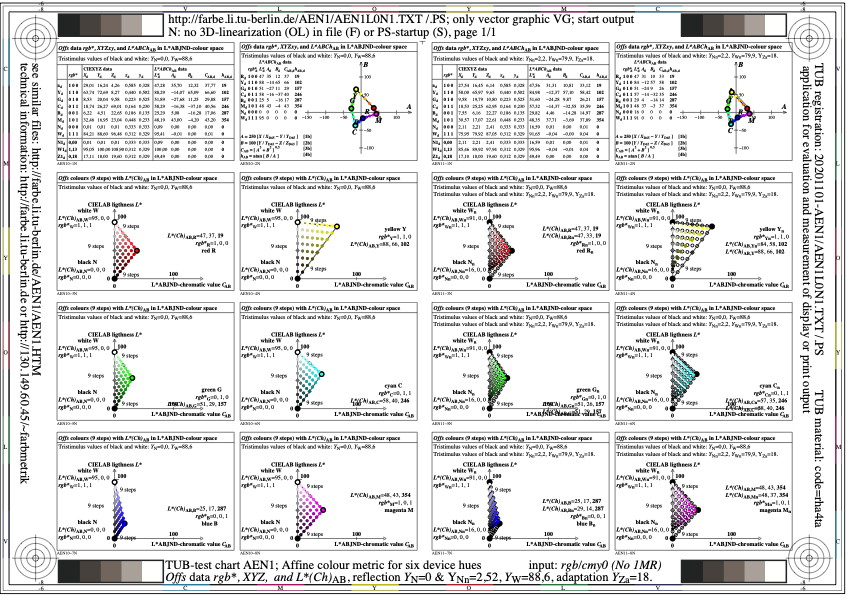
Figure AEN1L0N1.jpg: Output in format A6 of the file
AEN1L0NP.PDF, see
AEN1L0N1.
PS /
TXT /
PDF /
jpg
AEN1: TUB-test chart AEN1; Offs-display reflections
rgb* input and L*ABCh output in device hue planes
Reflections YN=0 and YNn=2,5, adaptation YZa=18,0
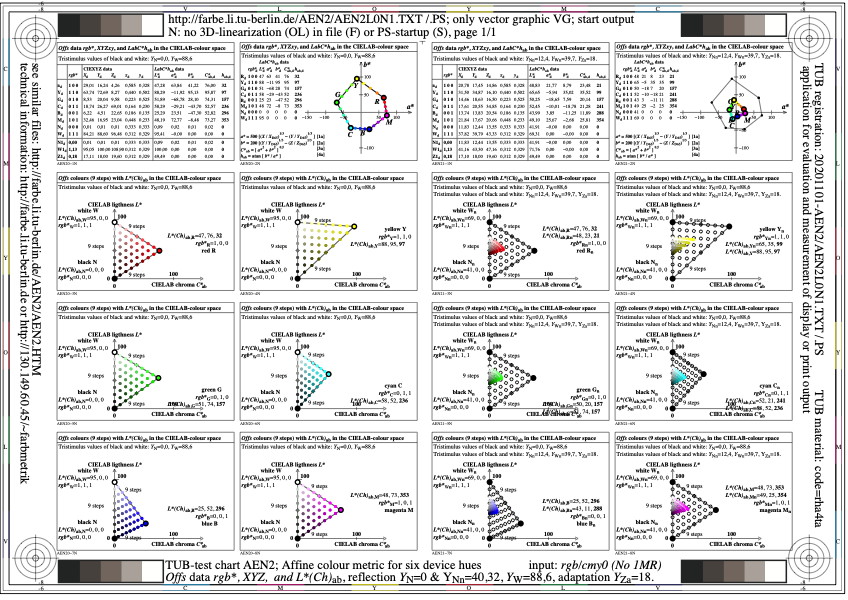
Figure AEN2L0N1.jpg: Output in format A6 of the file
AEN2L0NP.PDF, see
AEN2L0N1.
PS /
TXT /
PDF /
jpg
AEN2: TUB-test chart AEN2; Offs-display reflections
rgb* input and LabC*h output in device hue planes
Reflections YN=0 and YNn=40,3, adaptation YZa=18,0
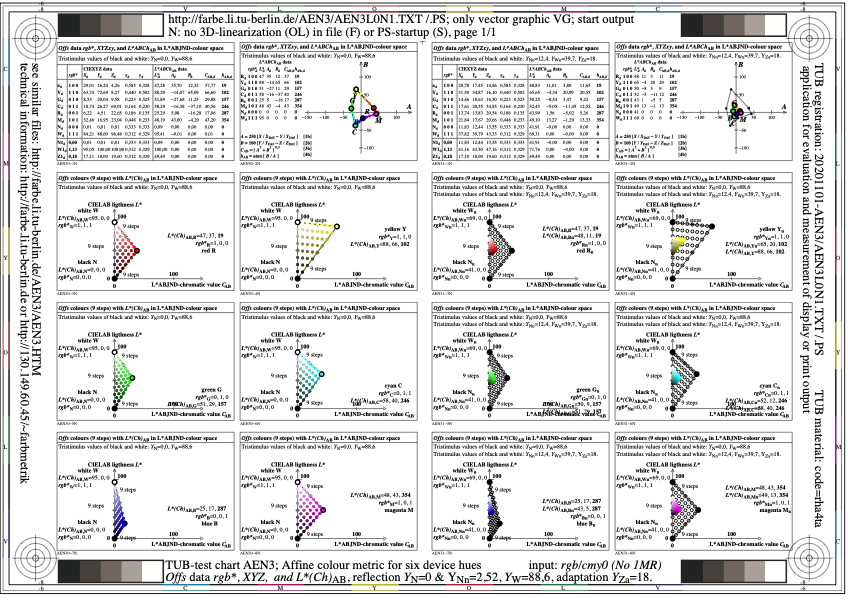
Figure AEN3L0N1.jpg: Output in format A6 of the file
AEN3L0NP.PDF, see
AEN3L0N1.
PS /
TXT /
PDF /
jpg
AEN3: TUB-test chart AEN3; Offs-display reflections
rgb* input and L*ABCh output in device hue planes
Reflections YN=0 and YNn=40,3, adaptation YZa=18,0
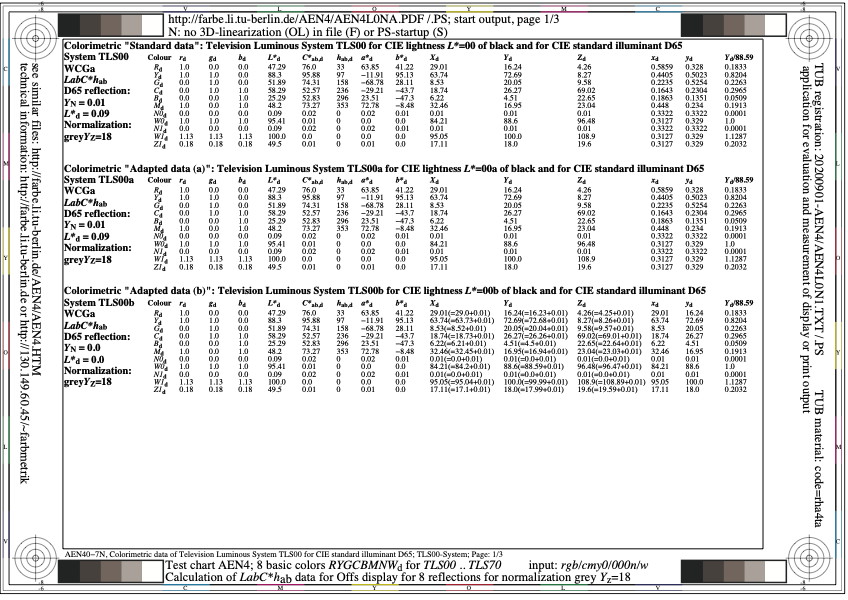
Figure AEN4L0N1.jpg: Output in format A6 of the file
AEN4L0NP.PDF, see
AEN4L0N1.
PS /
TXT /
PDF /
jpg
AEN4: TUB-test chart AEN4; Offs-display reflections, YZa=18,0
rgb* input and LabC*h output in device hue planes
Reflections for 8 contrast steps according to ISO 9241-306

Figure AEN5L0N1.jpg: Output in format A6 of the file
AEN5L0NP.PDF, see
AEN5L0N1.
PS /
TXT /
PDF /
jpg
AEN5: TUB-test chart AEN5; Offs-display reflections, YZa=18,0
rgb* input and L*ABCh output in device hue planes
Reflections for 8 contrast steps according to ISO 9241-306

Figure AEN6L0N1.jpg: Output in format A6 of the file
AEN6L0NP.PDF, see
AEN6L0N1.
PS /
TXT /
PDF /
jpg
AEN6: TUB-test chart AEN6; Offs-display reflections, YZa=18,0
rgb* input and LabC*h output in device hue planes
Reflections for 8 contrast steps according to ISO 9241-306
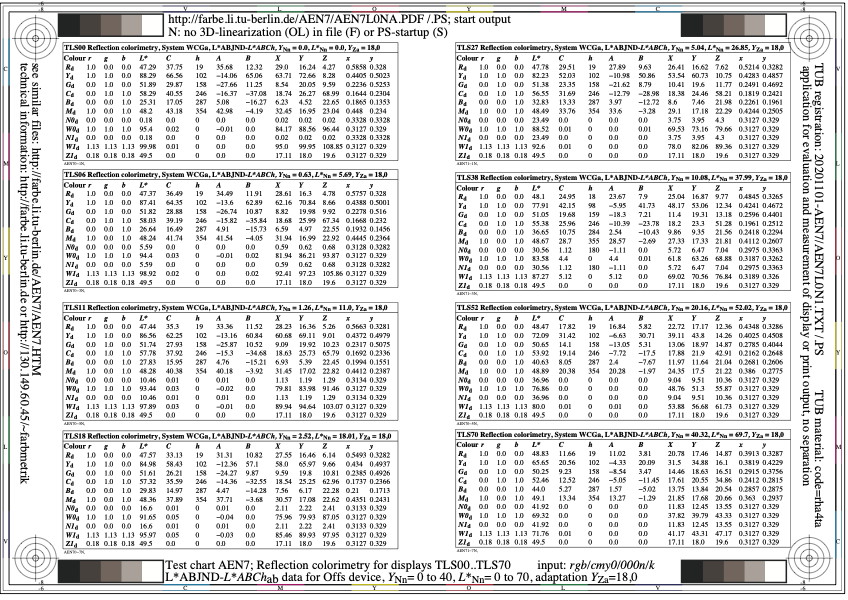
Figure AEN7L0N1.jpg: Output in format A6 of the file
AEN7L0NP.PDF, see
AEN7L0N1.
PS /
TXT /
PDF /
jpg
AEN7: TUB-test chart AEN7; Offs-display reflections, YZa=18,0
rgb* input and L*ABCh output in device hue planes
Reflections for 8 contrast steps according to ISO 9241-306

Figure AEN8L0N1.jpg: Output in format A6 of the file
AEN8L0NP.PDF, see
AEN8L0N1.
PS /
TXT /
PDF /
jpg
AEN8: TUB-test chart AEN8; Offs-display reflections, YZa=18,0
rgb* input and XYZ-output mixture in device hue planes
Reflections for 8 contrast steps according to ISO 9241-306
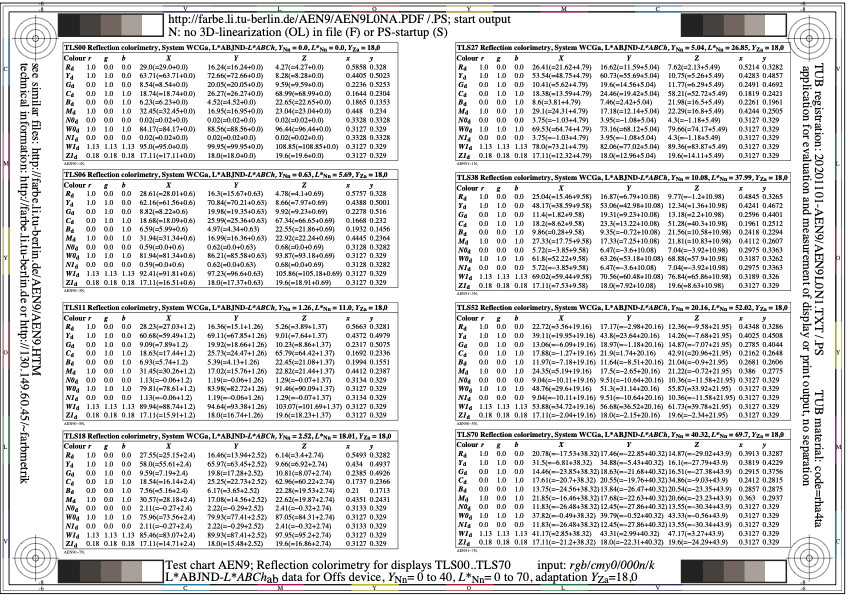
Figure AEN9L0N1.jpg: Output in format A6 of the file
AEN9L0NP.PDF, see
AEN9L0N1.
PS /
TXT /
PDF /
jpg
AEN9: TUB-test chart AEN9; Offs-display reflections, YZa=18,0
rgb* input and XYZ-output mixture in device hue planes
Reflections for 8 contrast steps according to ISO 9241-306
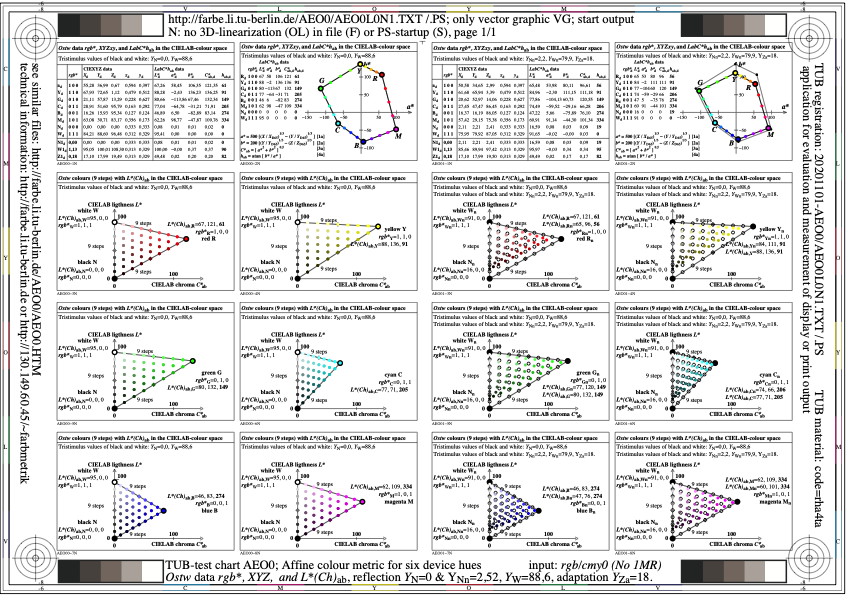
Figure AEO0L0N1.jpg: Output in format A6 of the file
AEO0L0NP.PDF, see
AEO0L0N1.
PS /
TXT /
PDF /
jpg
AEO0: TUB-test chart AEO0; Ostw-display reflections
rgb* input and LabC*h output in device hue planes
Reflections YN=0 and YNn=2,5, adaptation YZa=18,0
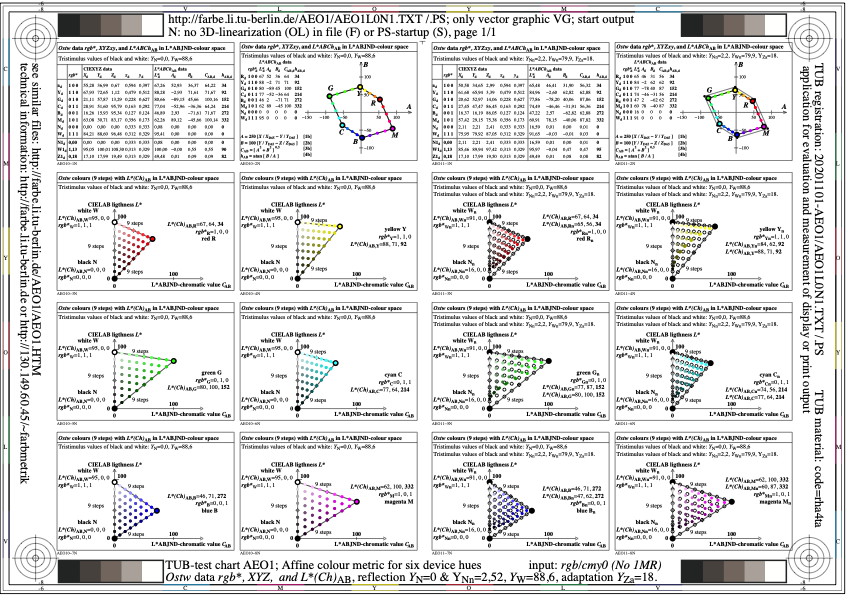
Figure AEO1L0N1.jpg: Output in format A6 of the file
AEO1L0NP.PDF, see
AEO1L0N1.
PS /
TXT /
PDF /
jpg
AEO1: TUB-test chart AEO1; Ostw-display reflections
rgb* input and L*ABCh output in device hue planes
Reflections YN=0 and YNn=2,5, adaptation YZa=18,0
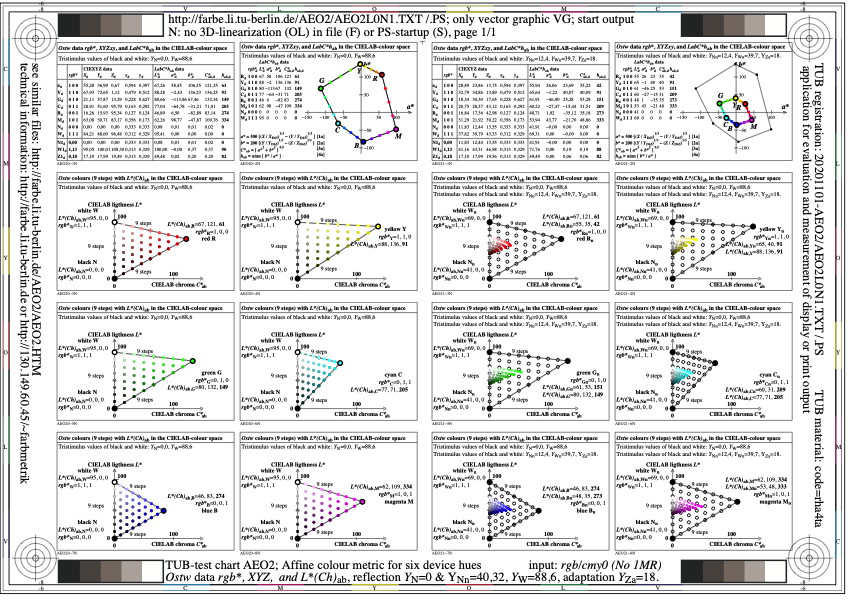
Figure AEO2L0N1.jpg: Output in format A6 of the file
AEO2L0NP.PDF, see
AEO2L0N1.
PS /
TXT /
PDF /
jpg
AEO2: TUB-test chart AEO2; Ostw-display reflections
rgb* input and LabC*h output in device hue planes
Reflections YN=0 and YNn=40,3, adaptation YZa=18,0
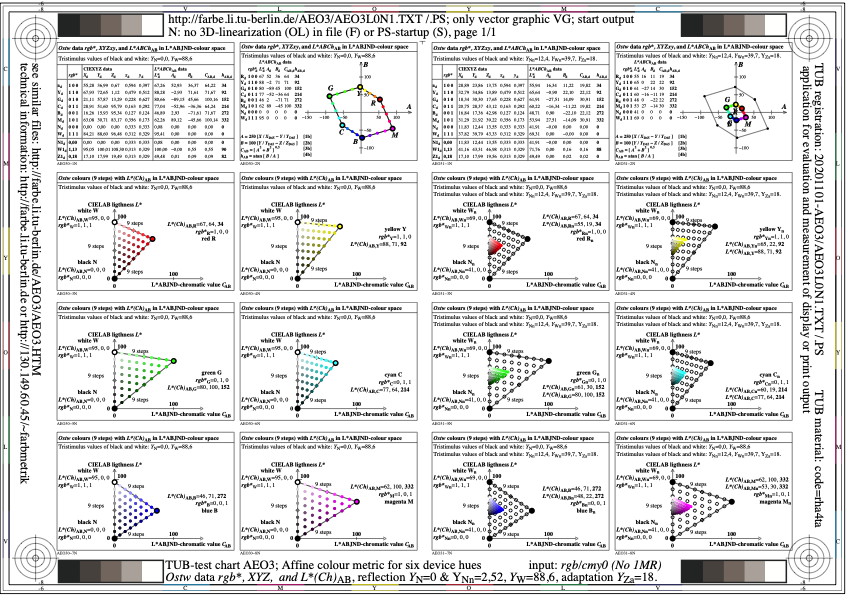
Figure AEO3L0N1.jpg: Output in format A6 of the file
AEO3L0NP.PDF, see
AEO3L0N1.
PS /
TXT /
PDF /
jpg
AEO3: TUB-test chart AEO3; Ostw-display reflections
rgb* input and L*ABCh output in device hue planes
Reflections YN=0 and YNn=40,3, adaptation YZa=18,0

Figure AEO4L0N1.jpg: Output in format A6 of the file
AEO4L0NP.PDF, see
AEO4L0N1.
PS /
TXT /
PDF /
jpg
AEO4: TUB-test chart AEO4; Ostw-display reflections, YZa=18,0
rgb* input and LabC*h output in device hue planes
Reflections for 8 contrast steps according to ISO 9241-306
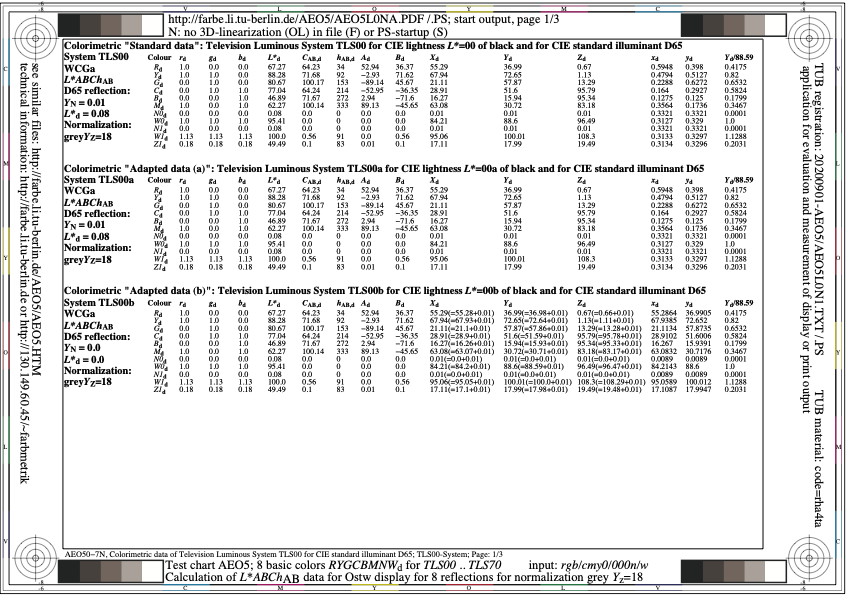
Figure AEO5L0N1.jpg: Output in format A6 of the file
AEO5L0NP.PDF, see
AEO5L0N1.
PS /
TXT /
PDF /
jpg
AEO5: TUB-test chart AEO5; Ostw-display reflections, YZa=18,0
rgb* input and L*ABCh output in device hue planes
Reflections for 8 contrast steps according to ISO 9241-306

Figure AEO6L0N1.jpg: Output in format A6 of the file
AEO6L0NP.PDF, see
AEO6L0N1.
PS /
TXT /
PDF /
jpg
AEO6: TUB-test chart AEO6; Ostw-display reflections, YZa=18,0
rgb* input and LabC*h output in device hue planes
Reflections for 8 contrast steps according to ISO 9241-306

Figure AEO7L0N1.jpg: Output in format A6 of the file
AEO7L0NP.PDF, see
AEO7L0N1.
PS /
TXT /
PDF /
jpg
AEO7: TUB-test chart AEO7; Ostw-display reflections, YZa=18,0
rgb* input and L*ABCh output in device hue planes
Reflections for 8 contrast steps according to ISO 9241-306

Figure AEO8L0N1.jpg: Output in format A6 of the file
AEO8L0NP.PDF, see
AEO8L0N1.
PS /
TXT /
PDF /
jpg
AEO8: TUB-test chart AEO8; Ostw-display reflections, YZa=18,0
rgb* input and XYZ-output mixture in device hue planes
Reflections for 8 contrast steps according to ISO 9241-306

Figure AEO9L0N1.jpg: Output in format A6 of the file
AEO9L0NP.PDF, see
AEO9L0N1.
PS /
TXT /
PDF /
jpg
AEO9: TUB-test chart AEO9; Ostw-display reflections, YZa=18,0
rgb* input and XYZ-output mixture in device hue planes
Reflections for 8 contrast steps according to ISO 9241-306
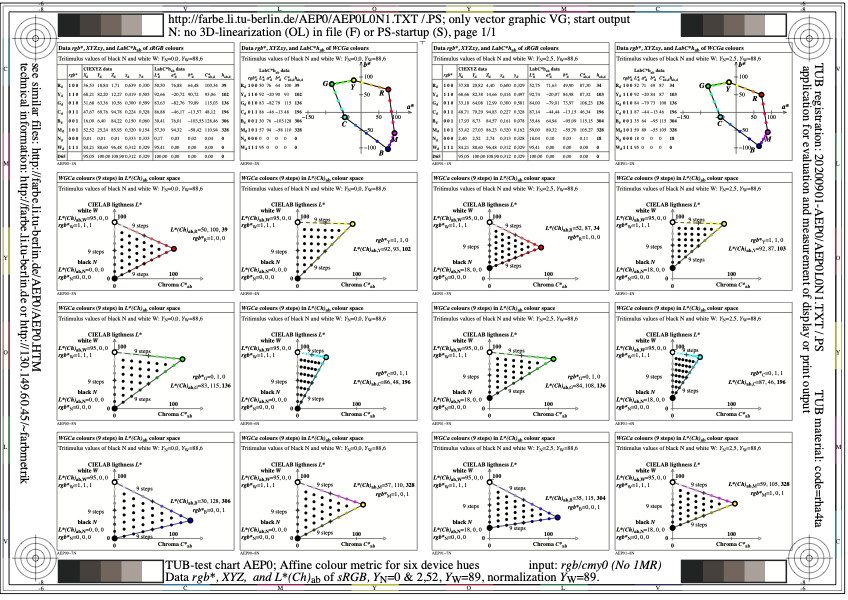
Figure AEP0L0N1.jpg: Output in format A6 of the file
AEP0L0NP.PDF, see
AEP0L0N1.
PS /
TXT /
PDF /
jpg
AEP0: TUB-Test chart AEQ0; Ostwald-optimal colours
Continuous hue circle with elementary colours
Chromaticity (x,y) and chromatic value (A, B)
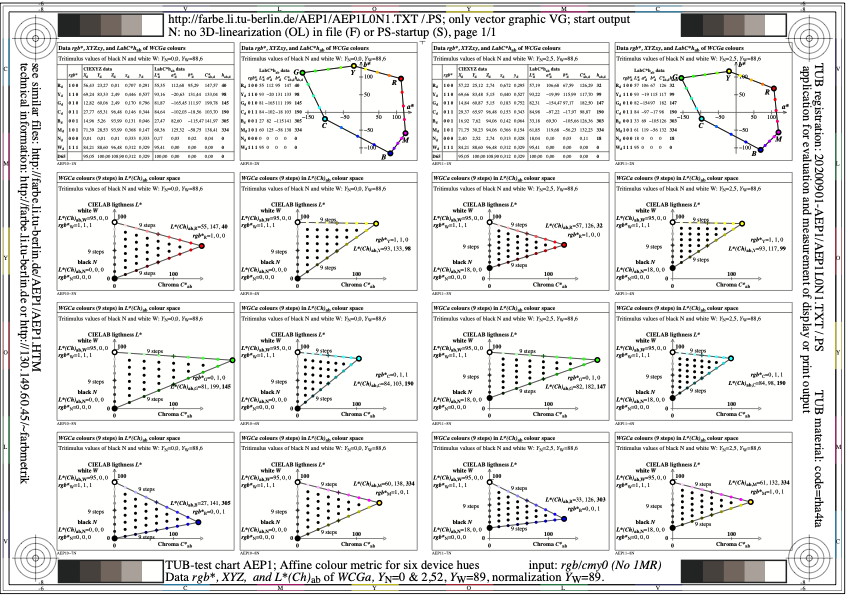
Figure AEP1L0N1.jpg: Output in format A6 of the file
AEP1L0NP.PDF, see
AEP1L0N1.
PS /
TXT /
PDF /
jpg
AEP1: TUB-test chart AEQ1; Colour vision
Physiological signals in colour vision
as function of luminance and chromaticity
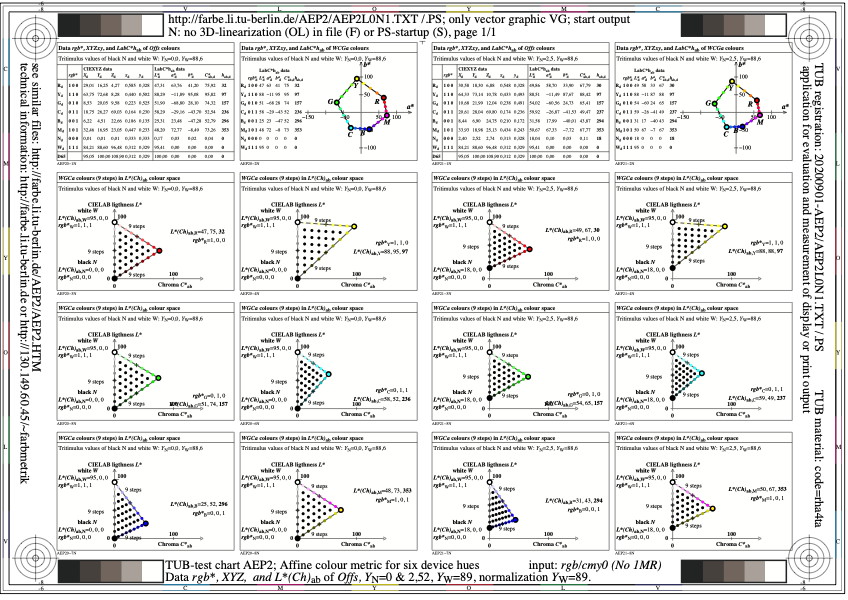
Figure AEP2L0N1.jpg: Output in format A6 of the file
AEP2L0NP.PDF, see
AEP2L0N1.
PS /
TXT /
PDF /
jpg
AEP2: TUB-Test chart AEQ2; Colour threshold experiments
viewing situations for separate and adjacent colours
chromaticity (x,y), LABJND formula and line elements
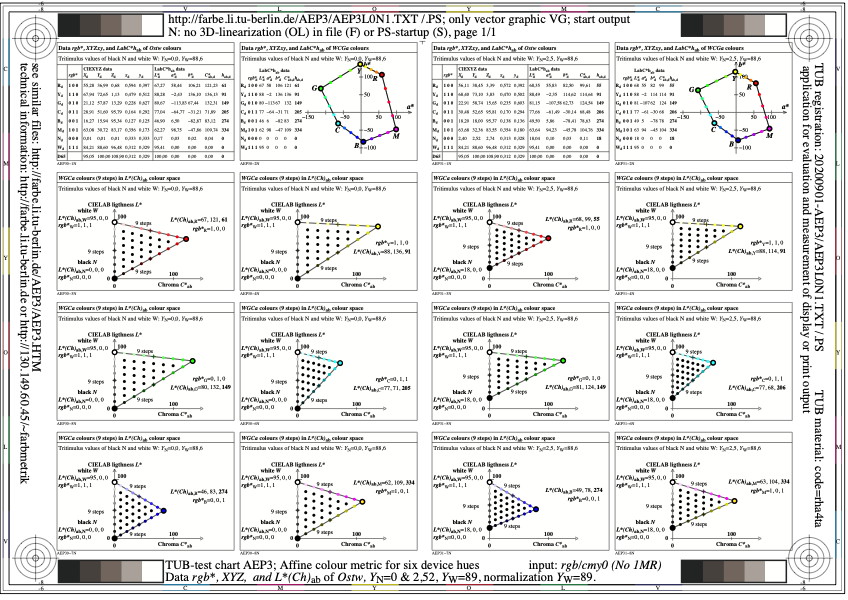
Figure AEP3L0N1.jpg: Output in format A6 of the file
AEP3L0NP.PDF, see
AEP3L0N1.
PS /
TXT /
PDF /
jpg
AEP3: TUB-Test chart AEQ3; Luminance discrimination
Model for separate and adjacent samples
Relations between Weber and Stevens law at threshold
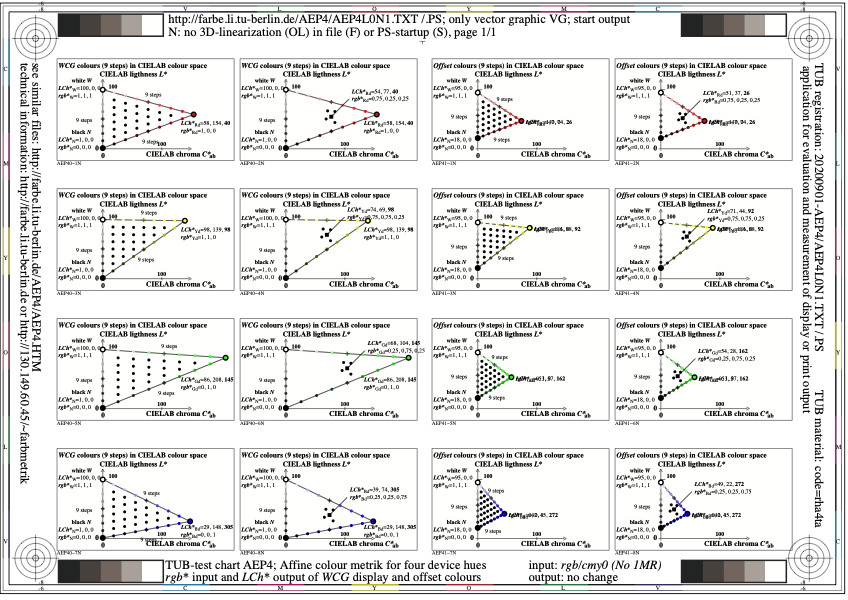
Figure AEP4L0N1.jpg: Output in format A6 of the file
AEP4L0NP.PDF, see
AEP4L0N1.
PS /
TXT /
PDF /
jpg
AEP4: TUB-test chart AEQ4; Achromatic thresholds for 5 Lu,
thresholds delta_L (0,4s), contrast and lightness;
experimental data of Lingelbach and Richter
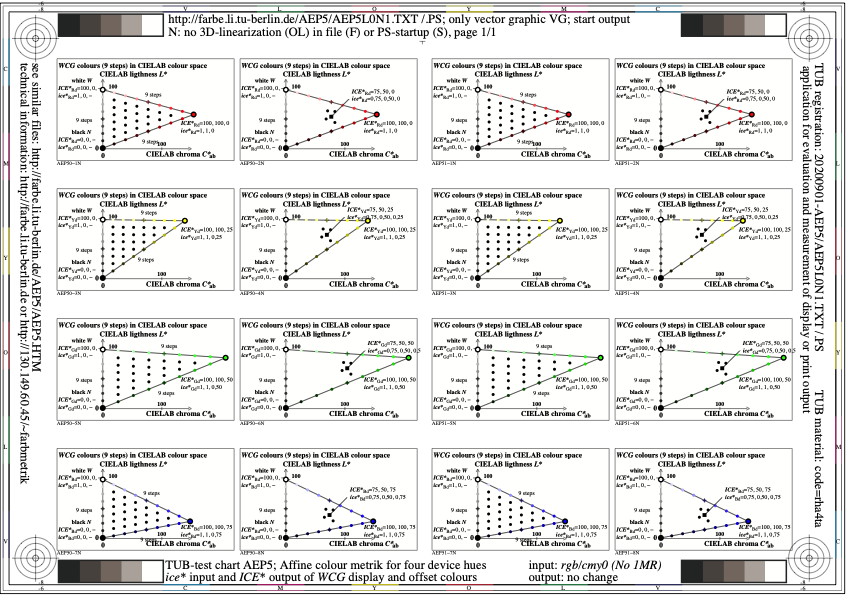
Figure AEP5L0N1.jpg: Output in format A6 of the file
AEP5L0NP.PDF, see
AEP5L0N1.
PS /
TXT /
PDF /
jpg
AEP5: TUB-test chart AEQ5; Colour thresholds and scaling
Experiments as function of luminance and chromaticity
Luminance discrimination and luminace contrasts
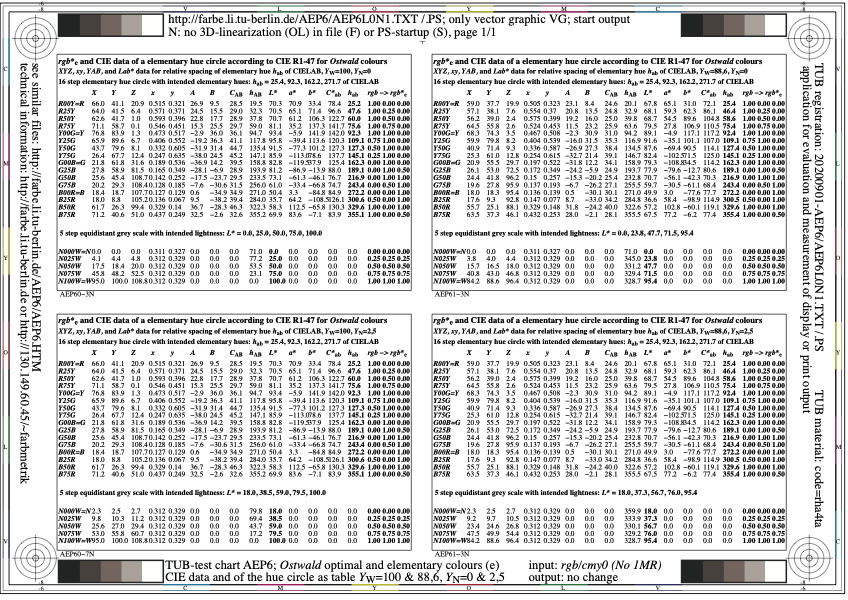
Figure AEP6L0N1.jpg: Output in format A6 of the file
AEP6L0NP.PDF, see
AEP6L0N1.
PS /
TXT /
PDF /
jpg
AEP6: TUB-test chart AEQ6; Device (d) and elementary (e) colours
Ostwald-optimal colours as XYZ data, and in chromaticity,
chroma, and chromatic value diagrams, YWa=100
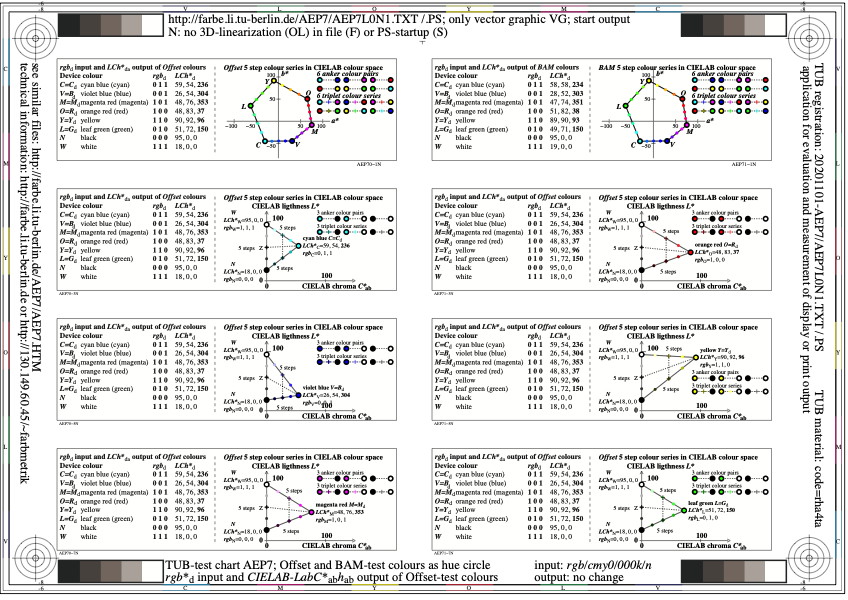
Figure AEP7L0N1.jpg: Output in format A6 of the file
AEP7L0NP.PDF, see
AEP7L0N1.
PS /
TXT /
PDF /
jpg
AEP7: TUB-test chart AEQ7; Device (d) and elementary (e) colours
Ostwald-optimal colours as YABCh(AB) data and as
LabCh*(ab) data with wavelength limits, YWa=100
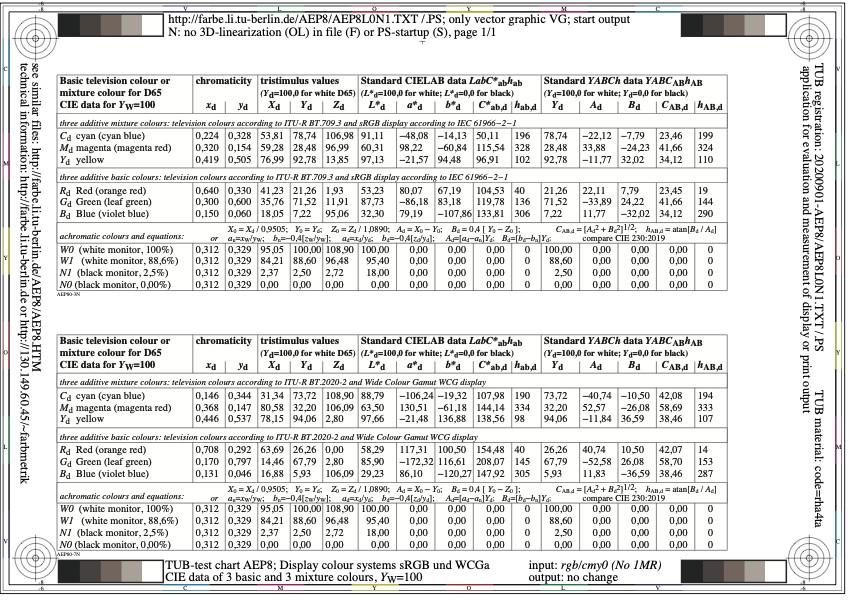
Figure AEP8L0N1.jpg: Output in format A6 of the file
AEP8L0NP.PDF, see
AEP8L0N1.
PS /
TXT /
PDF /
jpg
AEP8: TUB-test chart AEQ8; Device (d) and elementary (e) colours
Ostwald-optimal colours as XYZ data, and in chromaticity,
chroma, and chromatic value diagrams, YWa=88,6

Figure AEP9L0N1.jpg: Output in format A6 of the file
AEP9L0NP.PDF, see
AEP9L0N1.
PS /
TXT /
PDF /
jpg
AEP9: TUB-test chart AEQ9; Device (d) and elementary (e) colours
Ostwald-optimal colours as YABCh(AB) data and as
LabCh*(ab) data with wavelength limits, YWa=88,6
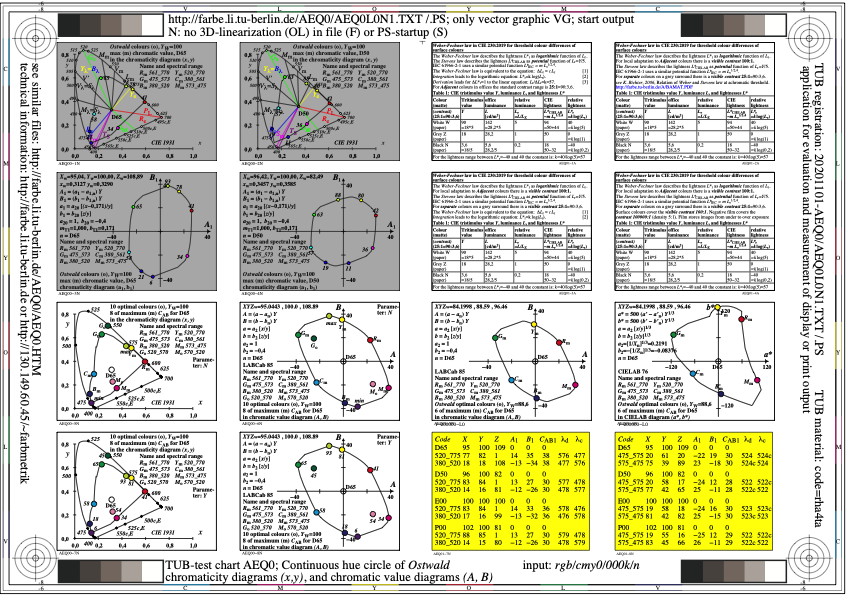
Figure AEQ0L0N1.jpg: Output in format A6 of the file
AEQ0L0NP.PDF, see
AEQ0L0N1.
PS /
TXT /
PDF /
jpg
AEQ0: TUB-Test chart AEQ0; Ostwald-optimal colours
Continuous hue circle with elementary colours
Chromaticity (x,y) and chromatic value (A, B)
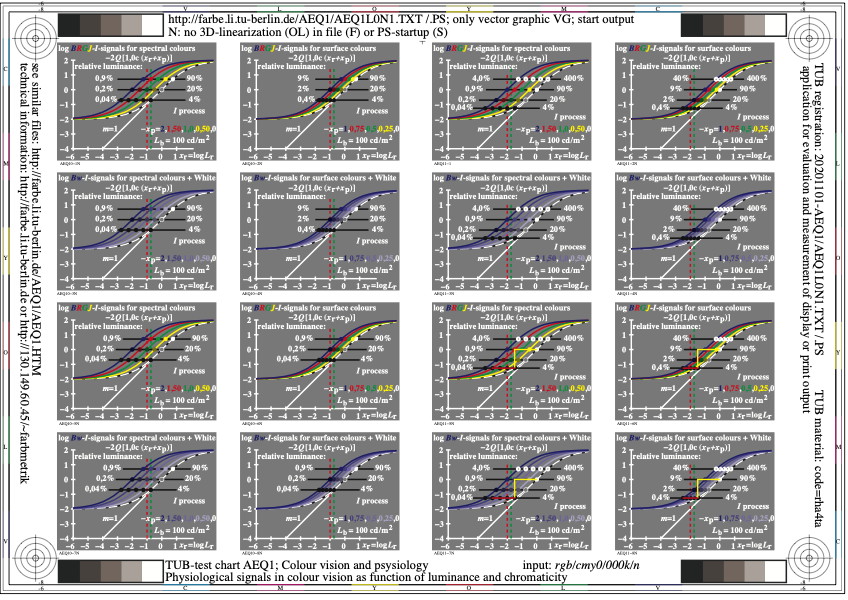
Figure AEQ1L0N1.jpg: Output in format A6 of the file
AEQ1L0NP.PDF, see
AEQ1L0N1.
PS /
TXT /
PDF /
jpg
AEQ1: TUB-test chart AEQ1; Colour vision
Physiological signals in colour vision
as function of luminance and chromaticity
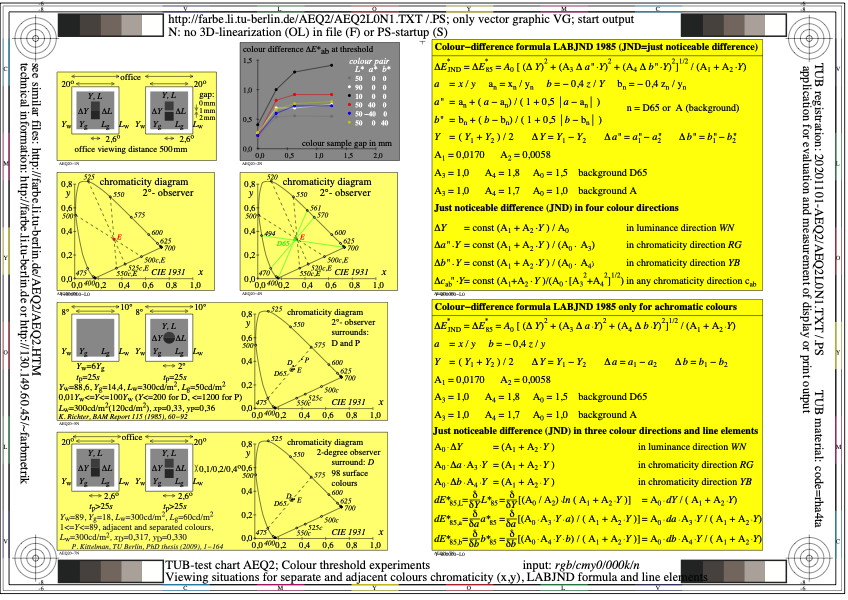
Figure AEQ2L0N1.jpg: Output in format A6 of the file
AEQ2L0NP.PDF, see
AEQ2L0N1.
PS /
TXT /
PDF /
jpg
AEQ2: TUB-Test chart AEQ2; Colour threshold experiments
viewing situations for separate and adjacent colours
chromaticity (x,y), LABJND formula and line elements
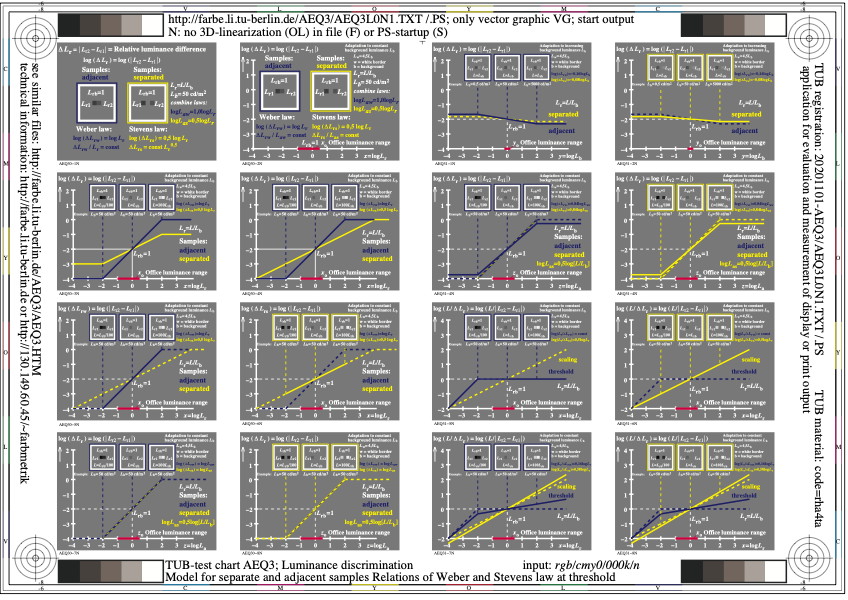
Figure AEQ3L0N1.jpg: Output in format A6 of the file
AEQ3L0NP.PDF, see
AEQ3L0N1.
PS /
TXT /
PDF /
jpg
AEQ3: TUB-Test chart AEQ3; Luminance discrimination
Model for separate and adjacent samples
Relations between Weber and Stevens law at threshold
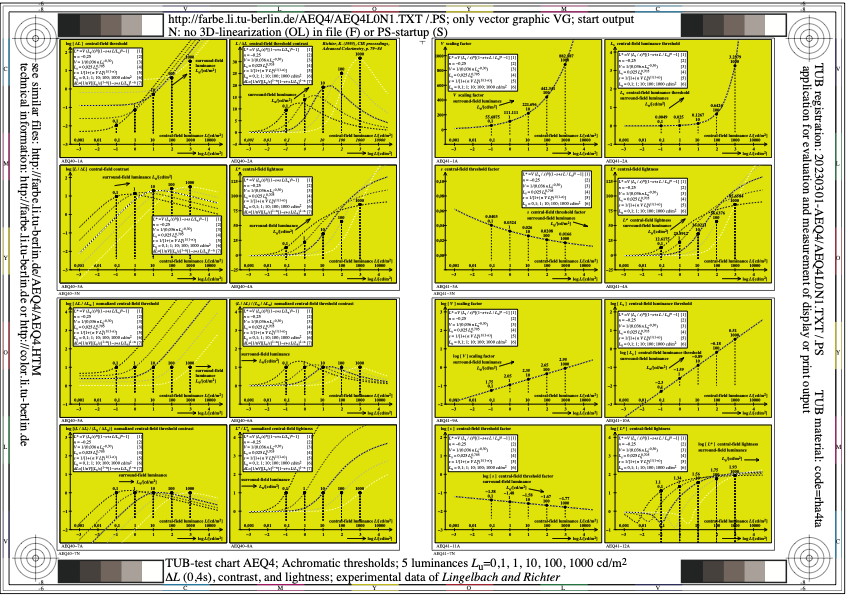
Figure AEQ4L0N1.jpg: Output in format A6 of the file
AEQ4L0NP.PDF, see
AEQ4L0N1.
PS /
TXT /
PDF /
jpg
AEQ4: TUB-test chart AEQ4; Achromatic thresholds for 5 Lu,
thresholds delta_L (0,4s), contrast and lightness;
experimental data of Lingelbach and Richter
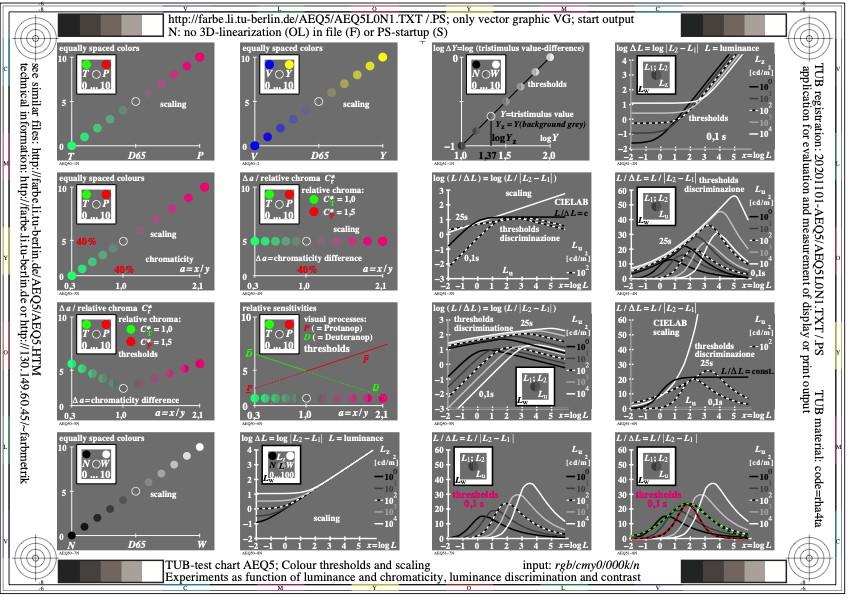
Figure AEQ5L0N1.jpg: Output in format A6 of the file
AEQ5L0NP.PDF, see
AEQ5L0N1.
PS /
TXT /
PDF /
jpg
AEQ5: TUB-test chart AEQ5; Colour thresholds and scaling
Experiments as function of luminance and chromaticity
Luminance discrimination and luminace contrasts

Figure AEQ6L0N1.jpg: Output in format A6 of the file
AEQ6L0NP.PDF, see
AEQ6L0N1.
PS /
TXT /
PDF /
jpg
AEQ6: TUB-test chart AEQ6; Device (d) and elementary (e) colours
Ostwald-optimal colours as XYZ data, and in chromaticity,
chroma, and chromatic value diagrams, YWa=100
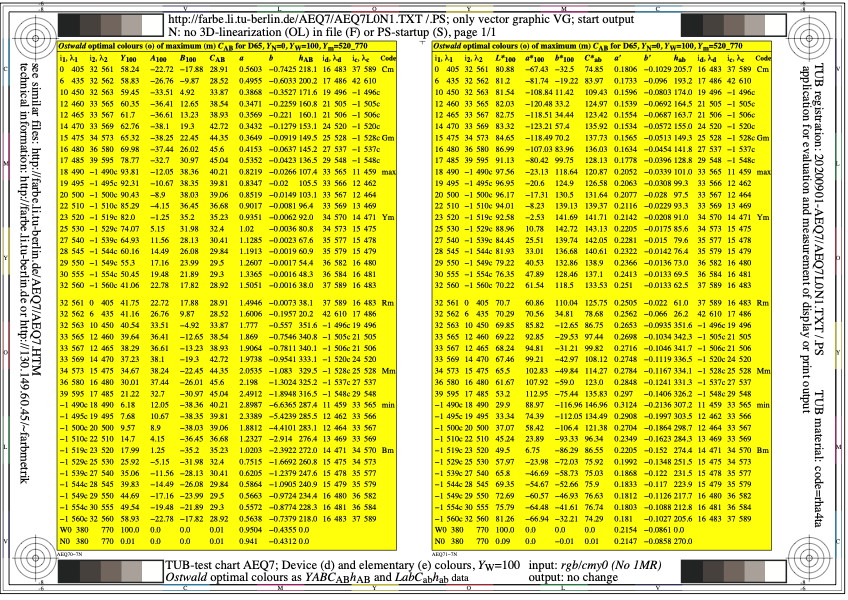
Figure AEQ7L0N1.jpg: Output in format A6 of the file
AEQ7L0NP.PDF, see
AEQ7L0N1.
PS /
TXT /
PDF /
jpg
AEQ7: TUB-test chart AEQ7; Device (d) and elementary (e) colours
Ostwald-optimal colours as YABCh(AB) data and as
LabCh*(ab) data with wavelength limits, YWa=100
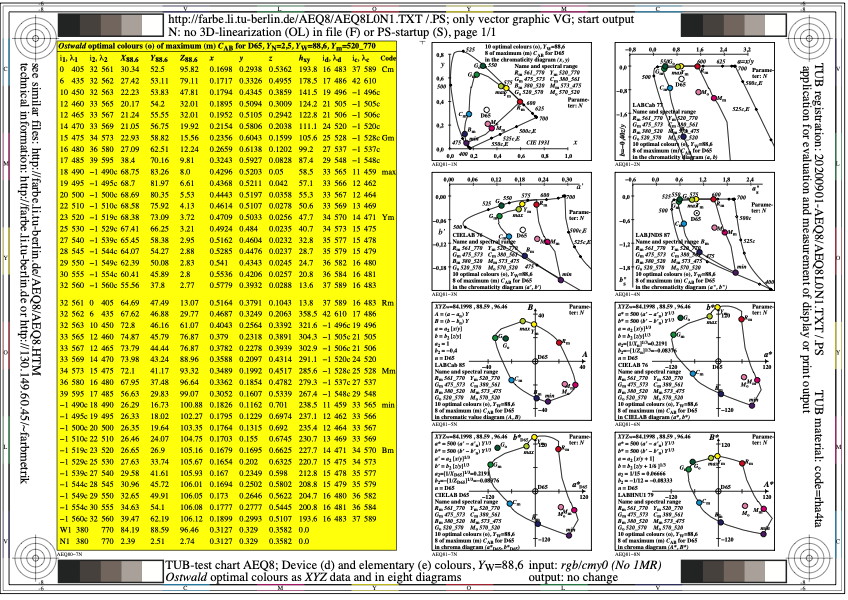
Figure AEQ8L0N1.jpg: Output in format A6 of the file
AEQ8L0NP.PDF, see
AEQ8L0N1.
PS /
TXT /
PDF /
jpg
AEQ8: TUB-test chart AEQ8; Device (d) and elementary (e) colours
Ostwald-optimal colours as XYZ data, and in chromaticity,
chroma, and chromatic value diagrams, YWa=88,6
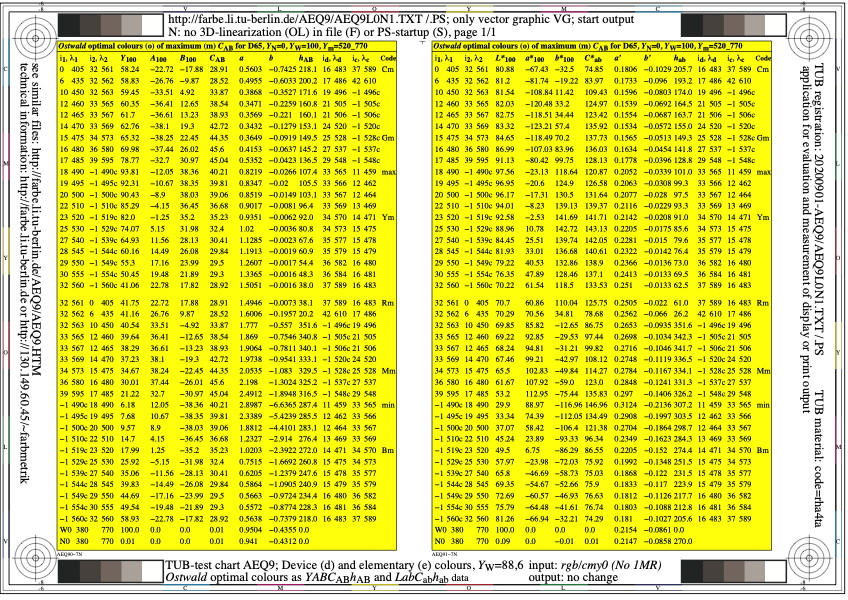
Figure AEQ9L0N1.jpg: Output in format A6 of the file
AEQ9L0NP.PDF, see
AEQ9L0N1.
PS /
TXT /
PDF /
jpg
AEQ9: TUB-test chart AEQ9; Device (d) and elementary (e) colours
Ostwald-optimal colours as YABCh(AB) data and as
LabCh*(ab) data with wavelength limits, YWa=88,6

Figure AER0L0N1.jpg: Output in format A6 of the file
AER0L0NP.PDF, see
AER0L0N1.
PS /
TXT /
PDF /
jpg
AER0: TUB-test chart AER0; Colorimetry for Ostwald colours
Colour spaces CIEXYZ, YABJND, CIELAB, LABHNU1_79, 2 images
Data for CIE illuminant D65, 2-degree observer
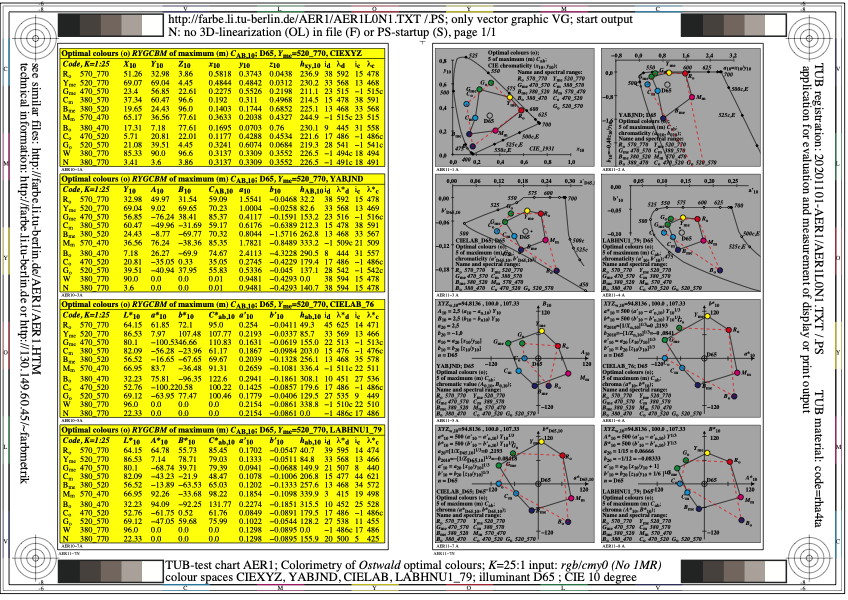
Figure AER1L0N1.jpg: Output in format A6 of the file
AER1L0NP.PDF, see
AER1L0N1.
PS /
TXT /
PDF /
jpg
AER1: TUB-test chart AER1; Colorimetry for Ostwald colours
Colour spaces CIEXYZ, YABJND, CIELAB, LABHNU1_79, 2 images
Data for CIE illuminant D65, 10-degree observer
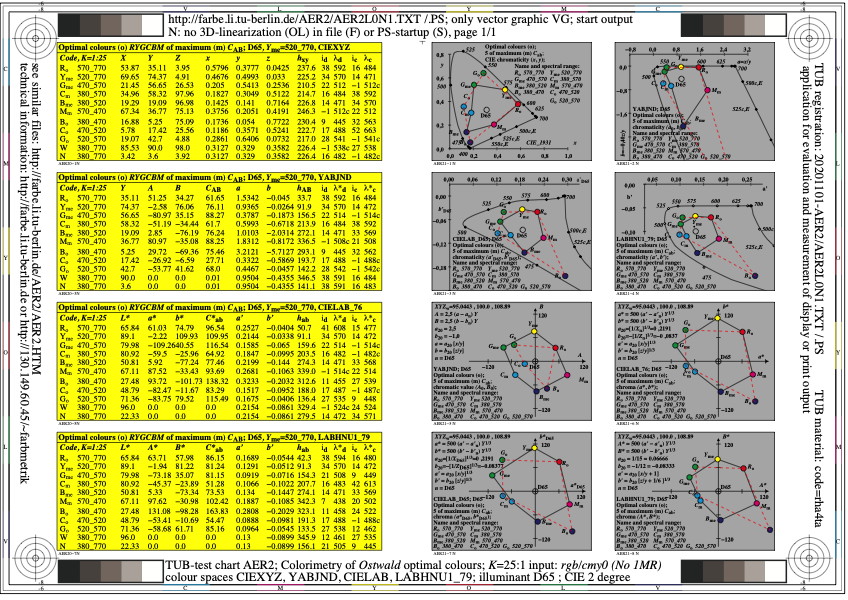
Figure AER2L0N1.jpg: Output in format A6 of the file
AER2L0NP.PDF, see
AER2L0N1.
PS /
TXT /
PDF /
jpg
AER2: TUB-test chart AER2; Colorimetry for Ostwald colours
Colour spaces CIEXYZ, YABJND, CIELAB, LABHNU1_79, 12 images
Data for CIE illuminant D65, 2-degree observer

Figure AER3L0N1.jpg: Output in format A6 of the file
AER3L0NP.PDF, see
AER3L0N1.
PS /
TXT /
PDF /
jpg
AER3: TUB-test chart AER3; Colorimetry for Ostwald colours
Colour spaces CIEXYZ, YABJND, CIELAB, LABHNU1_79, 12 images
Data for CIE illuminant D65, 10-degree observer
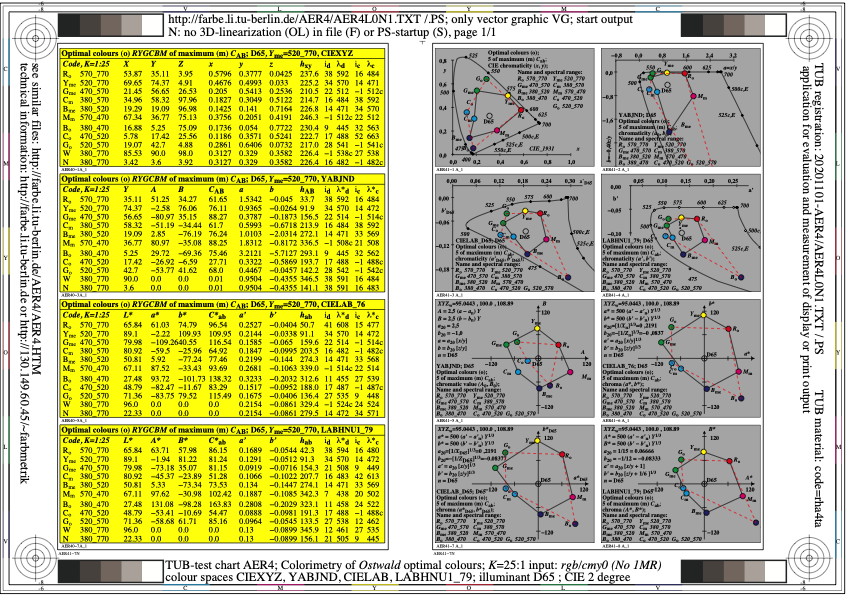
Figure AER4L0N1.jpg: Output in format A6 of the file
AER4L0NP.PDF, see
AER4L0N1.
PS /
TXT /
PDF /
jpg
AER4: TUB-test chart AER4; Colorimetry for Ostwald colours
Colour spaces CIEXYZ, YABJND, CIELAB, LABHNU1_79, 2x8 images
Data for eight CIE illuminants, 2-degree observer

Figure AER5L0N1.jpg: Output in format A6 of the file
AER5L0NP.PDF, see
AER5L0N1.
PS /
TXT /
PDF /
jpg
AER5: TUB-test chart AER5; Colorimetry for Ostwald colours
Colour spaces CIEXYZ, YABJND, CIELAB, LABHNU1_79, 2x8 images
Data for eight CIE illuminants, 10-degree observer
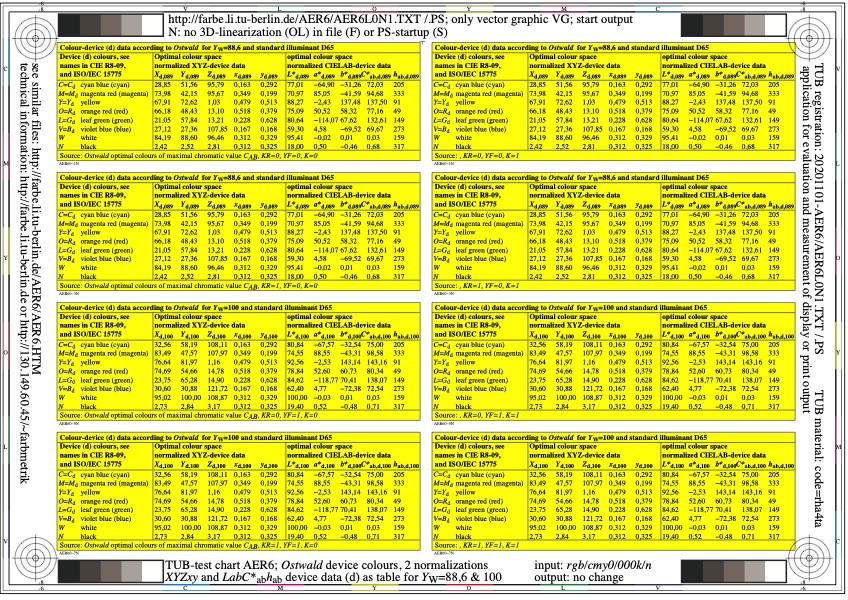
Figure AER6L0N1.jpg: Output in format A6 of the file
AER6L0NP.PDF, see
AER6L0N1.
PS /
TXT /
PDF /
jpg
AER6: TUB-test chart AER6; Ostwald device colours (d)
XYZxy and LabC*h device data
for two adaptations YWa=100 and Ywa=88,6
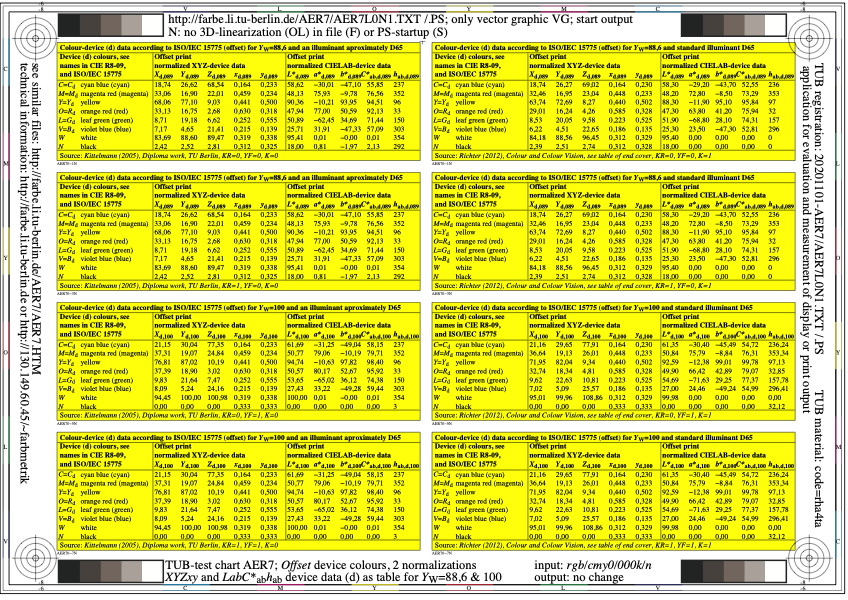
Figure AER7L0N1.jpg: Output in format A6 of the file
AER7L0NP.PDF, see
AER7L0N1.
PS /
TXT /
PDF /
jpg
AER7: TUB-test chart AER7; Offset device colours (d)
XYZxy and LabC*h device data
for two adaptations YWa=100 and Ywa=88,6
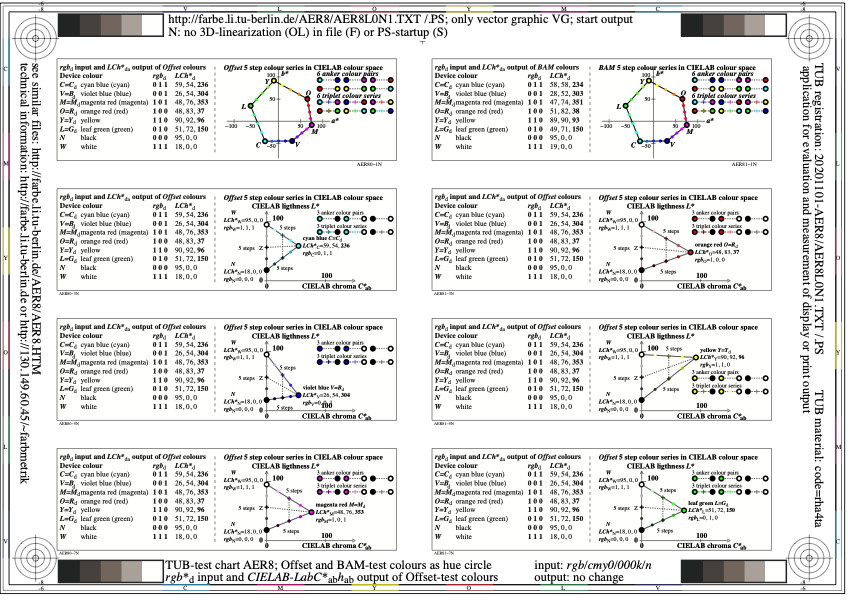
Figure AER8L0N1.jpg: Output in format A6 of the file
AER8L0NP.PDF, see
AER8L0N1.
PS /
TXT /
PDF /
jpg
AER8: TUB-test chart AER8; Offset and BAM-test colours
rgb*d input and LCh*ab output colours as table,
and in hue planes for offset-test colours
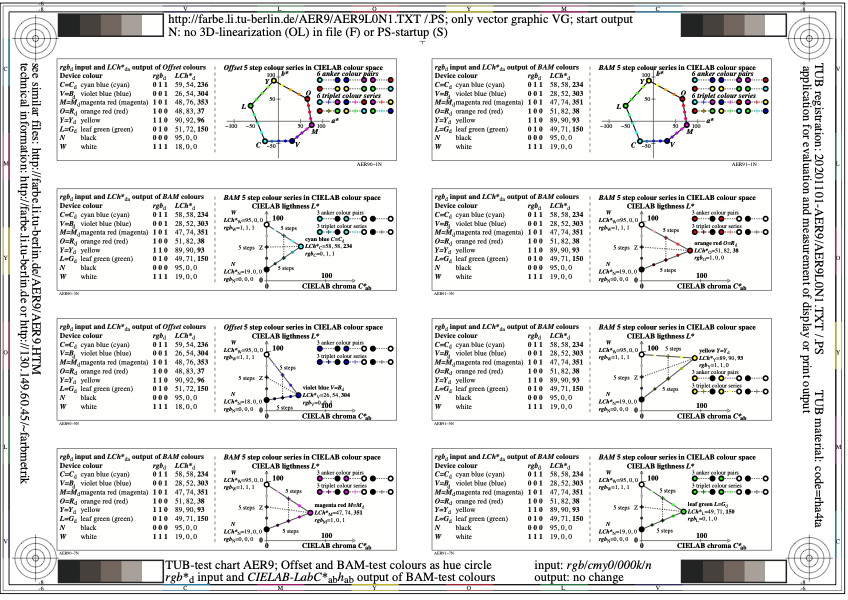
Figure AER9L0N1.jpg: Output in format A6 of the file
AER9L0NP.PDF, see
AER9L0N1.
PS /
TXT /
PDF /
jpg
AER9: TUB-test chart AER9; Offset and BAM-test colours
rgb*d input and LCh*ab output colours as table,
and in hue planes for BAM-test colours
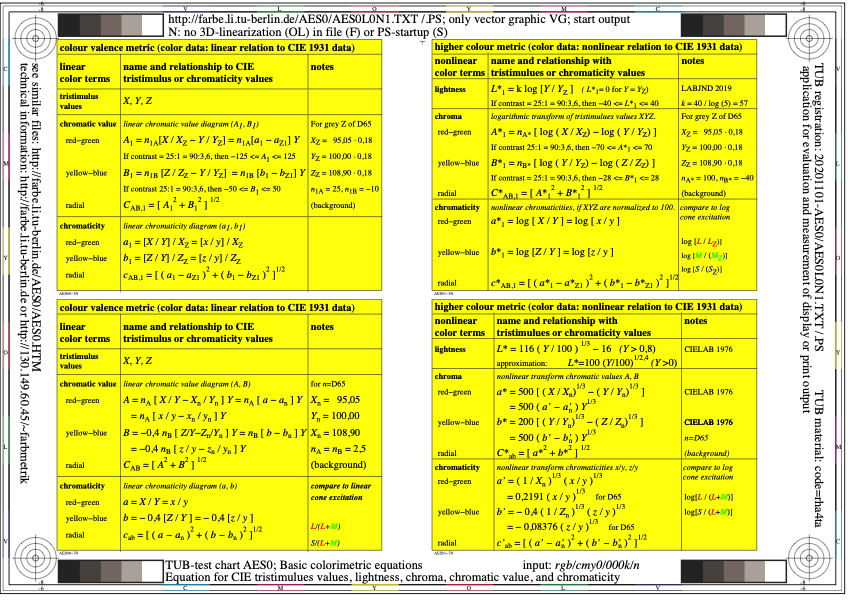
Figure AES0L0N1.jpg: Output in format A6 of the file
AES0L0NP.PDF, see
AES0L0N1.
PS /
TXT /
PDF /
jpg
AES0: TUB-test chart AES0; Basic colorimetric equations
Equation for CIE tristimulues values and lightness
Equations for chroma, chromatic value, and chromaticity
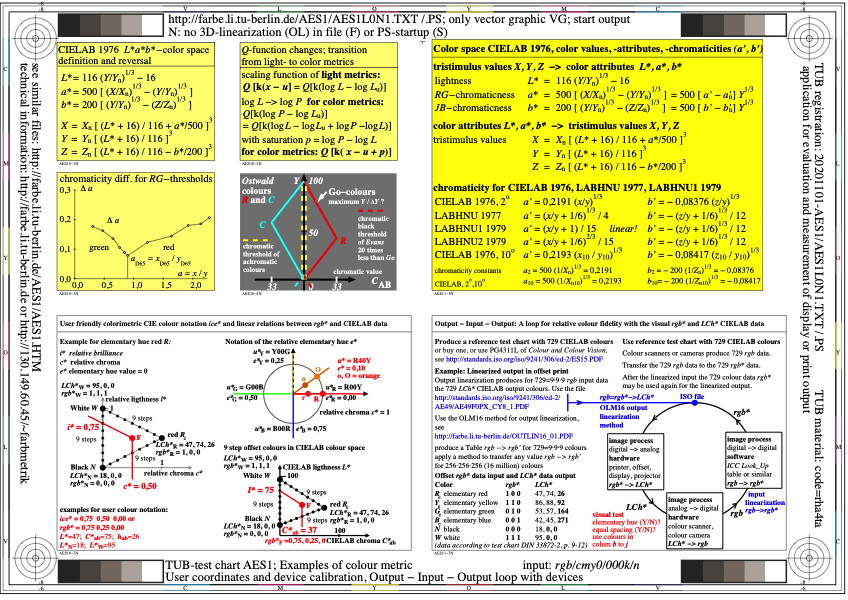
Figure AES1L0N1.jpg: Output in format A6 of the file
AES1L0NP.PDF, see
AES1L0N1.
PS /
TXT /
PDF /
jpg
AES1: TUB-test chart AES1; Examples of colour metric II
Application: User coordinates and device calibration
Output - Input - Output loop with devices
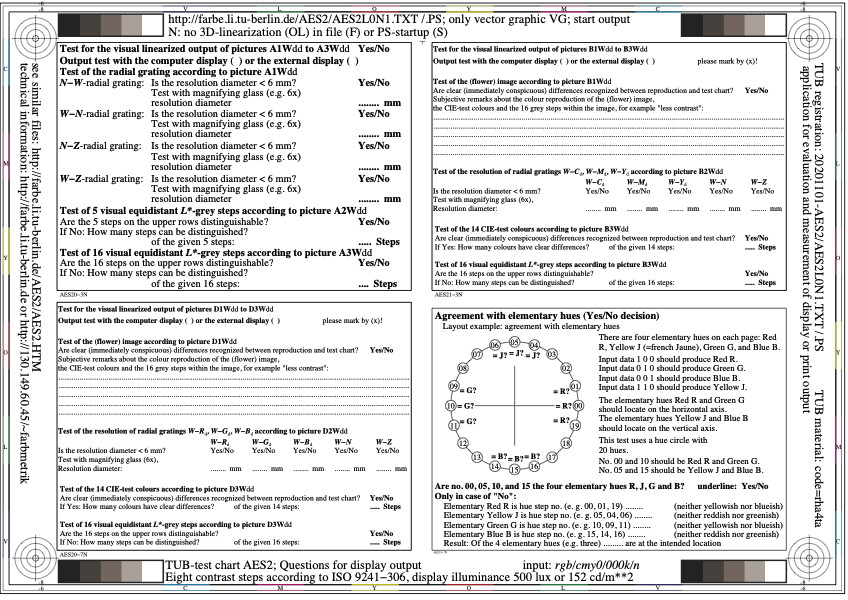
Figure AES2L0N1.jpg: Output in format A6 of the file
AES2L0NP.PDF, see
AES2L0N1.
PS /
TXT /
PDF /
jpg
AES2: TUB-Test chart AES2; Questions for display output
Eight contrast steps according to ISO 9241-306
Display illuminance 500 lux or 152 cd/m**2 of white
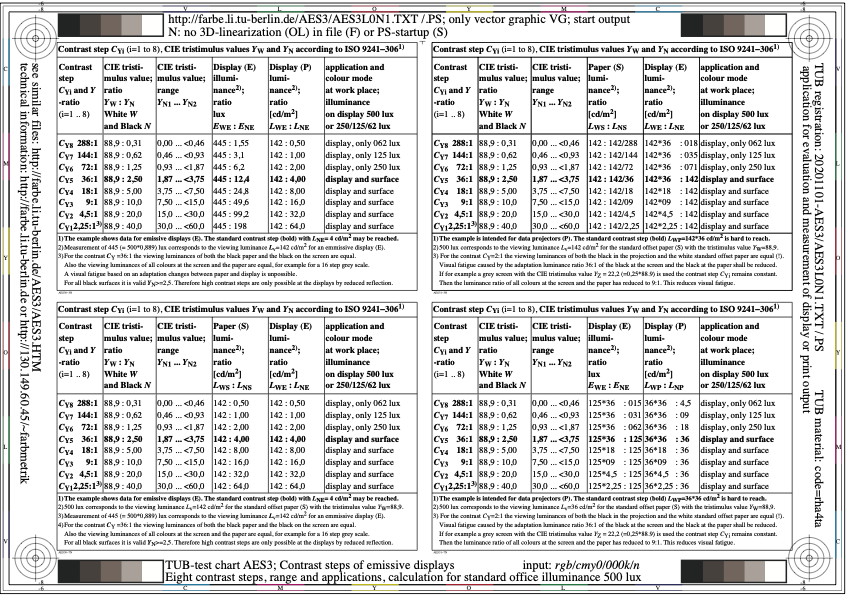
Figure AES3L0N1.jpg: Output in format A6 of the file
AES3L0NP.PDF, see
AES3L0N1.
PS /
TXT /
PDF /
jpg
AES3: TUB-test chart AES3; Contrast steps of emissive displays
Eight contrast steps, range and applications
Calculation for standard office illuminance 500 lux
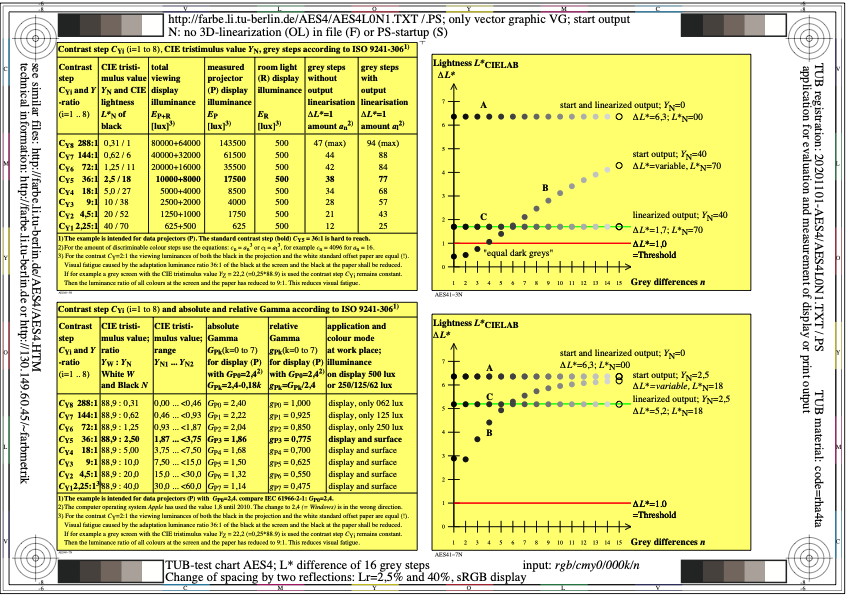
Figure AES4L0N1.jpg: Output in format A6 of the file
AES4L0NP.PDF, see
AES4L0N1.
PS /
TXT /
PDF /
jpg
AES4: TUB-test chart AES4; L* difference of 16 grey steps
change of spacing by two reflections:
Lr=2,5% and 40%, sRGB display
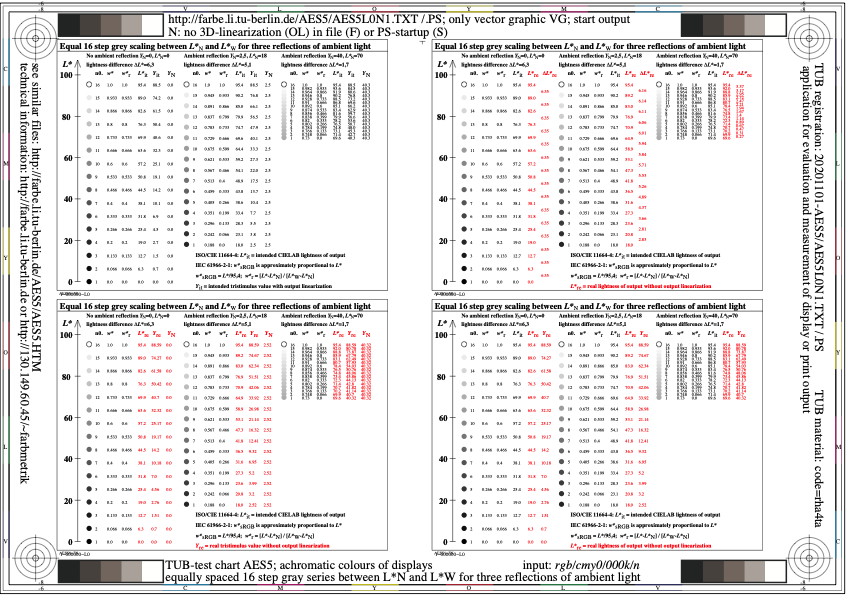
Figure AES5L0N1.jpg: Output in format A6 of the file
AES5L0NP.PDF, see
AES5L0N1.
PS /
TXT /
PDF /
jpg
AES5: TUB-Test chart AES5; achromatic colours of displays
Equally spaced 16 step gray series between
L*N and L*W for three reflections of ambient light
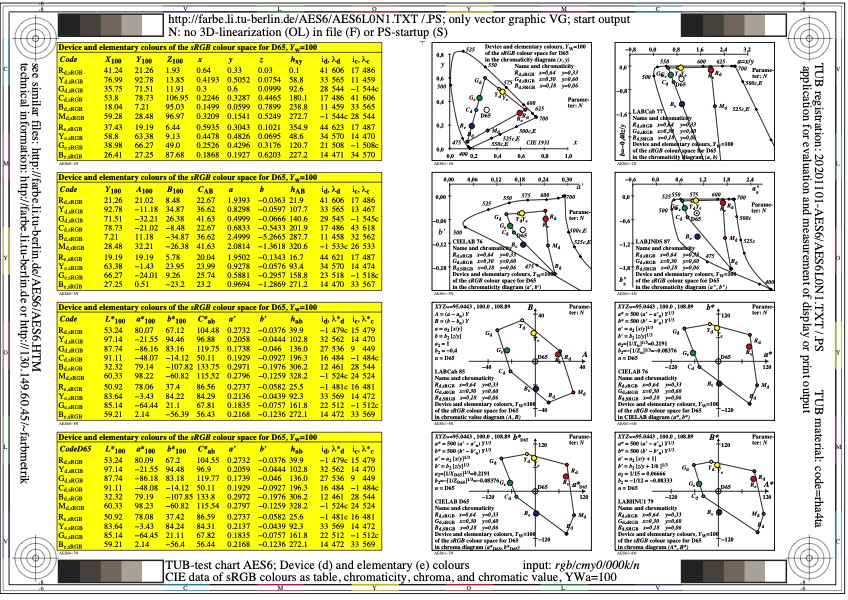
Figure AES6L0N1.jpg: Output in format A6 of the file
AES6L0NP.PDF, see
AES6L0N1.
PS /
TXT /
PDF /
jpg
AES6: TUB-test chart AES6; Device (d) and elementary (e) colours
CIE data of sRGB colours as table, and in chromaticity,
chroma, and chromatic value diagrams, YWa=100

Figure AES7L0N1.jpg: Output in format A6 of the file
AES7L0NP.PDF, see
AES7L0N1.
PS /
TXT /
PDF /
jpg
AES7: TUB-test chart AES7; Device (d) and elementary (e) colours
CIE data of sRGB colours as table, and in chromaticity,
chroma, and chromatic value diagrams, YWa=88,6
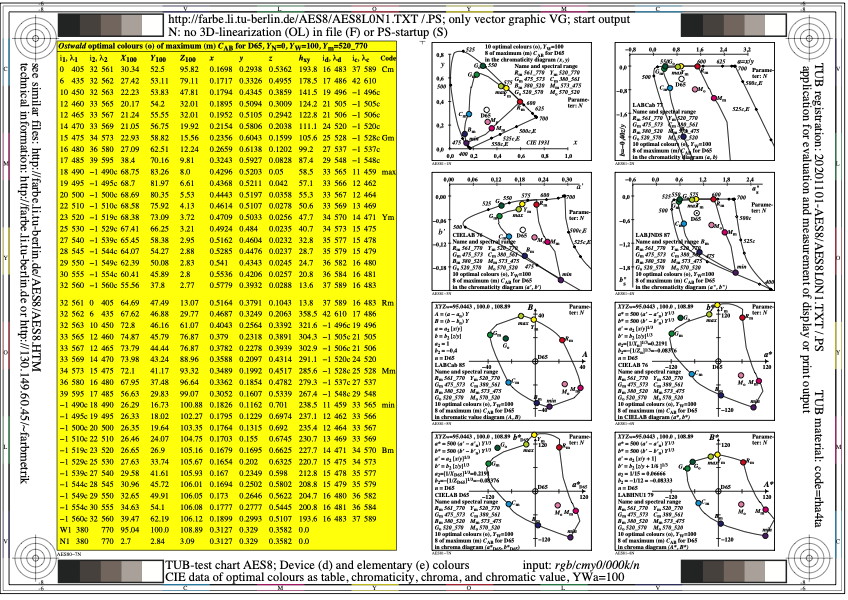
Figure AES8L0N1.jpg: Output in format A6 of the file
AES8L0NP.PDF, see
AES8L0N1.
PS /
TXT /
PDF /
jpg
AES8: TUB-test chart AES8; Device (d) and elementary (e) colours
CIE data of optimal colours as table, and in chromaticity,
chroma, and chromatic value diagrams, YWa=100

Figure AES9L0N1.jpg: Output in format A6 of the file
AES9L0NP.PDF, see
AES9L0N1.
PS /
TXT /
PDF /
jpg
AES9: TUB-test chart AES9; Device (d) and elementary (e) colours
CIE data of optimal colours as table, and in chromaticity,
chroma, and chromatic value diagrams, YWa=88,6
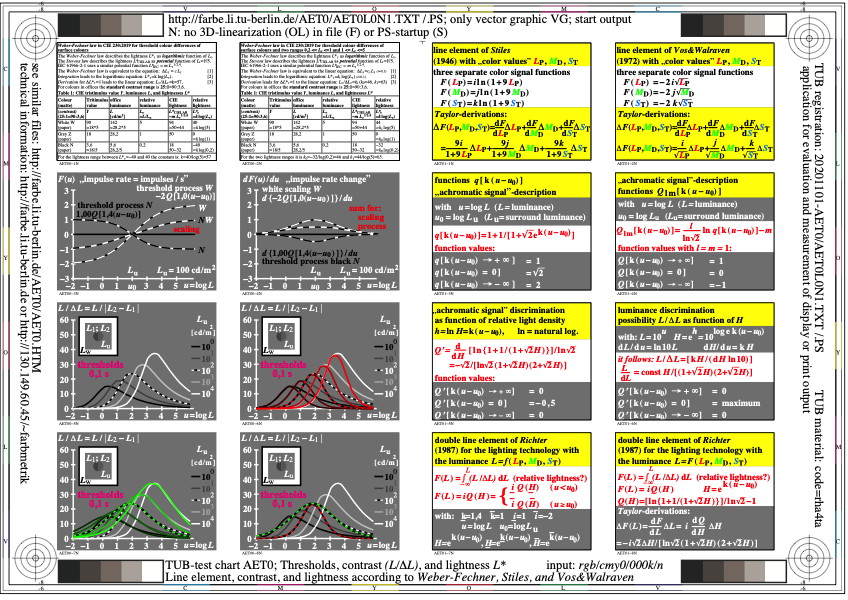
Figure AET0L0N1.jpg: Output in format A6 of the file
AET0L0NP.PDF, see
AET0L0N1.
PS /
TXT /
PDF /
jpg
AET0: TUB-Test chart AET0; Line element for colour scaling
contrast and colorimetric, psycho-physical,
and physiological properties of colour vision
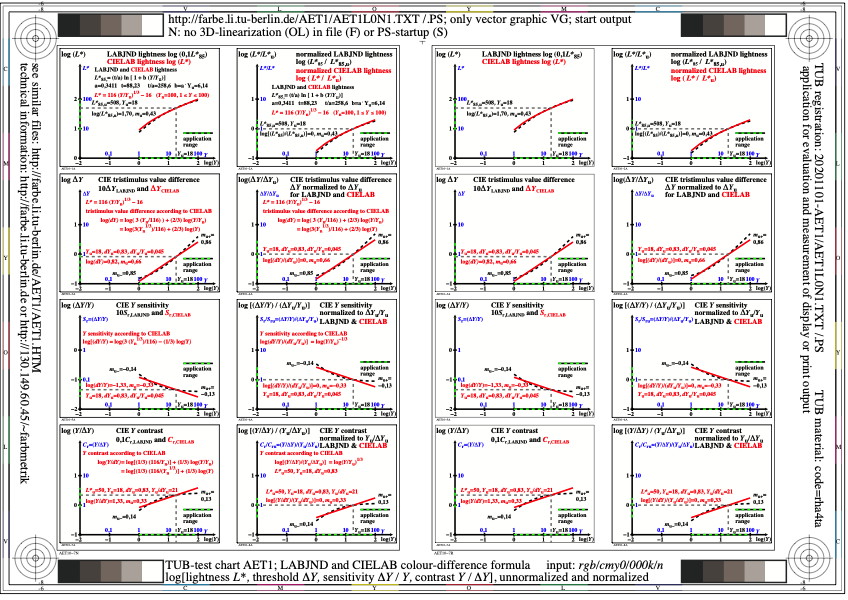
Figure AET1L0N1.jpg: Output in format A6 of the file
AET1L0NP.PDF, see
AET1L0N1.
PS /
TXT /
PDF /
jpg
AET1: TUB-Test chart AET1; Comparison of LABJND & CIEDE2000 formula
CIE lightness L*, derivation dL*/dY, and threshold dY
CIE sensitivity dY/Y and CIE contrast Y/dY
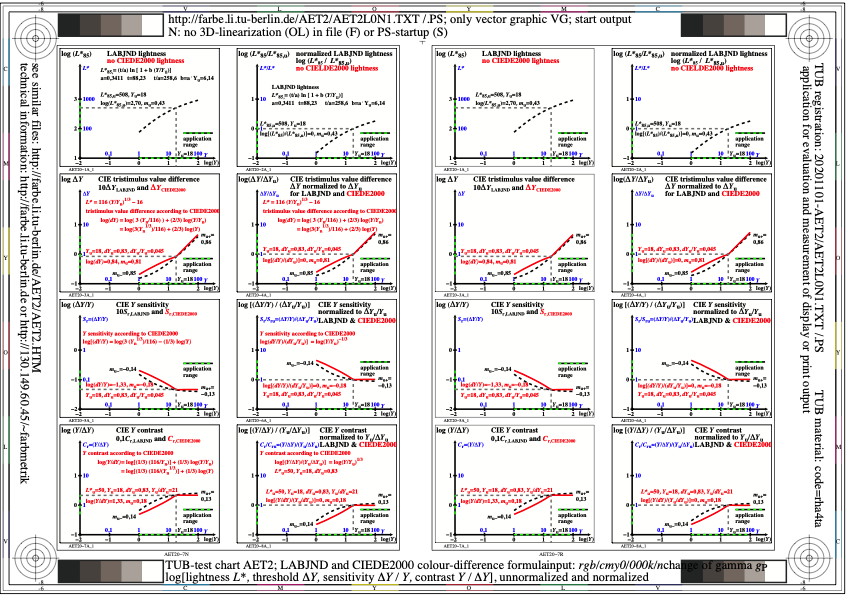
Figure AET2L0N1.jpg: Output in format A6 of the file
AET2L0NP.PDF, see
AET2L0N1.
PS /
TXT /
PDF /
jpg
AET2: TUB-Test chart AET2; Comparison of LABJND & CIELAB formula
CIE lightness L*, derivation dL*/dY, and threshold dY
CIE sensitivity dY/Y and CIE contrast Y/dY
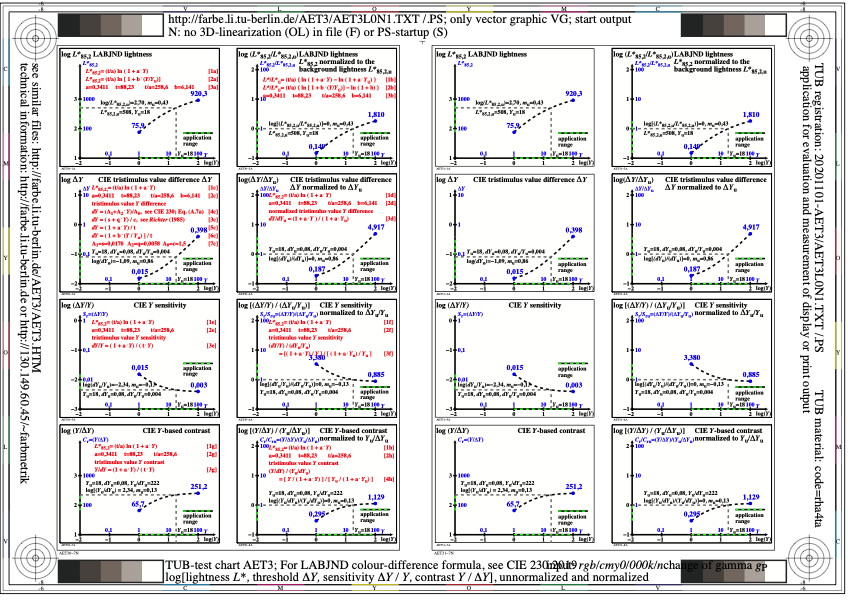
Figure AET3L0N1.jpg: Output in format A6 of the file
AET3L0NP.PDF, see
AET3L0N1.
PS /
TXT /
PDF /
jpg
AET3: TUB-Test chart AET3; LABJND colour differences, CIE 230:2019
logarithmic ordinate for LABJND lightness L*,
derivation dL*/dY, sensitivity dY/Y, and contrast Y/dY
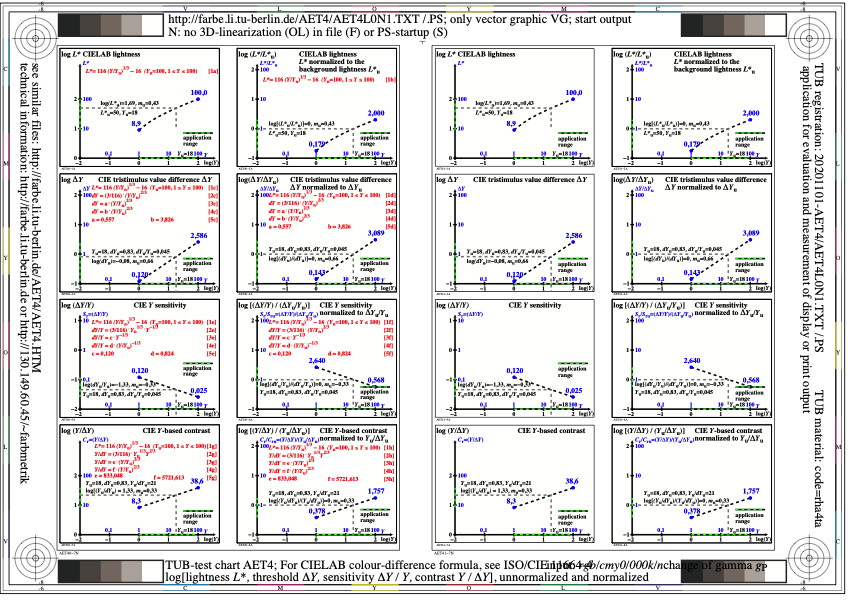
Figure AET4L0N1.jpg: Output in format A6 of the file
AET4L0NP.PDF, see
AET4L0N1.
PS /
TXT /
PDF /
jpg
AET4: TUB-Test chart AET4; CIELAB colour differences, CIE 230:2019
logarithmic ordinate for CIELAB lightness L*,
derivation dL*/dY, sensitivity dY/Y, and contrast Y/dY
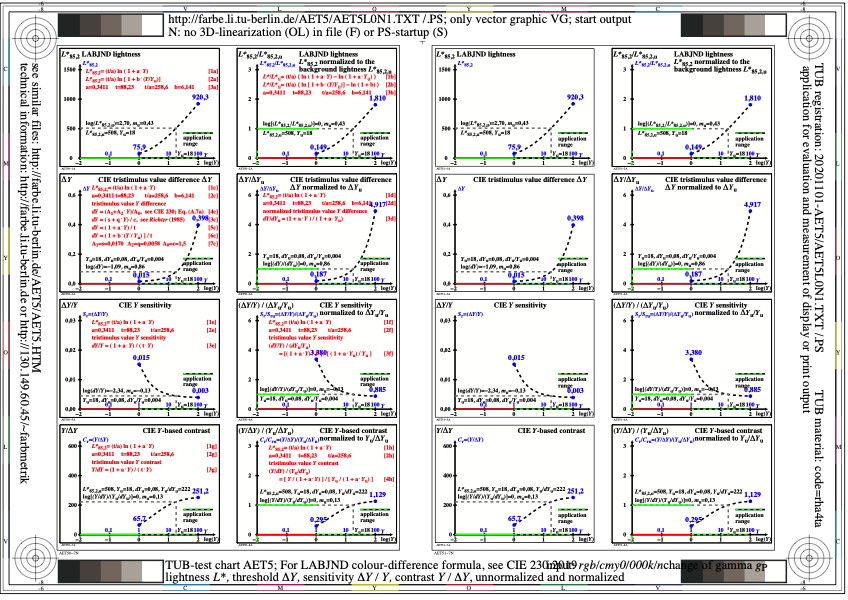
Figure AET5L0N1.jpg: Output in format A6 of the file
AET5L0NP.PDF, see
AET5L0N1.
PS /
TXT /
PDF /
jpg
AET5: TUB-Test chart AET5; LABJND colour differences, CIE 230:2019
linear ordinate for LABJND lightness L*,
derivation dL*/dY, sensitivity dY/Y, and contrast Y/dY
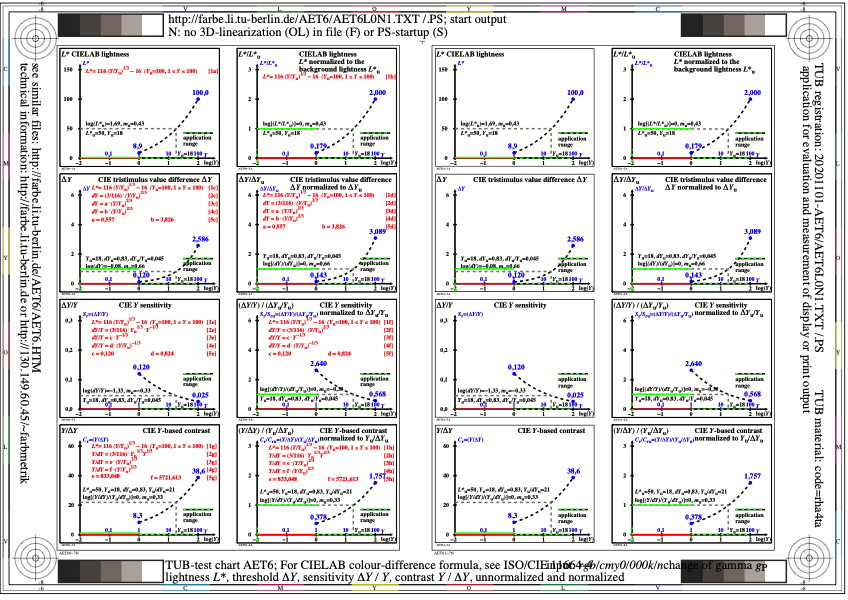
Figure AET6L0N1.jpg: Output in format A6 of the file
AET6L0NP.PDF, see
AET6L0N1.
PS /
TXT /
PDF /
jpg
AET6: TUB-Test chart AET6; CIELAB colour differences, CIE 230:2019
linear ordinate for CIELAB lightness L*,
derivation dL*/dY, sensitivity dY/Y, and contrast Y/dY
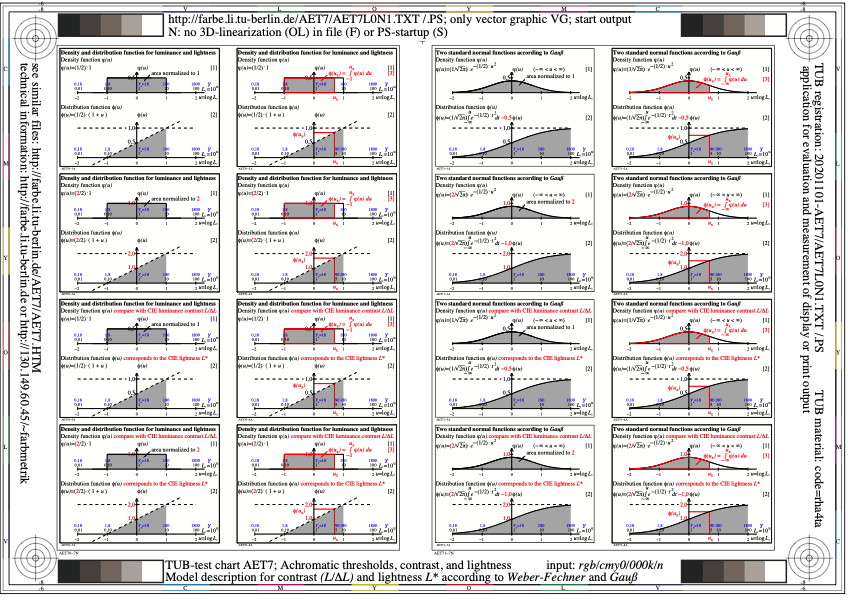
Figure AET7L0N1.jpg: Output in format A6 of the file
AET7L0NP.PDF, see
AET7L0N1.
PS /
TXT /
PDF /
jpg
AET7: TUB-Test chart AET7; Thresholds, contrast and lightness
Model description for contrast L/(delta L), and
lightness L* according to Weber-Fechner & Gauß
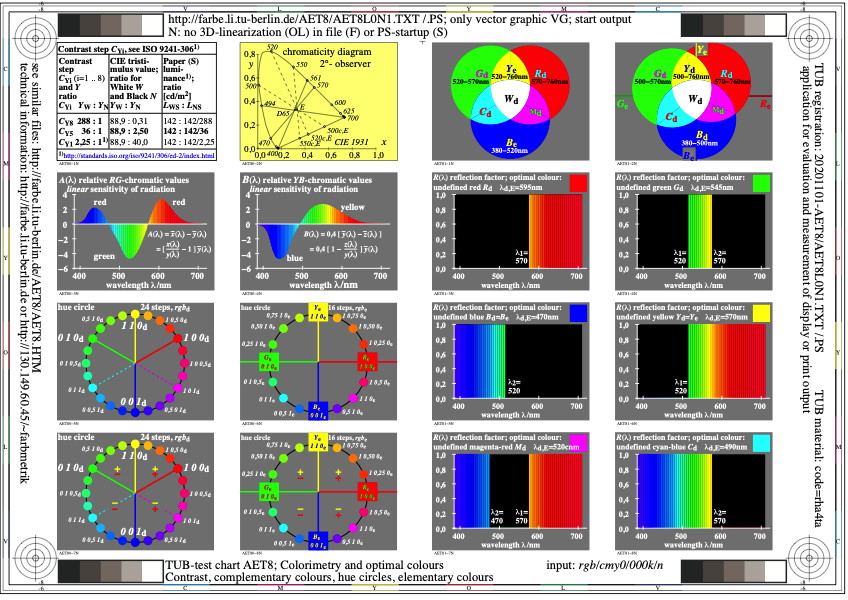
Figure AET8L0N1.jpg: Output in format A6 of the file
AET8L0NP.PDF, see
AET8L0N1.
PS /
TXT /
PDF /
jpg
AET8: TUB-Test chart AET8; Colorimetry and optimal colours
Contrast, complementary colours, hue circles
elementary colours, wavelength range
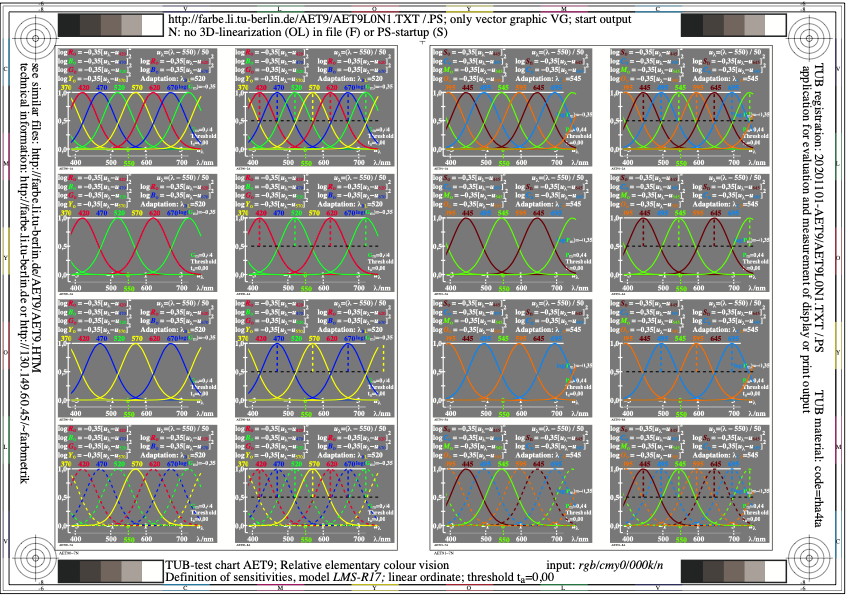
Figure AET9L0N1.jpg: Output in format A6 of the file
AET9L0NP.PDF, see
AET9L0N1.
PS /
TXT /
PDF /
jpg
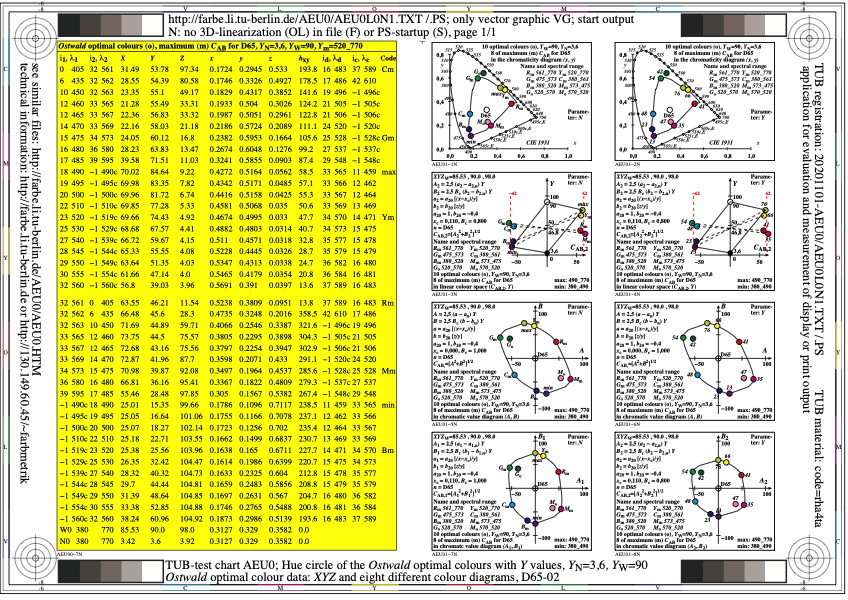
Figure AEU0L0N1.jpg: Output in format A6 of the file
AEU0L0NP.PDF, see
AEU0L0N1.
PS /
TXT /
PDF /
jpg
AEU0: TUB-test chart AEU0; Ostwald-optimal colours
YN=3,6, YW=90, CIE illuminant D65, CIE 02 degree
XYZ data of hue circle in 8 colour diagrams
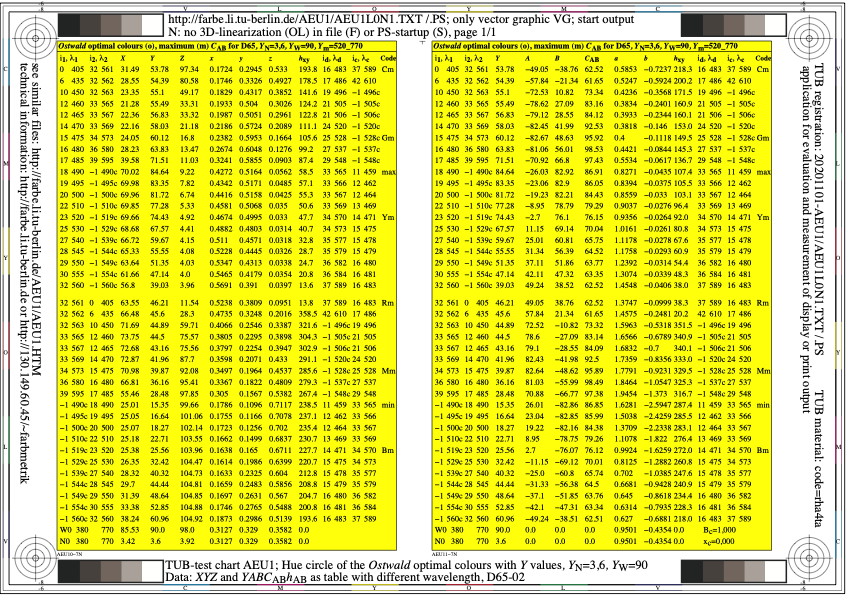
Figure AEU1L0N1.jpg: Output in format A6 of the file
AEU1L0NP.PDF, see
AEU1L0N1.
PS /
TXT /
PDF /
jpg
AEU1: TUB-test chart AEU1; Ostwald-optimal colours
YN=3,6, YW=90, CIE illuminant D65, CIE 02 degree
Data XYZ and YABCh as table with wavelength

Figure AEU2L0N1.jpg: Output in format A6 of the file
AEU2L0NP.PDF, see
AEU2L0N1.
PS /
TXT /
PDF /
jpg
AEU2: TUB-test chart AEU2; Ostwald-optimal colours
YN=3,6, YW=90, CIE illuminant D65, CIE 02 degree
Data YABCh1 and YABCh2 as table with wavelength
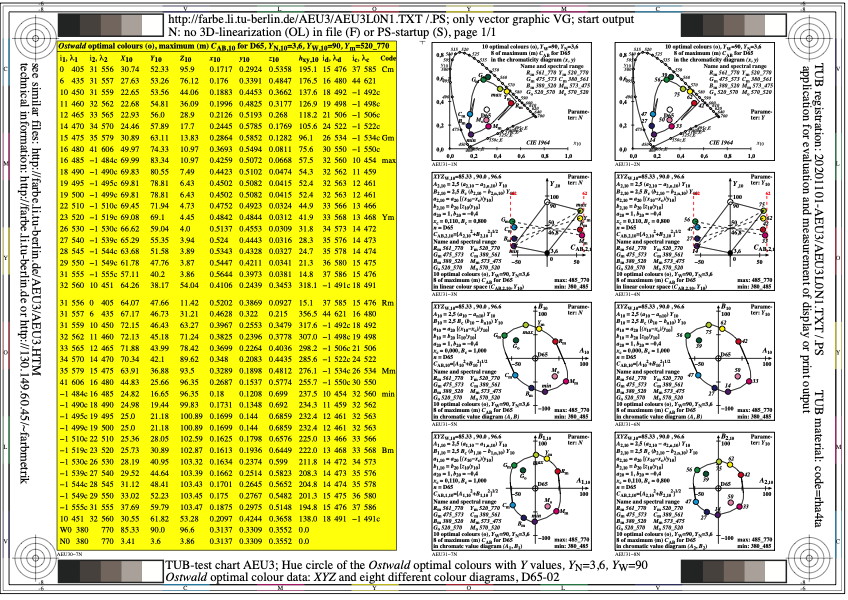
Figure AEU3L0N1.jpg: Output in format A6 of the file
AEU3L0NP.PDF, see
AEU3L0N1.
PS /
TXT /
PDF /
jpg
AEU3: TUB-test chart AEU3; Ostwald-optimal colours
YN=3,6, YW=90, CIE illuminant D65, CIE 10 degree
XYZ data of hue circle in 8 colour diagrams
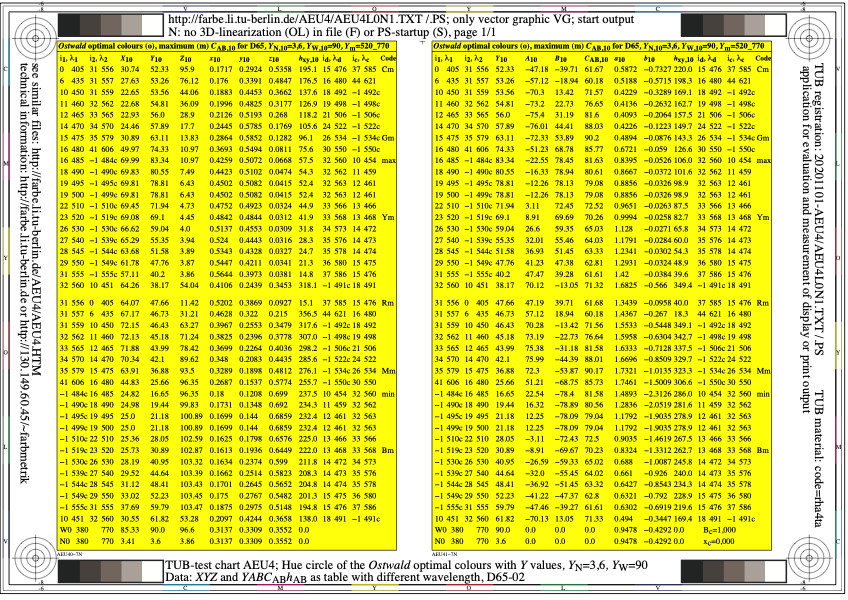
Figure AEU4L0N1.jpg: Output in format A6 of the file
AEU4L0NP.PDF, see
AEU4L0N1.
PS /
TXT /
PDF /
jpg
AEU4: TUB-test chart AEU4; Ostwald-optimal colours
YN=3,6, YW=90, CIE illuminant D65, CIE 10 degree
Data XYZ and YABCh as table with wavelength

Figure AEU5L0N1.jpg: Output in format A6 of the file
AEU5L0NP.PDF, see
AEU5L0N1.
PS /
TXT /
PDF /
jpg
AEU5: TUB-test chart AEU5;Ostwald-optimal colours
YN=3,6, YW=90, CIE illuminant D65, CIE 10 degree
Data YABCh1 and YABCh2 as table with wavelength
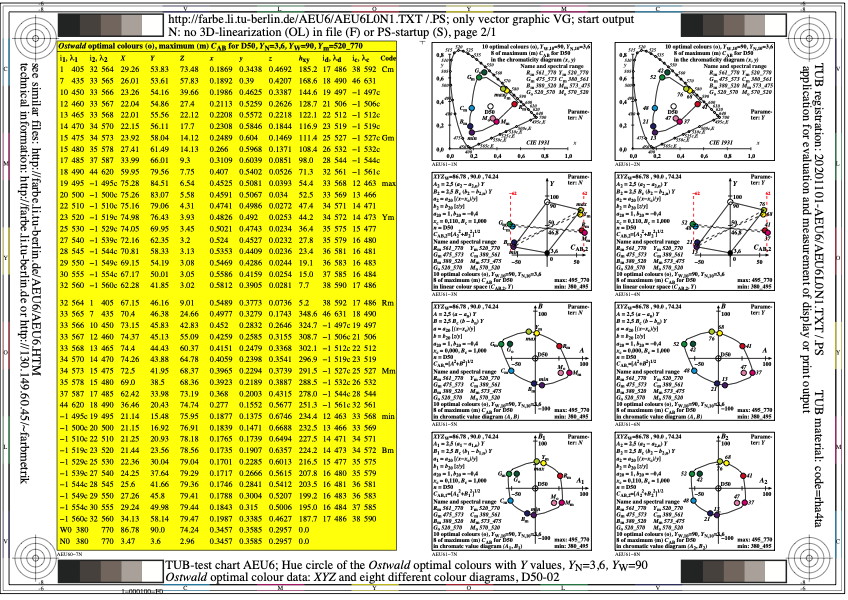
Figure AEU6L0N1.jpg: Output in format A6 of the file
AEU6L0NP.PDF, see
AEU6L0N1.
PS /
TXT /
PDF /
jpg
AEU6: TUB-test chart AEU6; Ostwald-optimal colours
YN=3,6, YW=90, CIE illuminant D50, CIE 02 degree
XYZ data of hue circle in 8 colour diagrams

Figure AEU7L0N1.jpg: Output in format A6 of the file
AEU7L0NP.PDF, see
AEU7L0N1.
PS /
TXT /
PDF /
jpg
AEU7: TUB-test chart AEU7; Ostwald-optimal colours
YN=3,6, YW=90, CIE illuminant D50, CIE 02 degree
Data XYZ and YABCh as table with wavelength
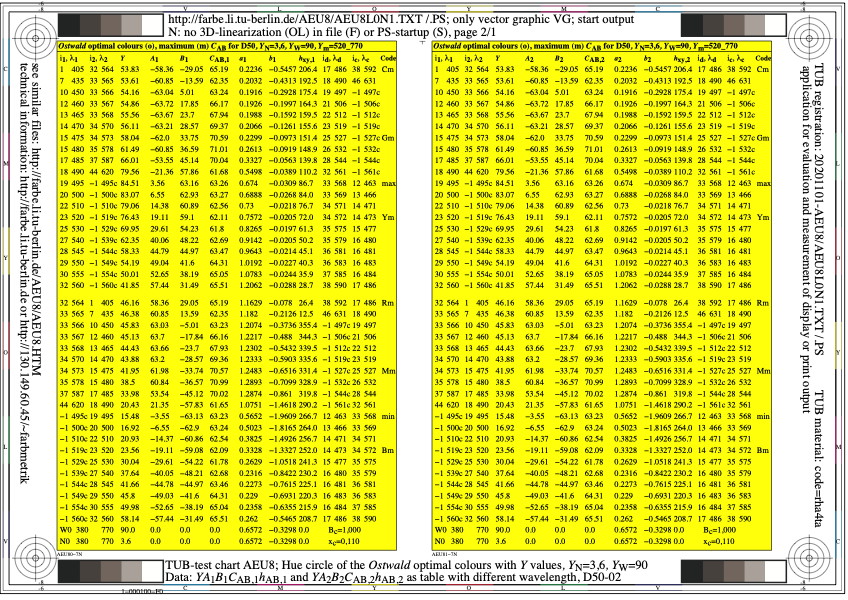
Figure AEU8L0N1.jpg: Output in format A6 of the file
AEU8L0NP.PDF, see
AEU8L0N1.
PS /
TXT /
PDF /
jpg
AEU8: TUB-test chart AEU8; Ostwald-optimal colours
YN=3,6, YW=90, CIE illuminant D50, CIE 02 degree
Data YABCh1 and YABCh2 as table with wavelength
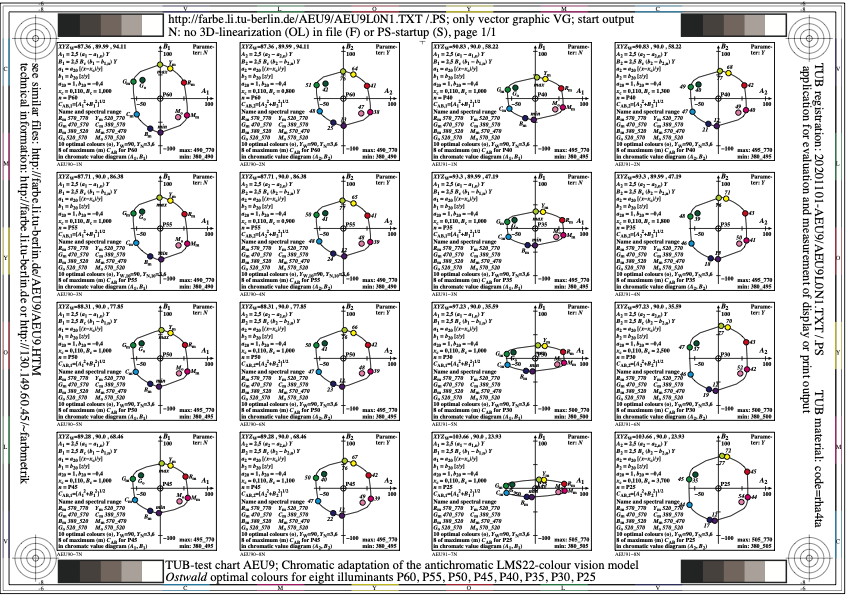
Figure AEU9L0N1.jpg: Output in format A6 of the file
AEU9L0NP.PDF, see
AEU9L0N1.
PS /
TXT /
PDF /
jpg
AEU9: TUB-test chart AEU9; Chromatic adaptation of LMS22 model
Ostwald-optimal colours for 8 illuminants:
P60 (6000K), P55, P50, P45, P40, P35, P30, P25 (2500K)

Figure AEV0L0N1.jpg: Output in format A6 of the file
AEV0L0NP.PDF, see
AEV0L0N1.
PS /
TXT /
PDF /
jpg
AEV0: TUB-test chart AEV0; Ostwald-optimal colours
YN=3,6, YW=90, 8 illuminants Dxx, CIE 02 degree
XYZ data of hue circle in 8 colour diagrams

Figure AEV1L0N1.jpg: Output in format A6 of the file
AEV1L0NP.PDF, see
AEV1L0N1.
PS /
TXT /
PDF /
jpg
AEV1: TUB-test chart AEV1; Ostwald-optimal colours
YN=3,6, YW=90, 8 illuminants Dxx, CIE 02 degree
Data XYZ and YABCh as table with wavelength
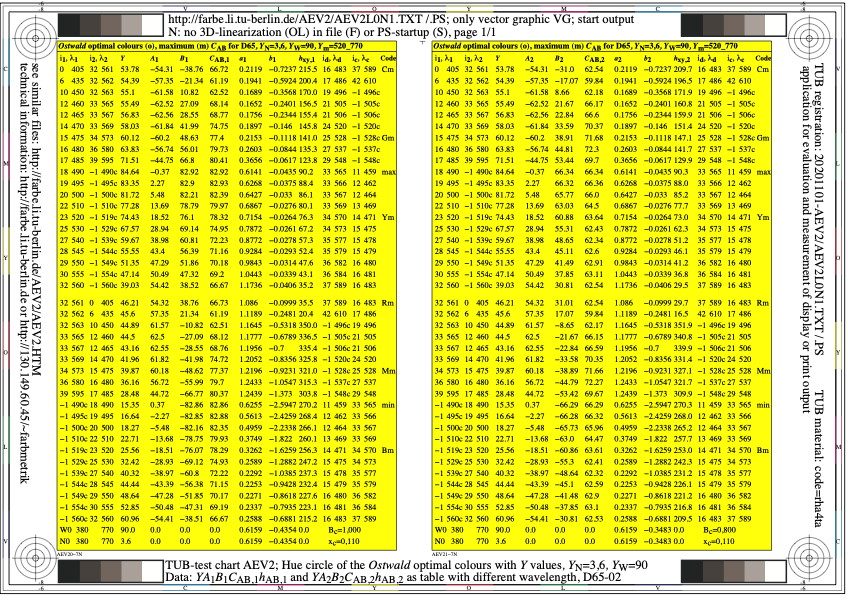
Figure AEV2L0N1.jpg: Output in format A6 of the file
AEV2L0NP.PDF, see
AEV2L0N1.
PS /
TXT /
PDF /
jpg
AEV2: TUB-test chart AEV2; Ostwald-optimal colours
YN=3,6, YW=90, 8 illuminants Dxx, CIE 02 degree
Data YABCh1 and YABCh2 as table with wavelength

Figure AEV3L0N1.jpg: Output in format A6 of the file
AEV3L0NP.PDF, see
AEV3L0N1.
PS /
TXT /
PDF /
jpg
AEV3: TUB-test chart AEV3; Ostwald-optimal colours
YN=3,6, YW=90, 8 illuminants Dxx, CIE 10 degree
XYZ data of hue circle in 8 colour diagrams

Figure AEV4L0N1.jpg: Output in format A6 of the file
AEV4L0NP.PDF, see
AEV4L0N1.
PS /
TXT /
PDF /
jpg
AEV4: TUB-test chart AEV4; Ostwald-optimal colours
YN=3,6, YW=90, 8 illuminants Dxx, CIE 10 degree
Data XYZ and YABCh as table with wavelength
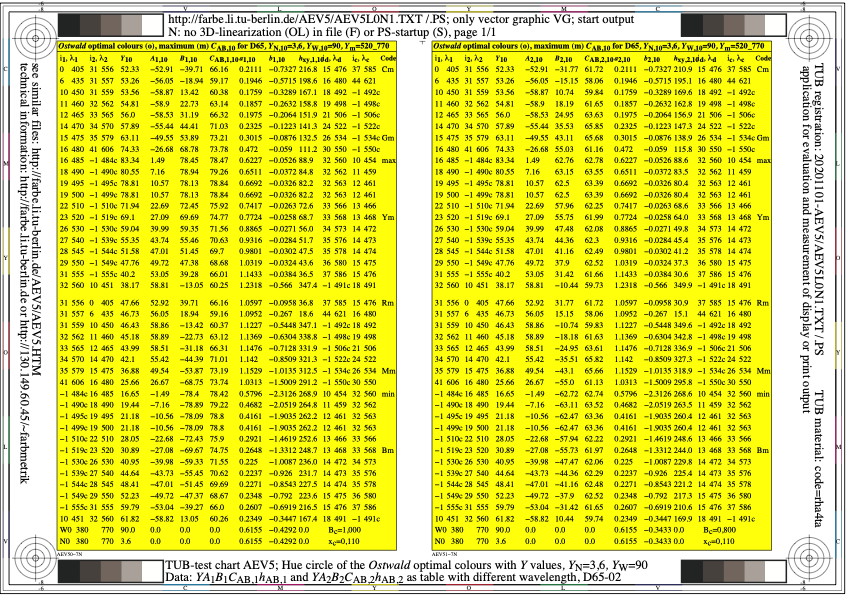
Figure AEV5L0N1.jpg: Output in format A6 of the file
AEV5L0NP.PDF, see
AEV5L0N1.
PS /
TXT /
PDF /
jpg
AEV5: TUB-test chart AEV5;Ostwald-optimal colours
YN=3,6, YW=90, 8 illuminants Dxx, CIE 10 degree
Data YABCh1 and YABCh2 as table with wavelength

Figure AEV6L0N1.jpg: Output in format A6 of the file
AEV6L0NP.PDF, see
AEV6L0N1.
PS /
TXT /
PDF /
jpg
AEV6: TUB-test chart AEV6; Ostwald-optimal colours
YN=3,6, YW=90, 8 illuminants Pxx, CIE 02 degree
XYZ data of hue circle in 8 colour diagrams
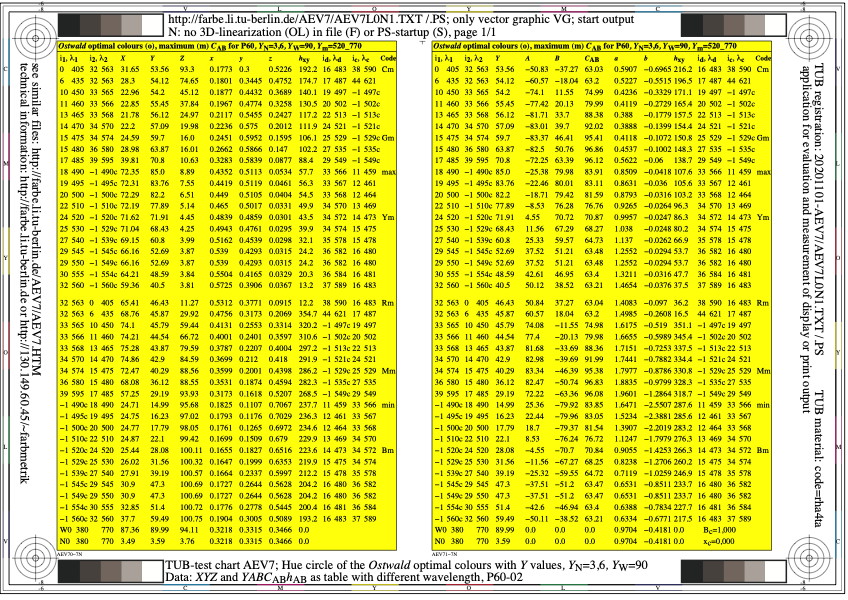
Figure AEV7L0N1.jpg: Output in format A6 of the file
AEV7L0NP.PDF, see
AEV7L0N1.
PS /
TXT /
PDF /
jpg
AEV7: TUB-test chart AEV7; Ostwald-optimal colours
YN=3,6, YW=90, 8 illuminants Pxx, CIE 02 degree
Data XYZ and YABCh as table with wavelength
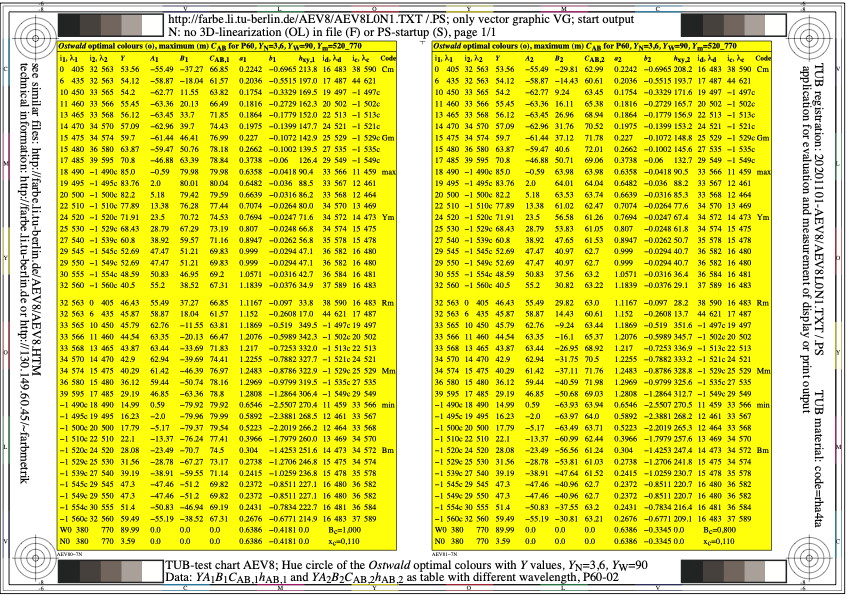
Figure AEV8L0N1.jpg: Output in format A6 of the file
AEV8L0NP.PDF, see
AEV8L0N1.
PS /
TXT /
PDF /
jpg
AEV8: TUB-test chart AEV8; Ostwald-optimal colours
YN=3,6, YW=90, 8 illuminants Pxx, CIE 02 degree
Data YABCh1 and YABCh2 as table with wavelength
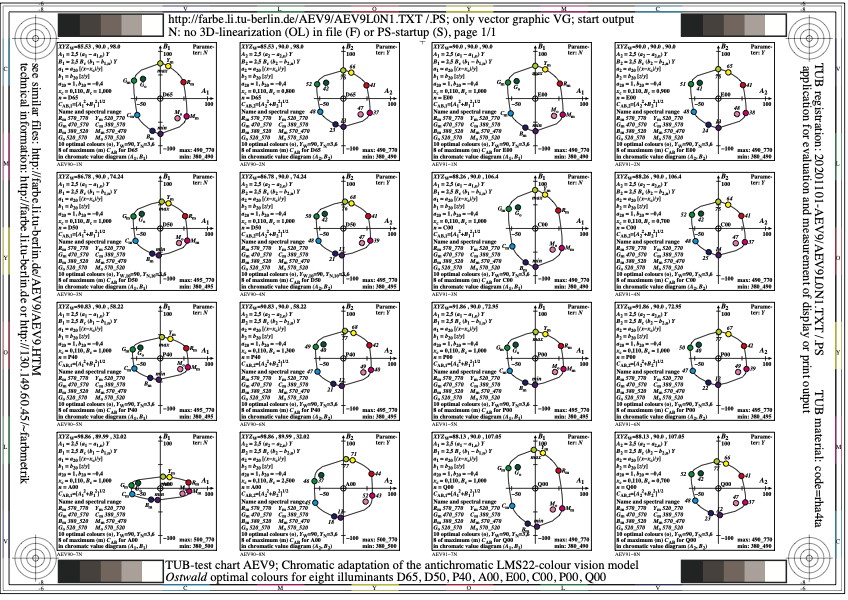
Figure AEV9L0N1.jpg: Output in format A6 of the file
AEV9L0NP.PDF, see
AEV9L0N1.
PS /
TXT /
PDF /
jpg
AEV9: TUB-test chart AEV9; Chromatic adaptation of LMS22 model
Ostwald-optimal colours for 8 illuminants:
D65 (6500K), D50, P40 (4000K), A00, E00, C00, P00, Q00
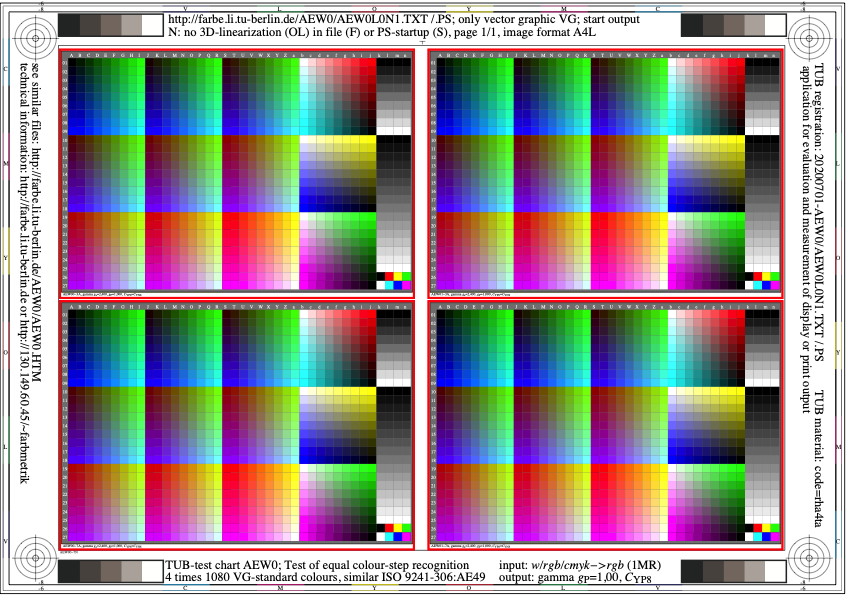
Figure AEW0L0N1.jpg: Output in format A6 of the file
AEW0L0NP.PDF, see
AEW0L0N1.
PS /
TXT /
PDF /
jpg
AEW0: TUB-test chart AEW0; Test of equal colour-step recognition
4 times 1080 VG-standard colours, similar ISO 9241-306:AE49
Gamma ga=2,40, Gamma gP=1,00, ISO-contrast step CYP8
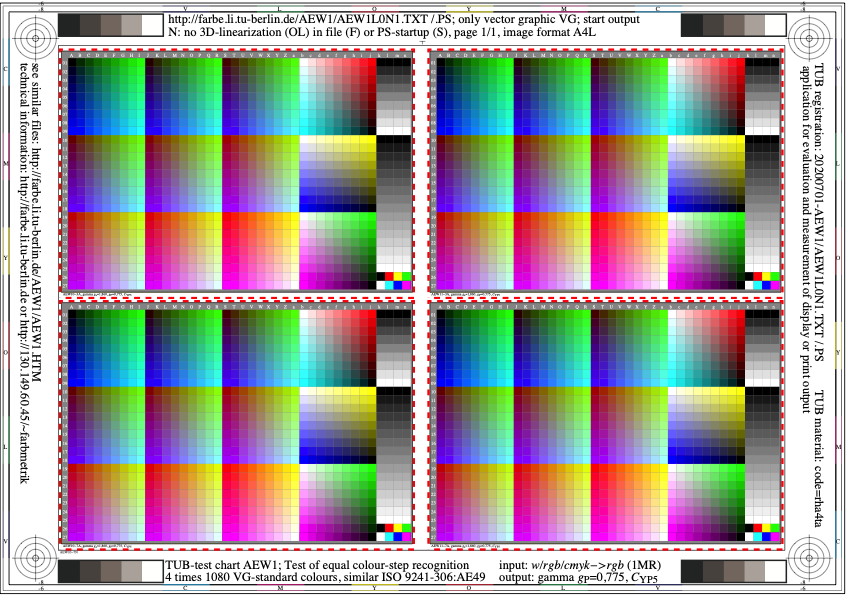
Figure AEW1L0N1.jpg: Output in format A6 of the file
AEW1L0NP.PDF, see
AEW1L0N1.
PS /
TXT /
PDF /
jpg
AEW1: TUB-test chart AEW1; Test of equal colour-step recognition
4 times 1080 VG-standard colours, similar ISO 9241-306:AE49
Gamma ga=1,86, Gamma gP=0,775, ISO-contrast step CYP5
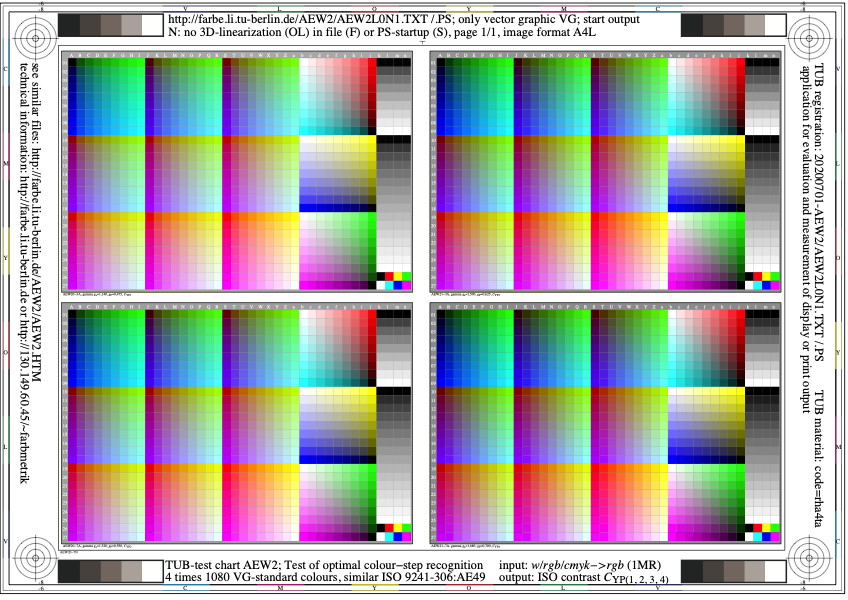
Figure AEW2L0N1.jpg: Output in format A6 of the file
AEW2L0NP.PDF, see
AEW2L0N1.
PS /
TXT /
PDF /
jpg
AEW2: TUB-test chart AEW2; Test of optimal colour-step recognition
4 times 1080 VG-standard colours, similar ISO 9241-306:AE49
relative gamma 0,475<=gP<=0,700, ISO-contrast steps CYP1 to CYP4
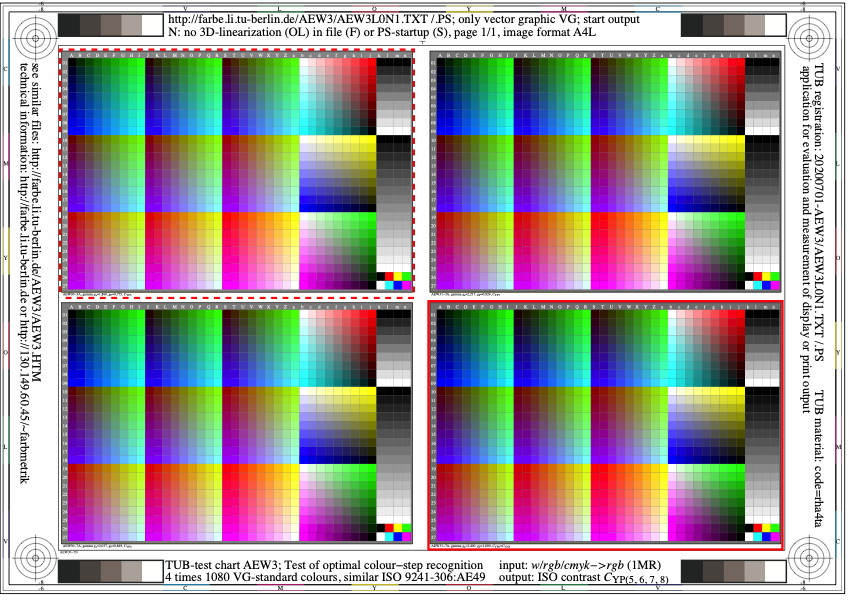
Figure AEW3L0N1.jpg: Output in format A6 of the file
AEW3L0NP.PDF, see
AEW3L0N1.
PS /
TXT /
PDF /
jpg
AEW3: TUB-test chart AEW3; Test of optimal colour-step recognition
4 times 1080 VG-standard colours, similar ISO 9241-306:AE49
relative gamma 0,775<=gP<=1,000, ISO-contrast steps CYP5 to CYP8
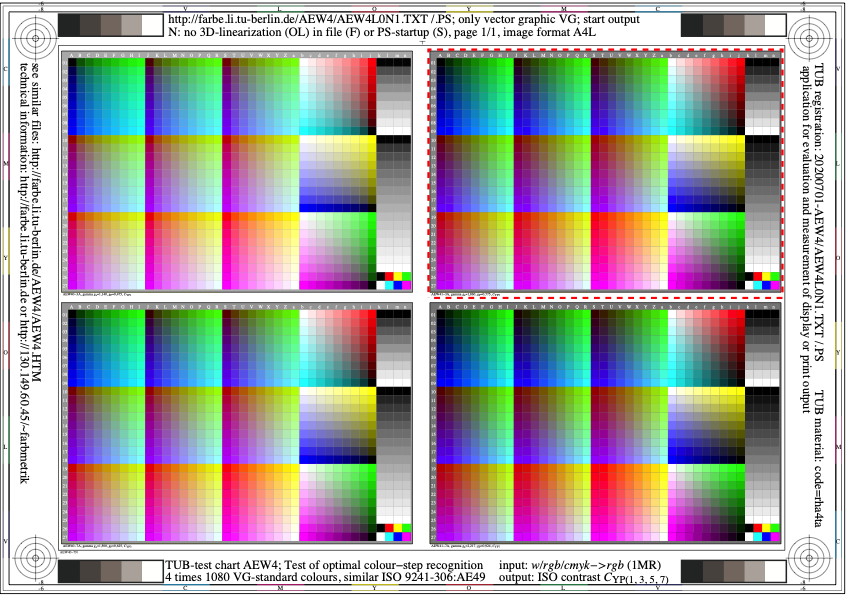
Figure AEW4L0N1.jpg: Output in format A6 of the file
AEW4L0NP.PDF, see
AEW4L0N1.
PS /
TXT /
PDF /
jpg
AEW4: TUB-test chart AEW4; Test of optimal colour-step recognition
4 times 1080 VG-standard colours, similar ISO 9241-306:AE49
relative gamma 0,475<=gP<=0,924, contrast steps CYP(1, 3, 5, 7)
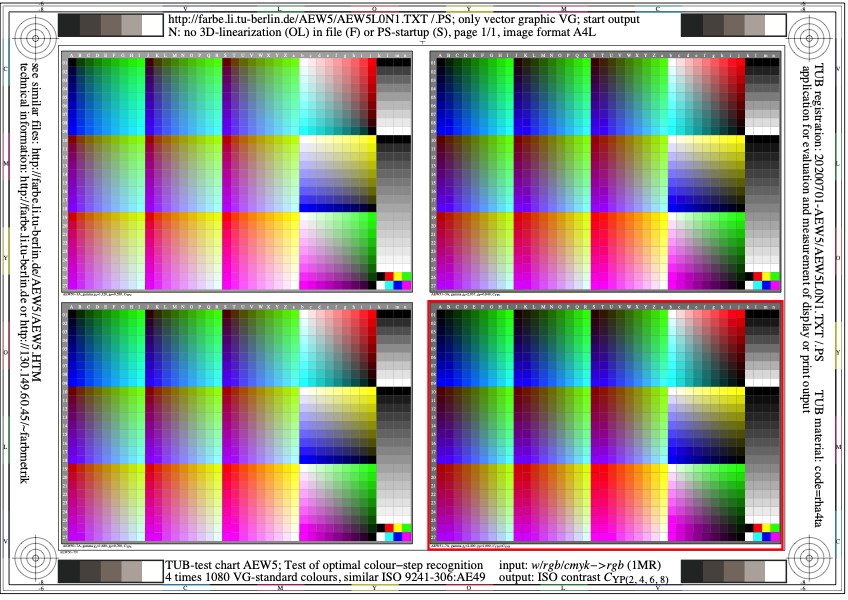
Figure AEW5L0N1.jpg: Output in format A6 of the file
AEW5L0NP.PDF, see
AEW5L0N1.
PS /
TXT /
PDF /
jpg
AEW5: TUB-test chart AEW5; Test of optimal colour-step recognition
4 times 1080 VG-standard colours, similar ISO 9241-306:AE49
relative gamma 0,550<=gP<=1,000, contrast steps CYP(2, 4, 6, 8)
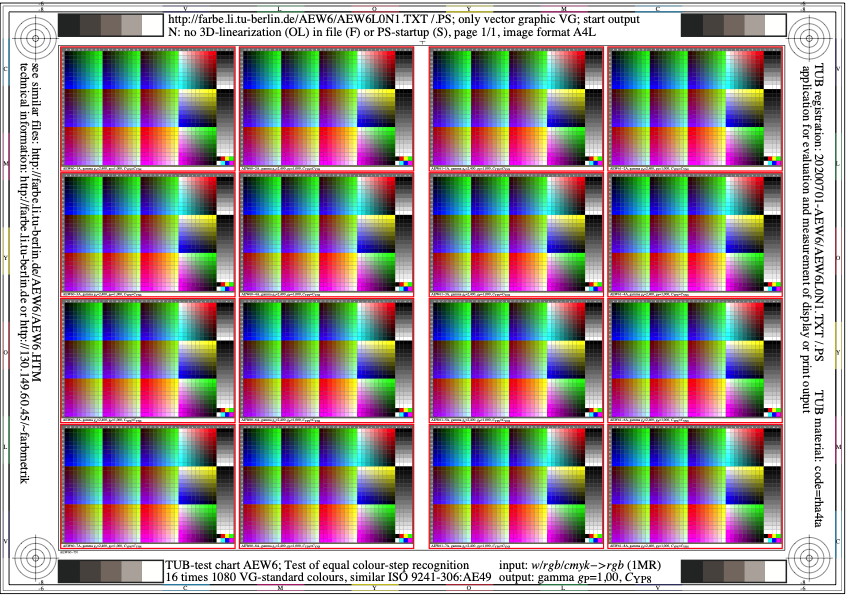
Figure AEW6L0N1.jpg: Output in format A6 of the file
AEW6L0NP.PDF, see
AEW6L0N1.
PS /
TXT /
PDF /
jpg
AEW6: TUB-test chart AEW6; Test of equal colour-step recognition
16 times 1080 VG-standard colours, similar ISO 9241-306:AE49
Gamma ga=2,40, Gamma gP=1,00, ISO-contrast step CYP8
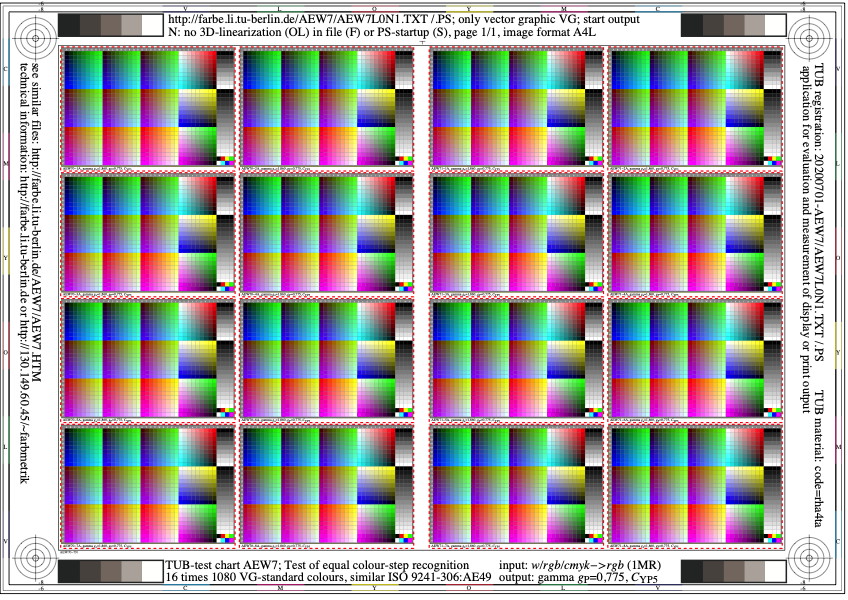
Figure AEW7L0N1.jpg: Output in format A6 of the file
AEW7L0NP.PDF, see
AEW7L0N1.
PS /
TXT /
PDF /
jpg
AEW7: TUB-test chart AEW7; Test of equal colour-step recognition
16 times 1080 VG-standard colours, similar ISO 9241-306:AE49
Gamma ga=1,86, Gamma gP=0,775, ISO-contrast step CYP5
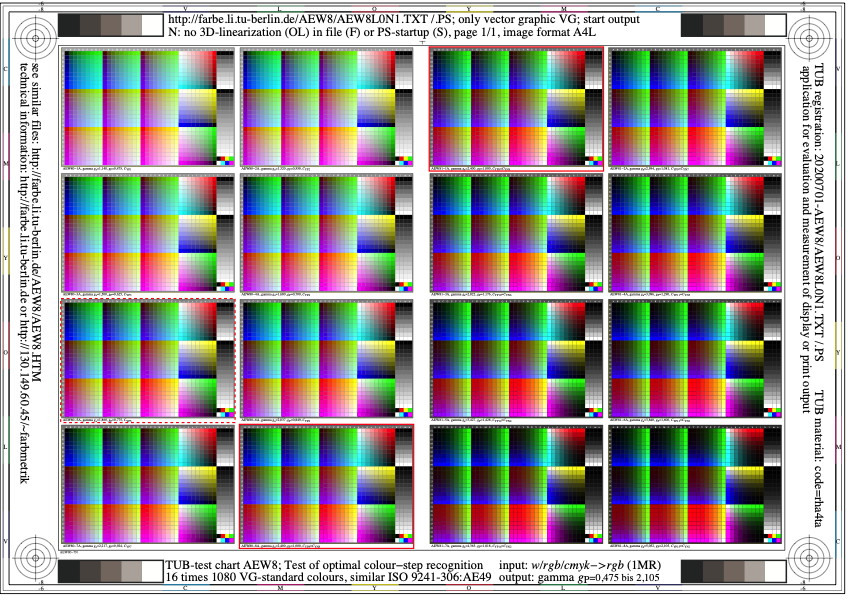
Figure AEW8L0N1.jpg: Output in format A6 of the file
AEW8L0NP.PDF, see
AEW8L0N1.
PS /
TXT /
PDF /
jpg
AEW8: TUB-test chart AEW8; Test of optimal colour-step recognition
16 times 1080 VG-standard colours, similar ISO 9241-306:AE49
relative gamma 0,475<=gP<=2,11, ISO-contrast steps CYP1 to CYP15
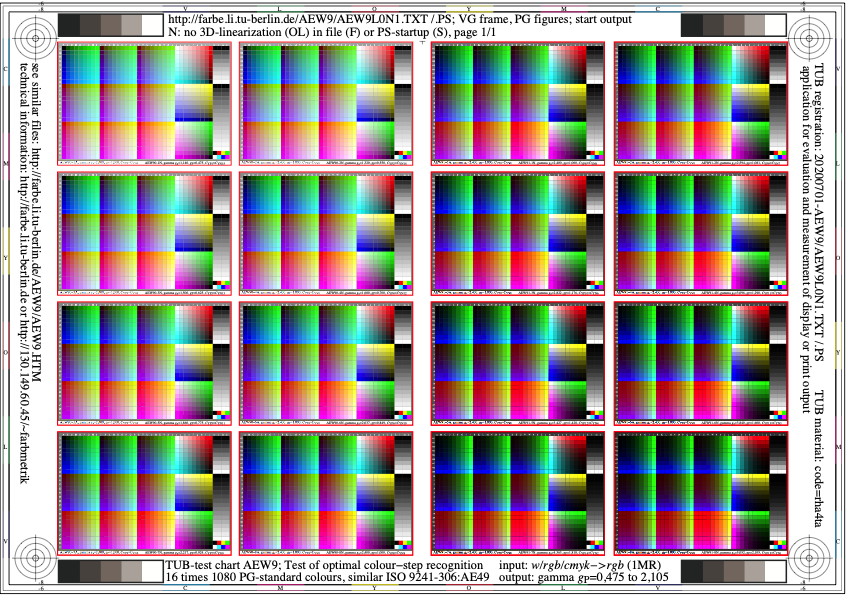
Figure AEW9L0N1.jpg: Output in format A6 of the file
AEW9L0NP.PDF, see
AEW9L0N1.
PS /
TXT /
PDF /
jpg
AEW9: TUB-test chart AEW9; Test of optimal colour-step recognition
16 times 1080 PG-standard colours, similar ISO 9241-306:AE49
relative gamma 0,475<=gP<=2,11, ISO-contrast steps CYP1 to CYP15
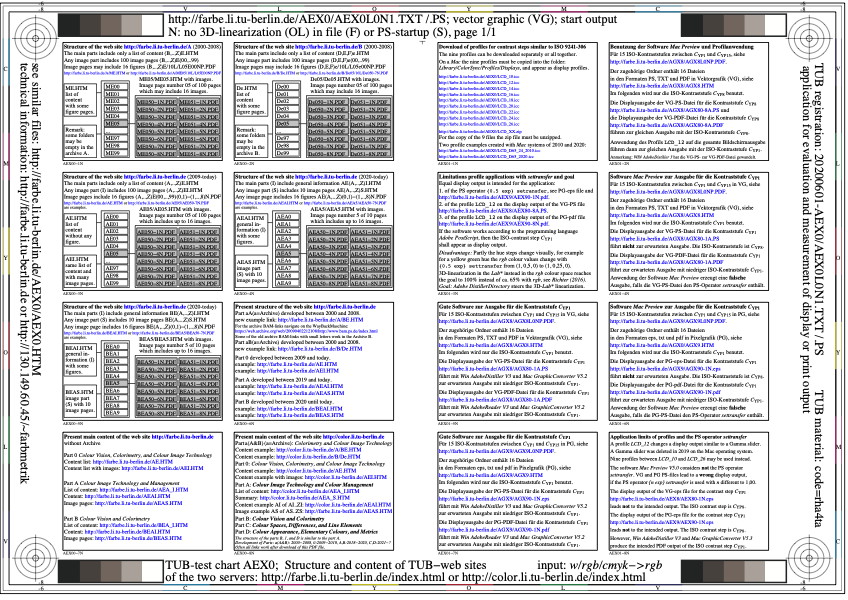
Figure AEX0L0N1.jpg: Output in format A6 of the file
AEX0L0NP.PDF, see
AEX0L0N1.
PS /
TXT /
PDF /
jpg
AEX0: TUB-test chart AEX0; Structure and content
of many web-site parts of this TUB-web servers
Limits of settransfer profiles, 3D-Lab*-linearization
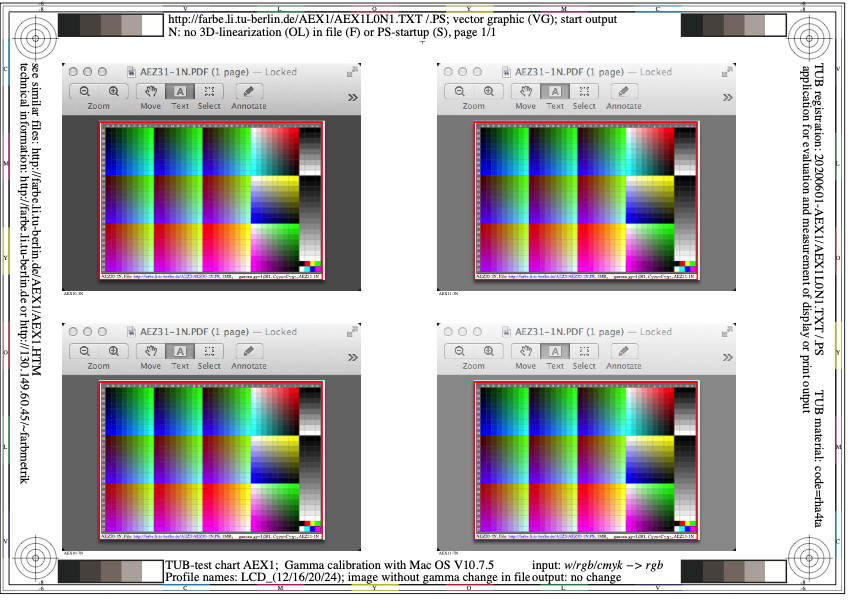
Figure AEX1L0N1.jpg: Output in format A6 of the file
AEX1L0NP.PDF, see
AEX1L0N1.
PS /
TXT /
PDF /
jpg
AEX1: TUB-test chart AEX1; Gamma calibration with 1080 colours
of the computer operating system Mac OS version 10.7.5
without Gamma change of the display-image file
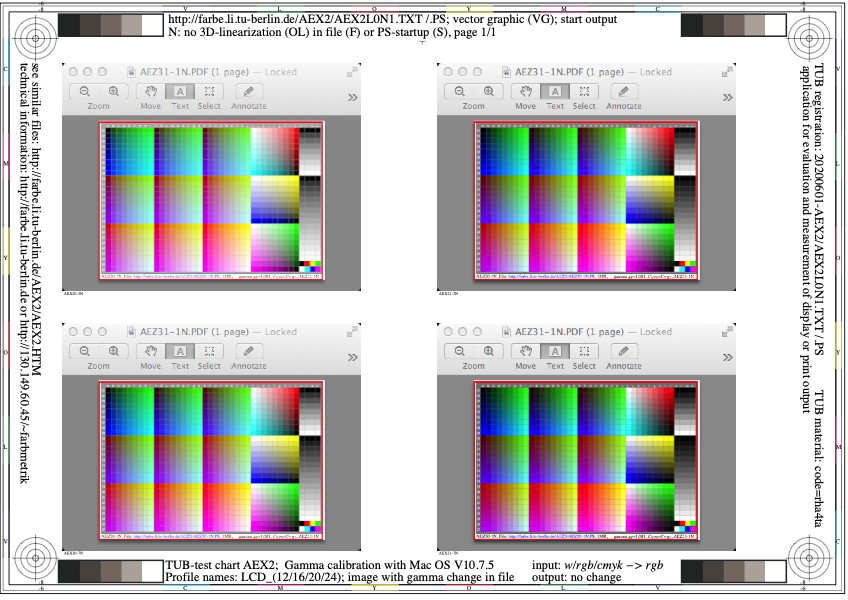
Figure AEX2L0N1.jpg: Output in format A6 of the file
AEX2L0NP.PDF, see
AEX2L0N1.
PS /
TXT /
PDF /
jpg
AEX2: TUB-test chart AEX2; Gamma calibration with 1080 colours
of the computer operating system Mac OS version 10.7.5
with additional Gamma change of the display-image file
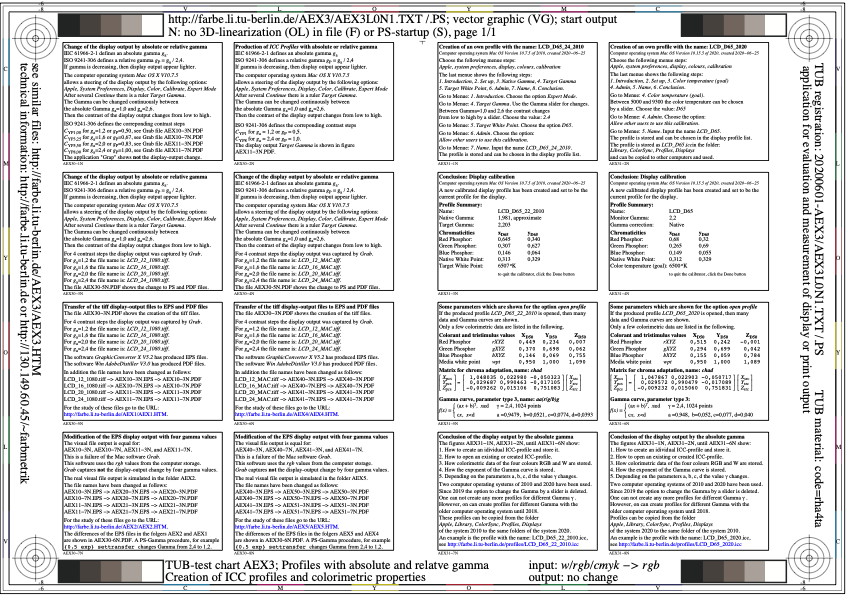
Figure AEX3L0N1.jpg: Output in format A6 of the file
AEX3L0NP.PDF, see
AEX3L0N1.
PS /
TXT /
PDF /
jpg
AEX3: TUB-test chart AEX3; Description of Gamma changes
on pages AEX1 and AEX2 with 1080 colour image
on pages AEX4 and AEX5 with Mac image
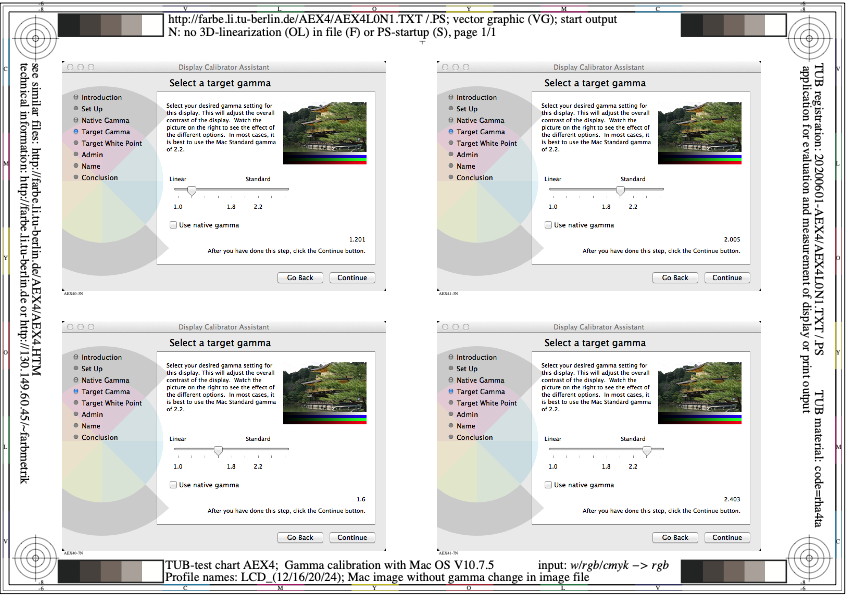
Figure AEX4L0N1.jpg: Output in format A6 of the file
AEX4L0NP.PDF, see
AEX4L0N1.
PS /
TXT /
PDF /
jpg
AEX4: TUB-test chart AEX4; Gamma calibration with Mac image
of the computer operating system Mac OS version 10.7.5
without Gamma change of the display-image file
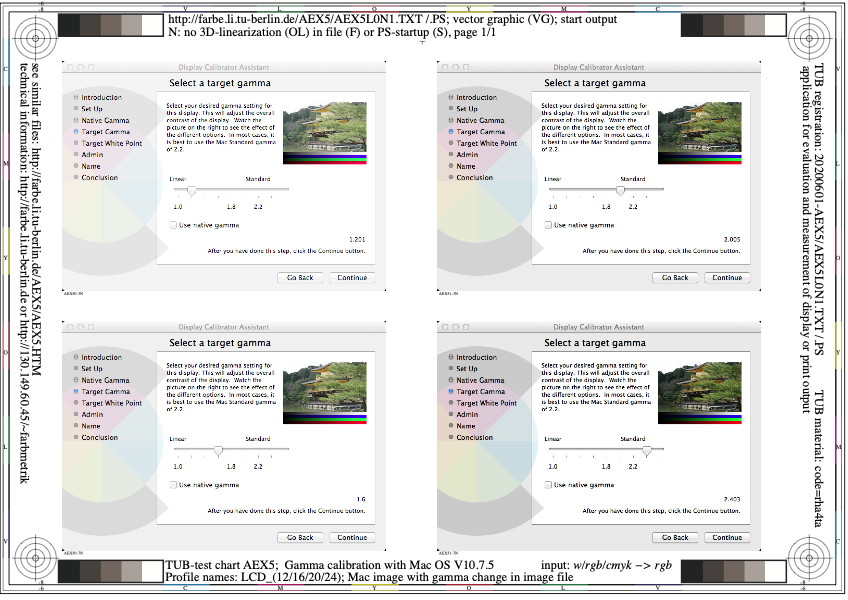
Figure AEX5L0N1.jpg: Output in format A6 of the file
AEX5L0NP.PDF, see
AEX5L0N1.
PS /
TXT /
PDF /
jpg
AEX5: TUB-test chart AEX5; Gamma calibration with Mac image
of the computer operating system Mac OS version 10.7.5
with additional Gamma change of the display-image file

Figure AEX6L0N1.jpg: Output in format A6 of the file
AEX6L0NP.PDF, see
AEX6L0N1.
PS /
TXT /
PDF /
jpg
AEX6: TUB-test chart AEX6; Test of equal colour-step recognition
16 times 1080 VG-standard colours, similar ISO 9241-306:AE49
Gamma ga=2,40, Gamma gP=1,00, ISO-contrast step CYP8
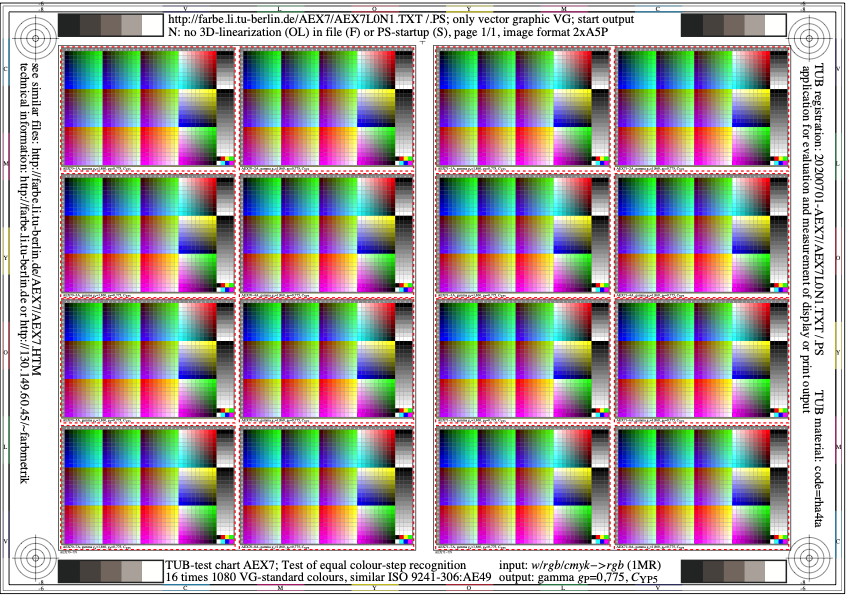
Figure AEX7L0N1.jpg: Output in format A6 of the file
AEX7L0NP.PDF, see
AEX7L0N1.
PS /
TXT /
PDF /
jpg
AEX7: TUB-test chart AEX7; Test of equal colour-step recognition
16 times 1080 VG-standard colours, similar ISO 9241-306:AE49
Gamma ga=1,86, Gamma gP=0,775, ISO-contrast step CYP5
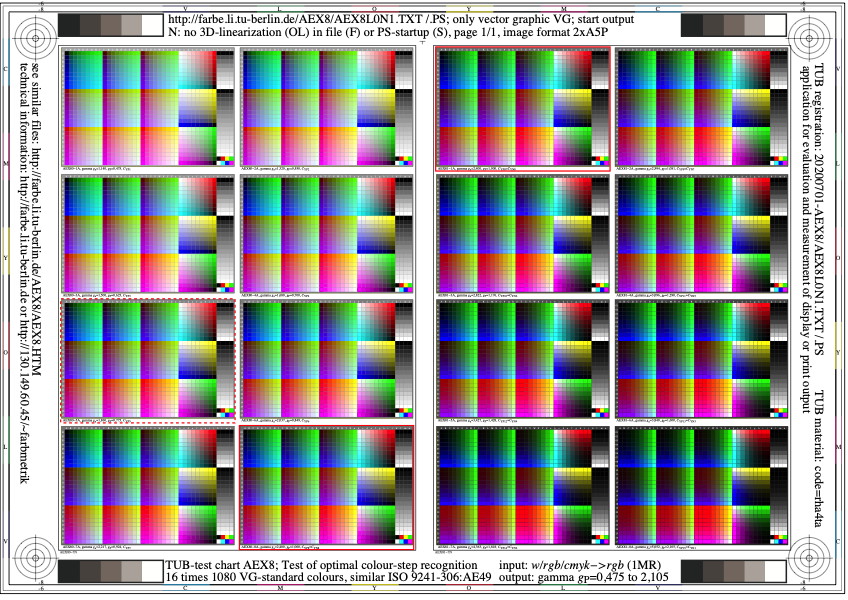
Figure AEX8L0N1.jpg: Output in format A6 of the file
AEX8L0NP.PDF, see
AEX8L0N1.
PS /
TXT /
PDF /
jpg
AEX8: TUB-test chart AEX8; Test of optimal colour-step recognition
16 times 1080 VG-standard colours, similar ISO 9241-306:AE49
relative gamma 0,475<=gP<=2,11, ISO-contrast steps CYP1 to CYP15
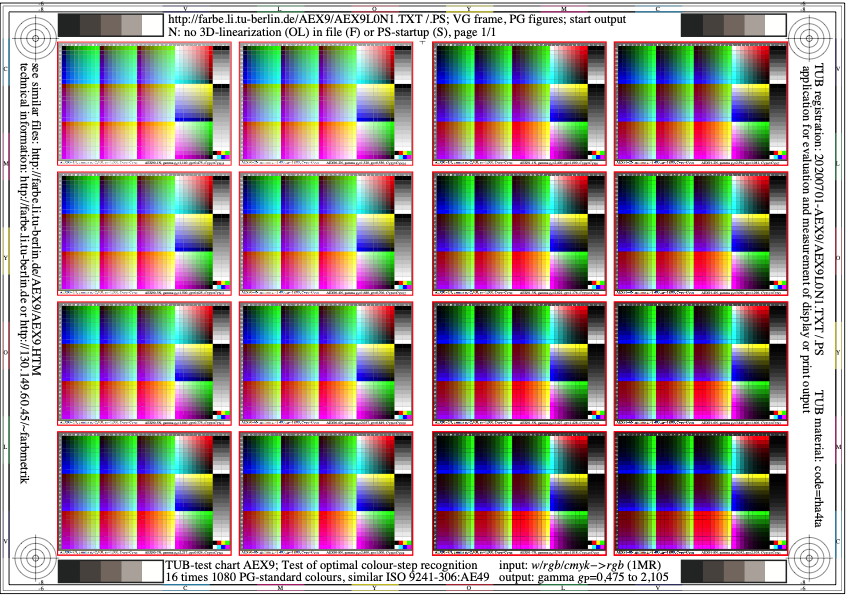
Figure AEX9L0N1.jpg: Output in format A6 of the file
AEX9L0NP.PDF, see
AEX9L0N1.
PS /
TXT /
PDF /
jpg
AEX9: TUB-test chart AEX9; Test of optimal colour-step recognition
16 times 1080 PG-standard colours, similar ISO 9241-306:AE49
relative gamma 0,475<=gP<=2,11, ISO-contrast steps CYP1 to CYP15

Figure AEY0L0N1.jpg: Output in format A6 of the file
AEY0L0NP.PDF, see
AEY0L0N1.
PS /
TXT /
PDF /
jpg
AEY0: TUB-test chart AEY0; VG-frame and VG-figure files
hand coded PS files of frame and 16 figures
names of VG-PDF-figure files at 16 standard positions
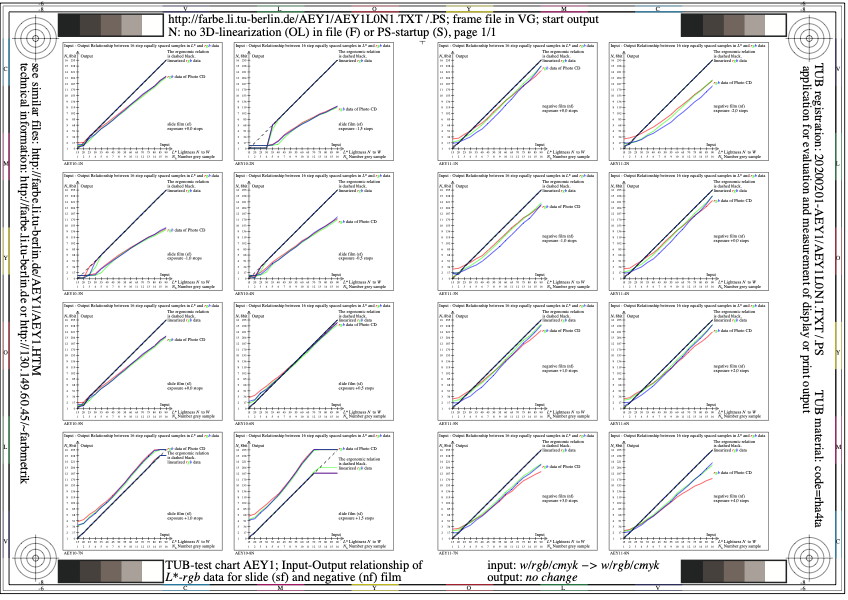
Figure AEY1L0N1.jpg: Output in format A6 of the file
AEY1L0NP.PDF, see
AEY1L0N1.
PS /
TXT /
PDF /
jpg
AEY1: TUB-test chart AEY1; Input-output relationship
between CIE lightness L* and 8bit data rgb for slidefilm (sf)
and negative film (nf) from under to over exposure
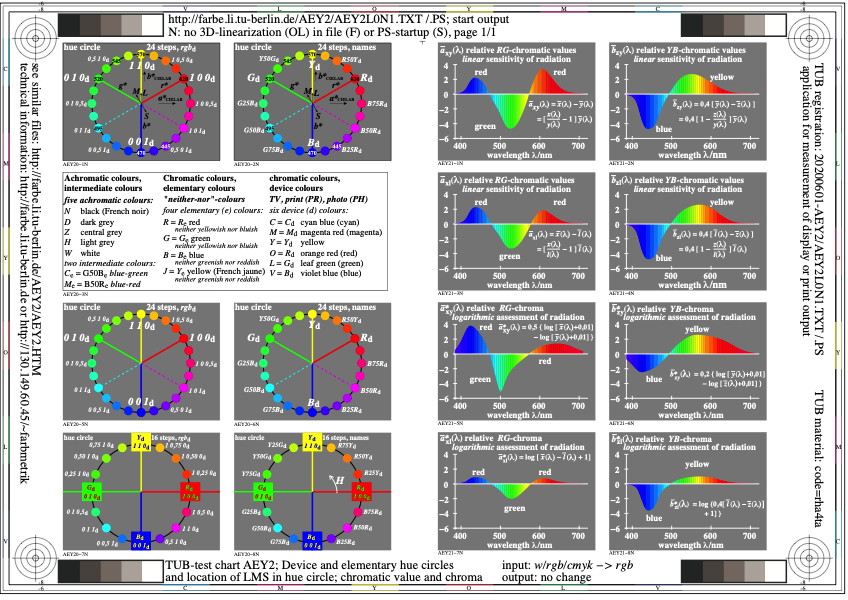
Figure AEY2L0N1.jpg: Output in format A6 of the file
AEY2L0NP.PDF, see
AEY2L0N1.
PS /
TXT /
PDF /
jpg
AEY2: TUB-test chart AEY2; Device and elementary hue circles
location of maximum LMS sensitivities in hue circles
chromatic value and chroma as function of wavelength
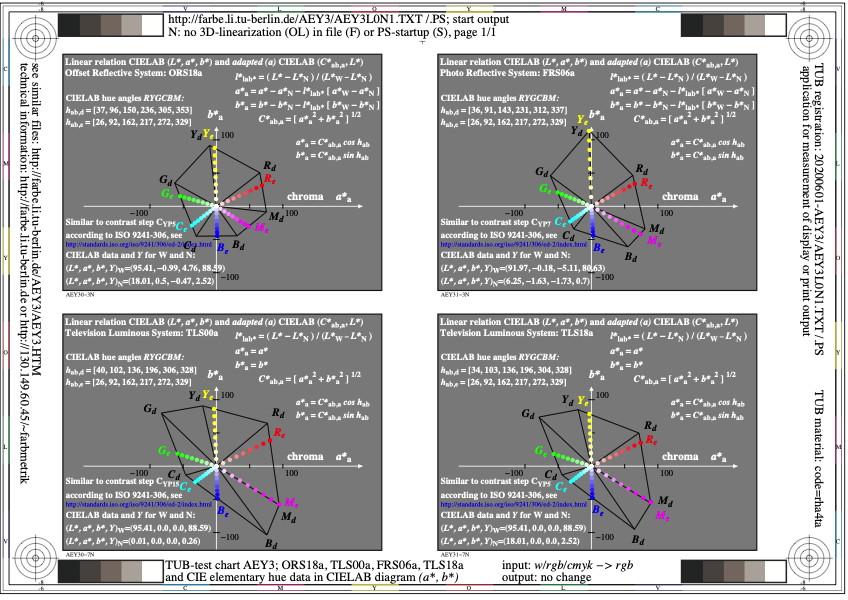
Figure AEY3L0N1.jpg: Output in format A6 of the file
AEY3L0NP.PDF, see
AEY3L0N1.
PS /
TXT /
PDF /
jpg
AEY3: TUB-test chart AEY3; Chroma of device systems
ORS18a, TLS00a, FRS06a, and standard TLS18a
and elementary hue data in CIELAB diagram (a*, b*)
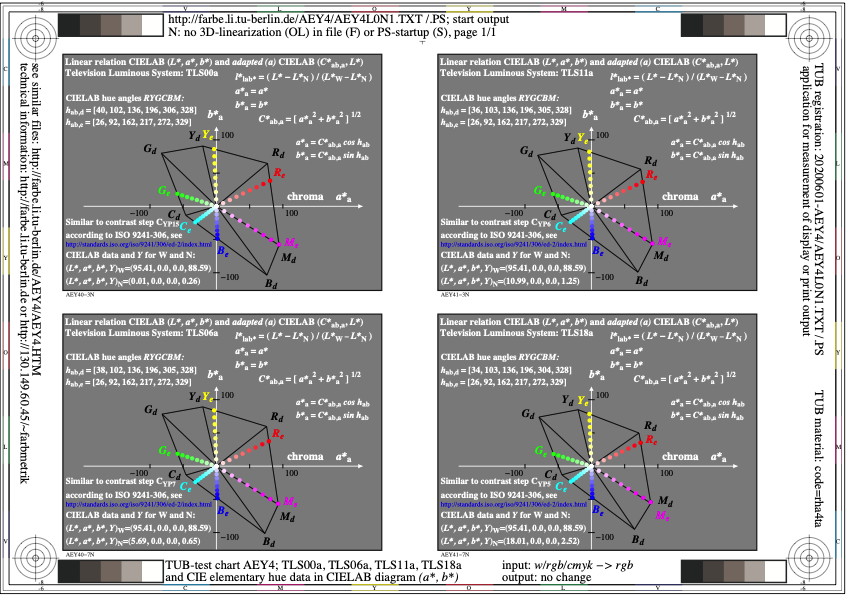
Figure AEY4L0N1.jpg: Output in format A6 of the file
AEY4L0NP.PDF, see
AEY4L0N1.
PS /
TXT /
PDF /
jpg
AEY4: TUB-test chart AEY4; Chroma of device systems
TLS00a, TLS06a, TLS11a, and standard TLS18a
and elementary hue data in CIELAB diagram (a*, b*)
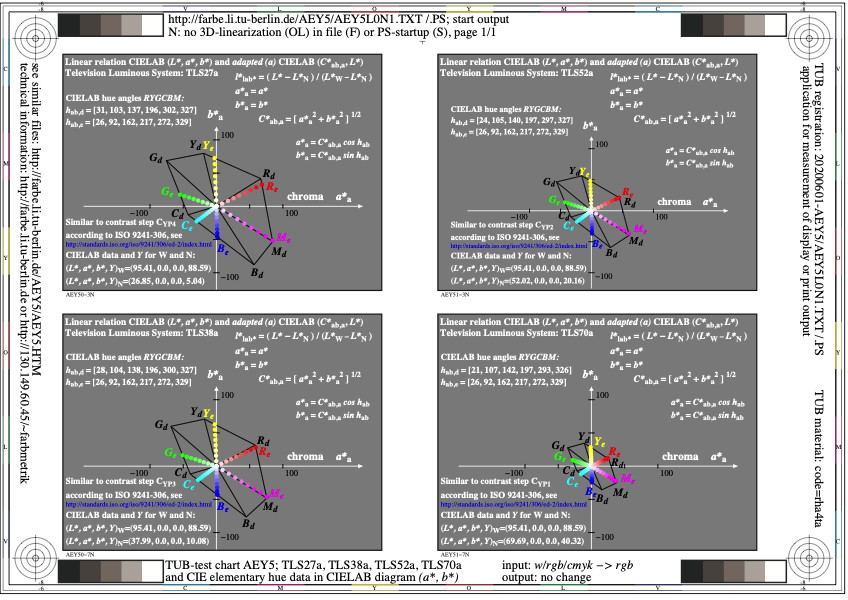
Figure AEY5L0N1.jpg: Output in format A6 of the file
AEY5L0NP.PDF, see
AEY5L0N1.
PS /
TXT /
PDF /
jpg
AEY5: TUB-test chart AEY5; Chroma of device systems
TLS27a, TLS38a, TLS52a, and projector system TLS70a
and elementary hue data in CIELAB diagram (a*, b*)

Figure AEY6L0N1.jpg: Output in format A6 of the file
AEY6L0NP.PDF, see
AEY6L0N1.
PS /
TXT /
PDF /
jpg
AEY6: TUB-test chart AEY6; Eight standard device systems
ORS18a, TLS00a, FRS06a, TLS18a, NLS00a, NLS18a, SRS18a, TLS70a
with CIELAB and rgb data on the pages 3 to 12
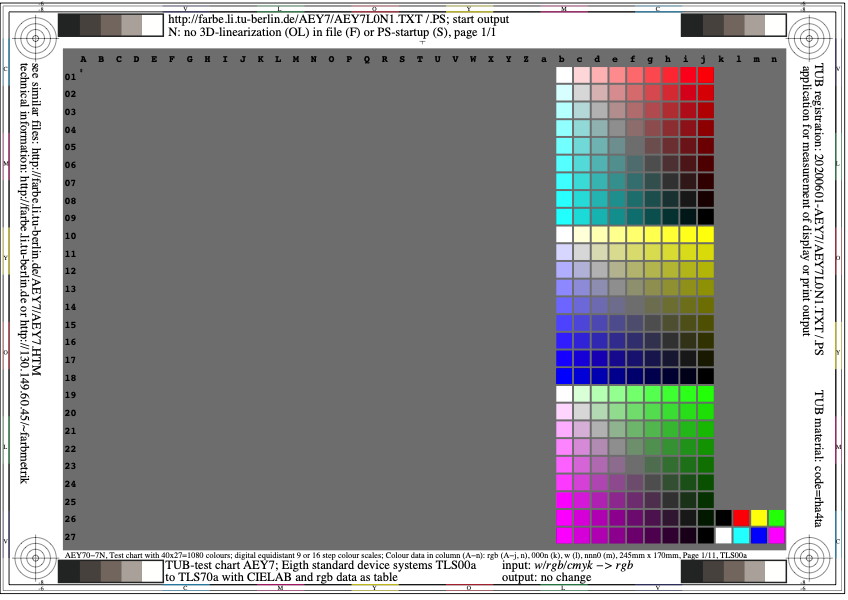
Figure AEY7L0N1.jpg: Output in format A6 of the file
AEY7L0NP.PDF, see
AEY7L0N1.
PS /
TXT /
PDF /
jpg
AEY7: TUB-test chart AEY7; Eight standard device systems
TLS00a, TLS06a, TLS11a, TLS18a, TLS27a, TLS52a, TLS70a
with CIELAB and rgb data on the pages 3 to 12

Figure AEY8L0N1.jpg: Output in format A6 of the file
AEY8L0NP.PDF, see
AEY8L0N1.
PS /
TXT /
PDF /
jpg
AEY8: TUB-test chart AEY8; Eight standard device systems
OLS00a, OLS06a, OLS11a, OLS18a, OLS27a, OLS52a, OLS70a
with CIELAB and rgb data on the pages 3 to 12
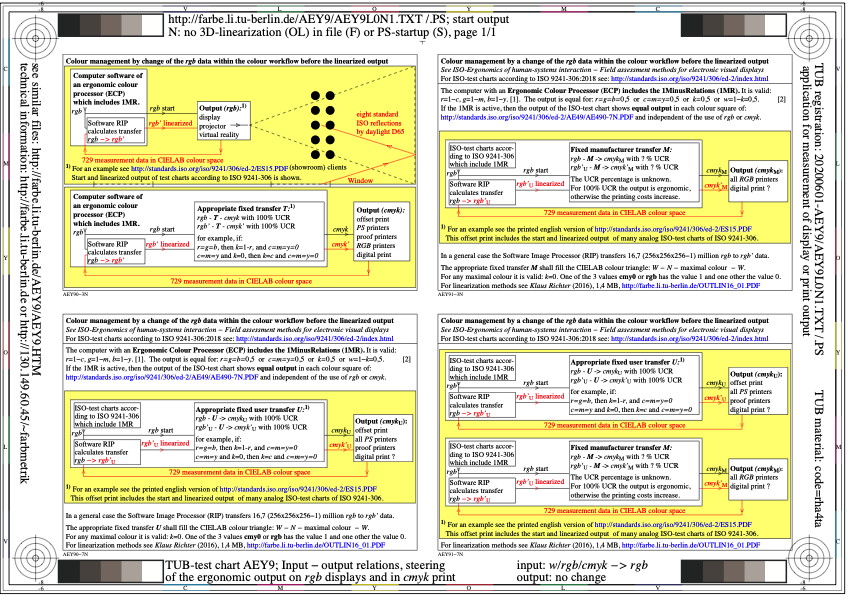
Figure AEY9L0N1.jpg: Output in format A6 of the file
AEY9L0NP.PDF, see
AEY9L0N1.
PS /
TXT /
PDF /
jpg
AEY9: TUB-test chart AEY9; Input-output relations
User steering of the ergonomic output
on rgb displays and by the cmyk print with rgb data
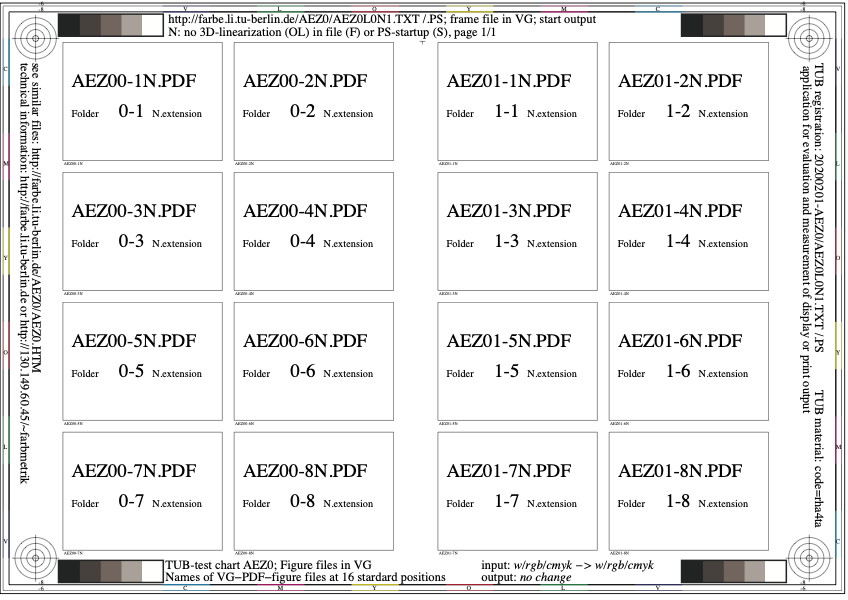
Figure AEZ0L0N1.jpg: Output in format A6 of the file
AEZ0L0NP.PDF, see
AEZ0L0N1.
PS /
TXT /
PDF /
jpg
AEZ0: TUB-test chart AEZ0; VG-frame and VG-figure files
hand coded PS files of frame and 16 figures
names of VG-PDF-figure files at 16 standard positions
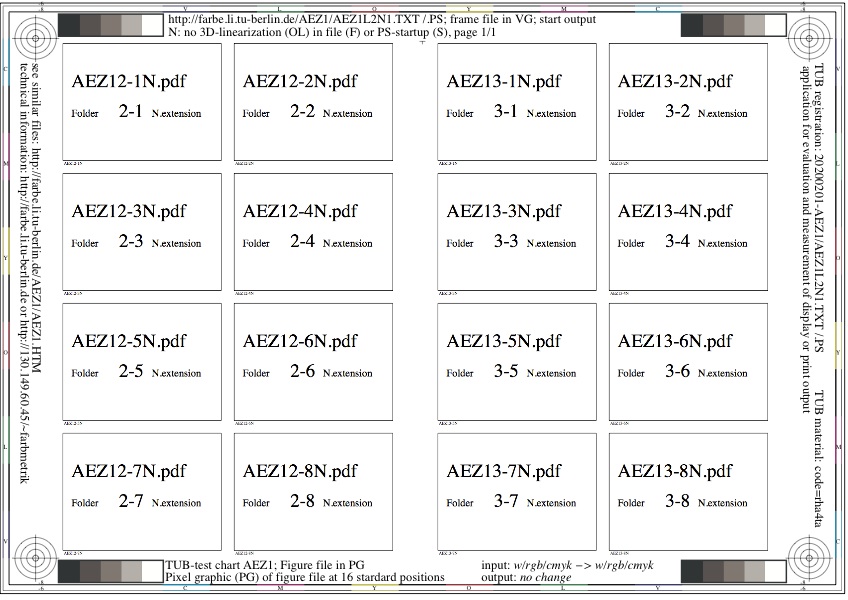
Figure AEZ1L0N1.jpg: Output in format A6 of the file
AEZ1L0NP.PDF, see
AEZ1L0N1.
PS /
TXT /
PDF /
jpg
AEZ1: TUB-test chart AEZ1; VG-frame and PG-figure files
hand coded PS files of frame and 16 figures
names of VG-PDF-figure files at 16 standard positions
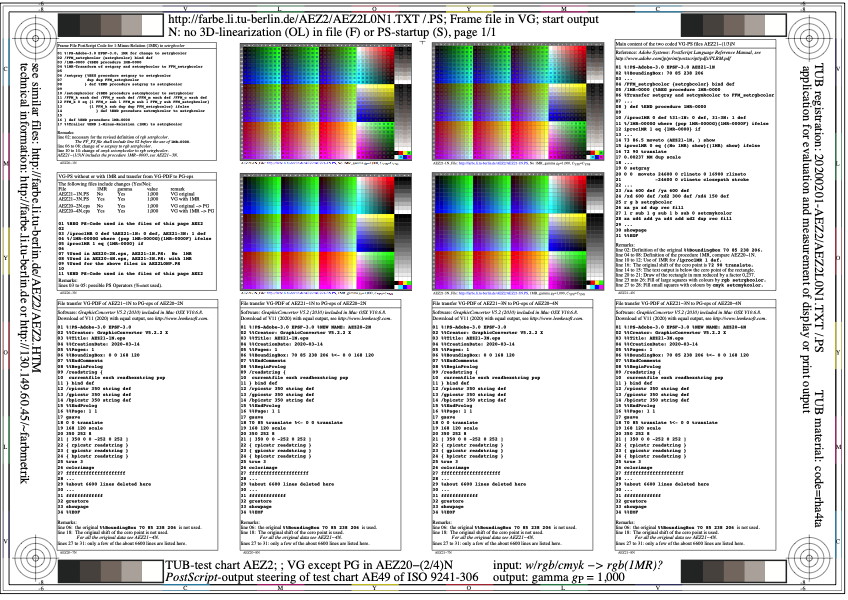
Figure AEZ2L0N1.jpg: Output in format A6 of the file
AEZ2L0NP.PDF, see
AEZ2L0N1.
PS /
TXT /
PDF /
jpg
AEZ2: TUB-test chart AEZ2; PostScript-output steering of ISO-AE49
hand coded PS files of frame and 16 figures
application of 1-minus-relation, transfer 1 VG -> 1 VG and 2 PG
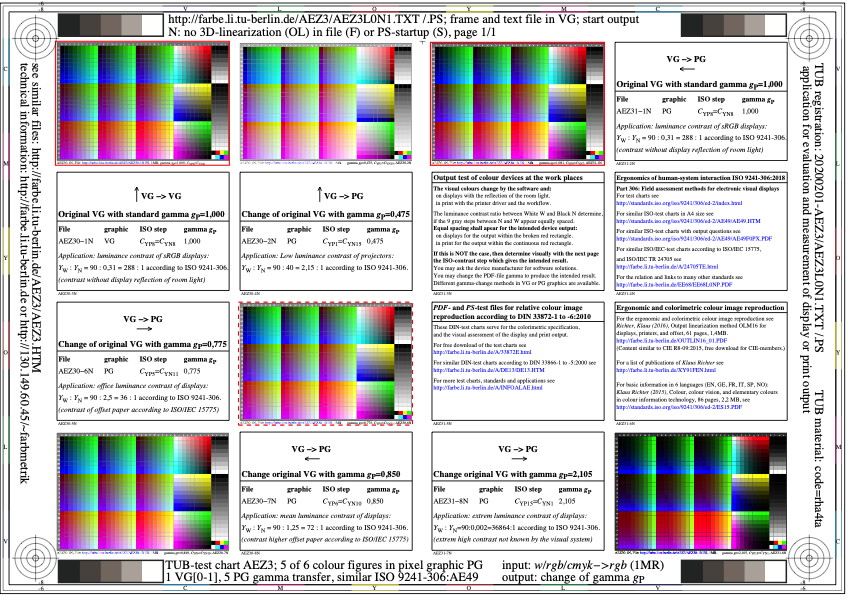
Figure AEZ3L0N1.jpg: Output in format A6 of the file
AEZ3L0NP.PDF, see
AEZ3L0N1.
PS /
TXT /
PDF /
jpg
AEZ3: TUB-test chart AEZ3; PostScript-output steering of ISO-AE49
hand coded PS files of frame and 16 figures
for 0,475 <= gammaP <=2,105, transfer of 1 VG -> 5 PG

Figure AEZ4L0N1.jpg: Output in format A6 of the file
AEZ4L0NP.PDF, see
AEZ4L0N1.
PS /
TXT /
PDF /
jpg
AEZ4: TUB-test chart AEZ4; PostScript-output steering of ISO-AE49
hand coded PS files of frame and 16 figures
for 0,475 <= gammaP <=2,105, transfer of 1 VG -> 5 VG
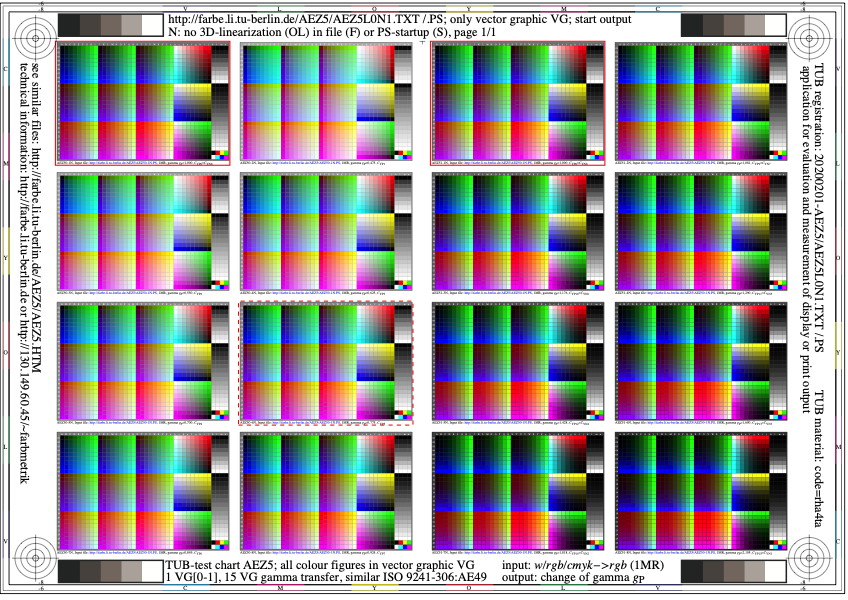
Figure AEZ5L0N1.jpg: Output in format A6 of the file
AEZ5L0NP.PDF, see
AEZ5L0N1.
PS /
TXT /
PDF /
jpg
AEZ5: TUB-test chart AEZ5; PostScript-output steering of ISO-AE49
hand coded PS files of frame and 16 figures
for 0,475 <= gammaP <=2,105, transfer of 1 VG -> 15 VG
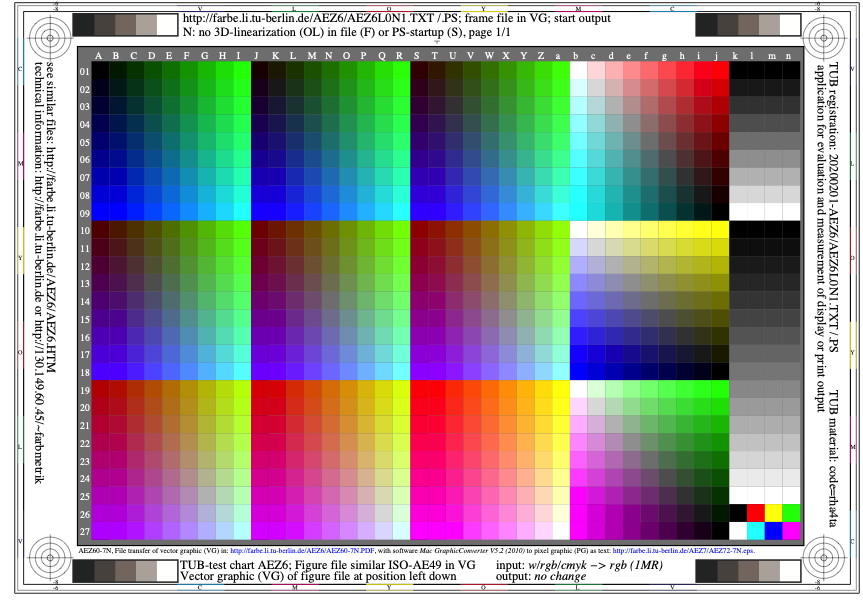
Figure AEZ6L0N1.jpg: Output in format A6 of the file
AEZ6L0NP.PDF, see
AEZ6L0N1.
PS /
TXT /
PDF /
jpg
AEZ6: TUB-test chart AEZ6; Frame and figure file similar to ISO-AE49
Frame file in VG includes one figure file in VG
in size 24,6cm x 16,9cm at standard position left down
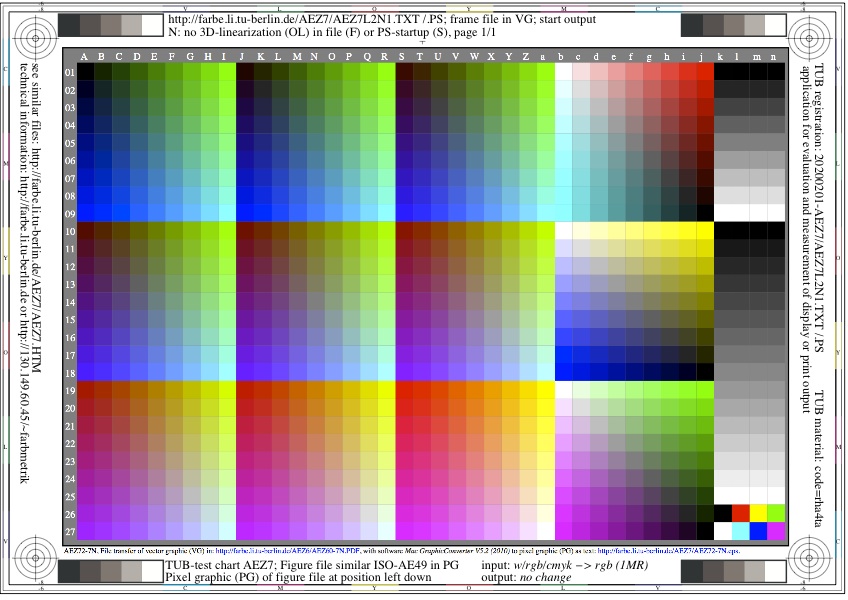
Figure AEZ7L0N1.jpg: Output in format A6 of the file
AEZ7L0NP.PDF, see
AEZ7L0N1.
PS /
TXT /
PDF /
jpg
AEZ7: TUB-test chart AEZ7; Frame and figure file similar to ISO-AE49
Frame file in VG and PG includes one figure file in PG
in size 24,6cm x 16,9cm at standard position left down
Figure AEZ8L0N1.jpg: Output in format A6 of the file
AEZ8L0NP.PDF, see
AEZ8L0N1.
PS /
TXT /
PDF /
jpg
AEZ8: TUB-test chart AEZ8; Frame file and 16 figure files
Frame file in VG and PG, 16 figure files in VG or PG
in size 5,4 cm x 4,0 cm at 16 standard positions
Figure AEZ9L0N1.jpg: Output in format A6 of the file
AEZ9L0NP.PDF, see
AEZ9L0N1.
PS /
TXT /
PDF /
jpg
AEZ9: TUB-test chart AEZ9; Frame file and one figure file
Frame file in VG and PG, one figure file in VG or PG
in size 5,4 cm x 4,0 cm at position left down
Section 2, Chapter A:
Colour Image Technology and Colour Management (2019)
This image page with 260 image series:
ae2s in English,
ag2s in German.
Previous image page:
ze2s in English,
zg2s in German.
Next image page:
be2s in English,
bg2s in German.
Introduction, content list and summary:
AEAI,
AEA_I,
AEA_S in English or
AGAI,
AGA_I,
AGA_S in German.
-------
For the archive information (2000-2009) of the BAM server "www.ps.bam.de"
(2000-2018)
about colour test charts, colorimetric calculations,
standards, and publications, see
indexAE.html in English,
indexAG.html in German.
Back to the main page of this TUB web site (NOT archive), see
index.html in English,
indexDE.html in German.