Figure AET0L0N1.jpg: Output in format A6 of the file AET0L0NP.PDF, see
AET0L0N1. PS / TXT / PDF / jpg
241201 1L2L0X0A_S2710.KTS/YETLAIN.KTS, http://farbe.li.tu-berlin.de/AETS.HTM or http://color.li.tu-berlin.de/AETS.HTM
For links to the
Section 2, Chapter A
Colour Image Technology and Colour Management (2019),
see
For this image page with 10 colour series, see
AETS in English,
AGTS in German.
For the previous image page, see
AESS in English,
AGSS in German.
For the next image page, see
AEUS in English,
AGUS in German.
No previous chapter of chapter A
.
For the first image page of the next chapter B, see
BEAS in English,
BGAS in German.
Content list of chapter A:
AEA_I in English or
AGA_I in German.
Summary of chapter A:
AEA_S in English or
AGA_S in German.
For the large image page of chapter A with 260 colour series, see
ae2s in English or
ag2s in German.
Section 2, Chapter A
Colour Image Technology and Colour Management (2019),
Image part AETS
The following ten pages AET0 to AET9 of this chapter
show the content with links to the single figures
in up to six formats.
Figure AET0L0N1.jpg: Output in format A6 of the file
AET0L0NP.PDF, see
AET0L0N1.
PS /
TXT /
PDF /
jpg
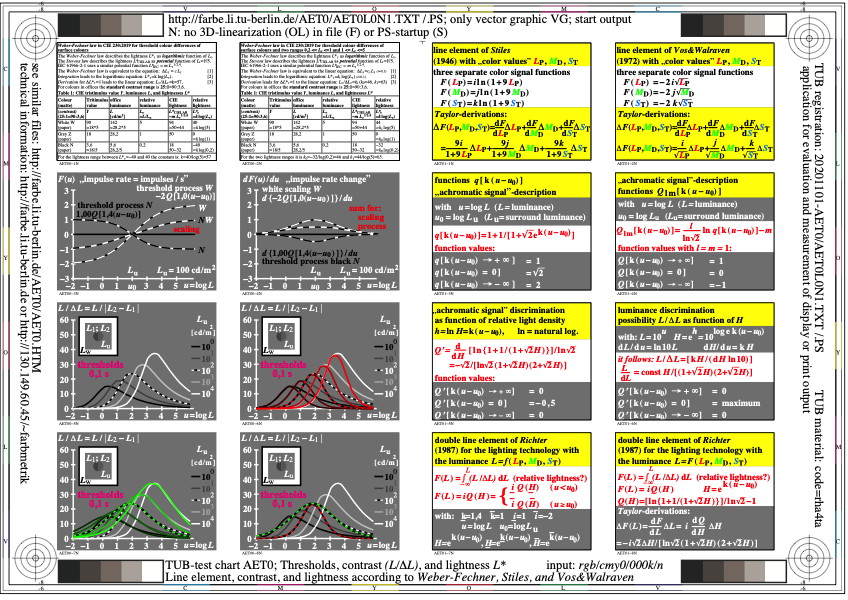
AET0: TUB-Test chart AET0; Line element for colour scaling
contrast and colorimetric, psycho-physical,
and physiological properties of colour vision
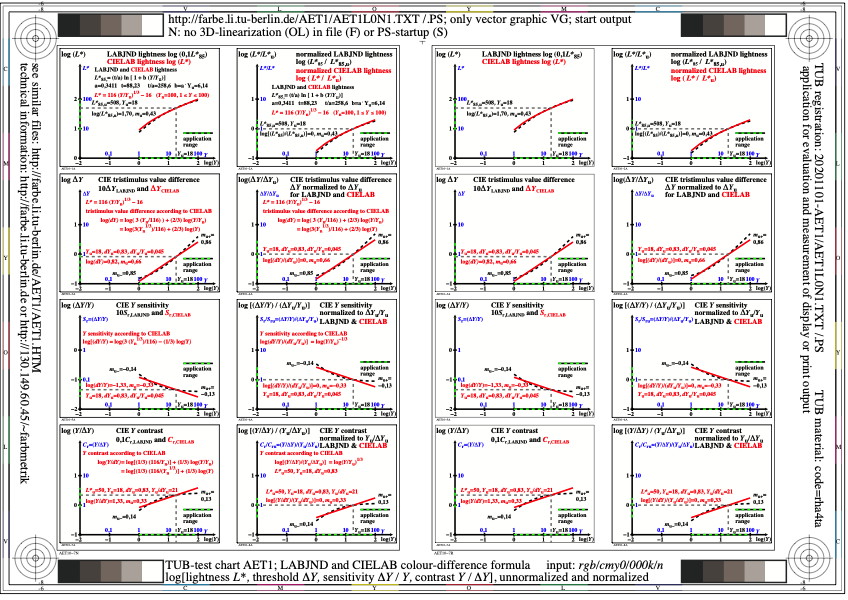
Figure AET1L0N1.jpg: Output in format A6 of the file
AET1L0NP.PDF, see
AET1L0N1.
PS /
TXT /
PDF /
jpg
AET1: TUB-Test chart AET1; Comparison of LABJND & CIEDE2000 formula
CIE lightness L*, derivation dL*/dY, and threshold dY
CIE sensitivity dY/Y and CIE contrast Y/dY
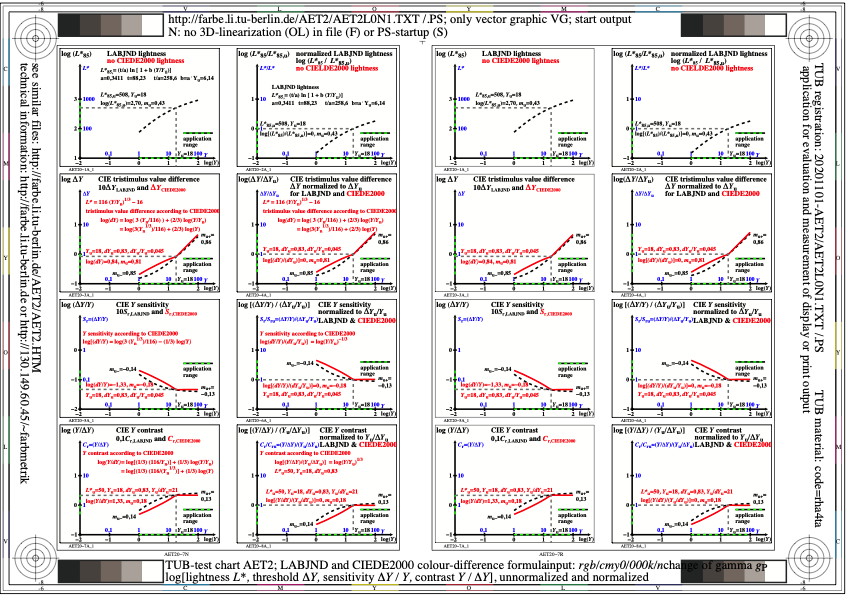
Figure AET2L0N1.jpg: Output in format A6 of the file
AET2L0NP.PDF, see
AET2L0N1.
PS /
TXT /
PDF /
jpg
AET2: TUB-Test chart AET2; Comparison of LABJND & CIELAB formula
CIE lightness L*, derivation dL*/dY, and threshold dY
CIE sensitivity dY/Y and CIE contrast Y/dY
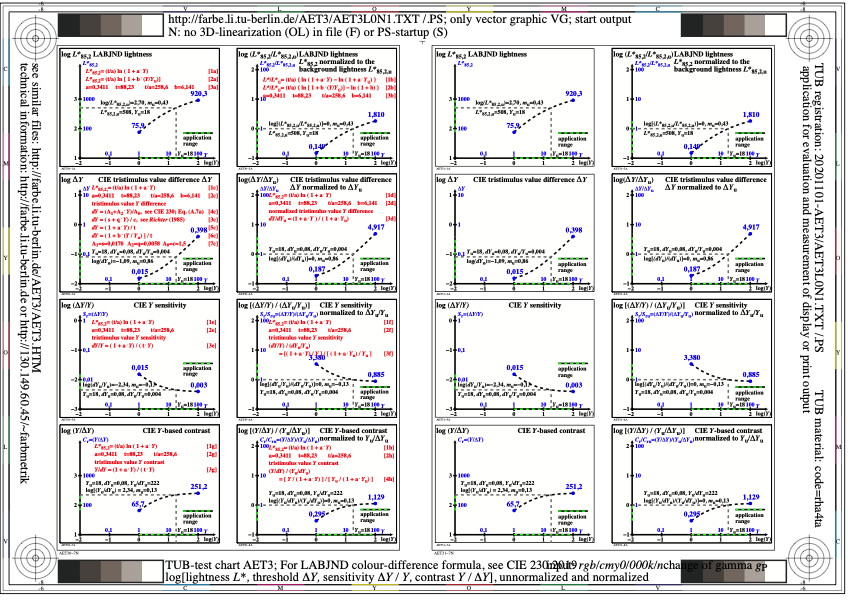
Figure AET3L0N1.jpg: Output in format A6 of the file
AET3L0NP.PDF, see
AET3L0N1.
PS /
TXT /
PDF /
jpg
AET3: TUB-Test chart AET3; LABJND colour differences, CIE 230:2019
logarithmic ordinate for LABJND lightness L*,
derivation dL*/dY, sensitivity dY/Y, and contrast Y/dY
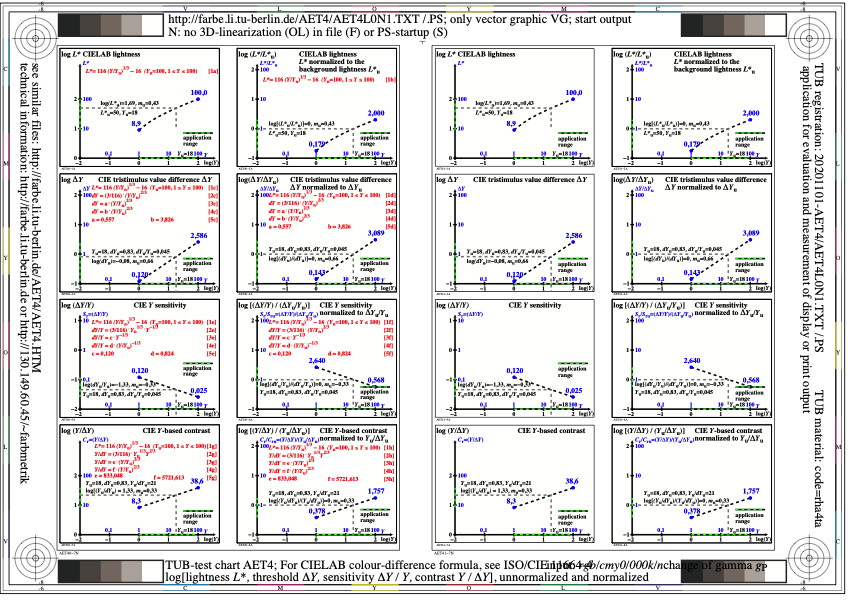
Figure AET4L0N1.jpg: Output in format A6 of the file
AET4L0NP.PDF, see
AET4L0N1.
PS /
TXT /
PDF /
jpg
AET4: TUB-Test chart AET4; CIELAB colour differences, CIE 230:2019
logarithmic ordinate for CIELAB lightness L*,
derivation dL*/dY, sensitivity dY/Y, and contrast Y/dY
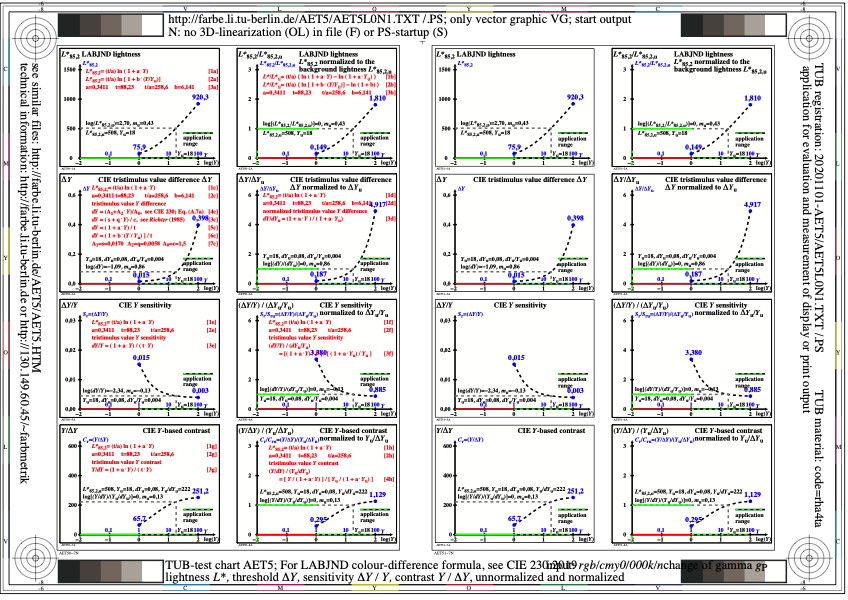
Figure AET5L0N1.jpg: Output in format A6 of the file
AET5L0NP.PDF, see
AET5L0N1.
PS /
TXT /
PDF /
jpg
AET5: TUB-Test chart AET5; LABJND colour differences, CIE 230:2019
linear ordinate for LABJND lightness L*,
derivation dL*/dY, sensitivity dY/Y, and contrast Y/dY
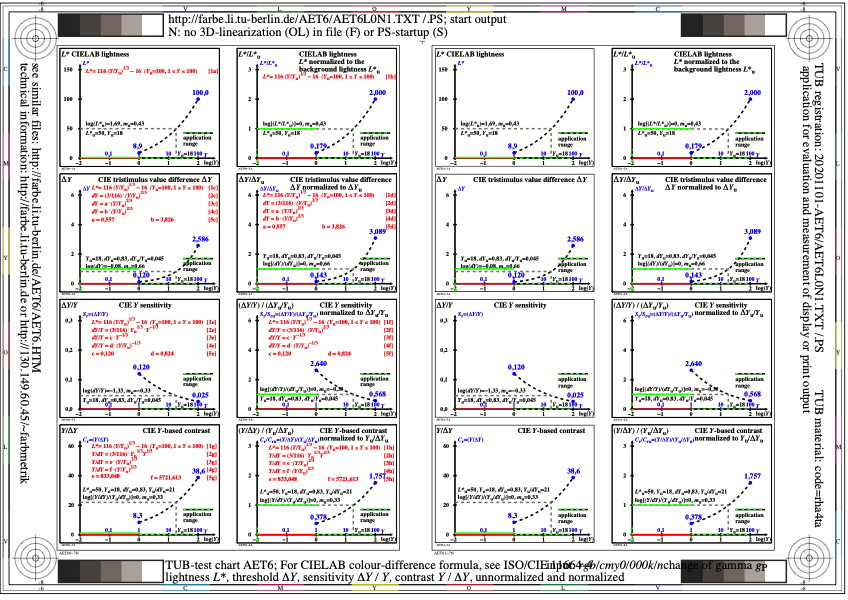
Figure AET6L0N1.jpg: Output in format A6 of the file
AET6L0NP.PDF, see
AET6L0N1.
PS /
TXT /
PDF /
jpg
AET6: TUB-Test chart AET6; CIELAB colour differences, CIE 230:2019
linear ordinate for CIELAB lightness L*,
derivation dL*/dY, sensitivity dY/Y, and contrast Y/dY
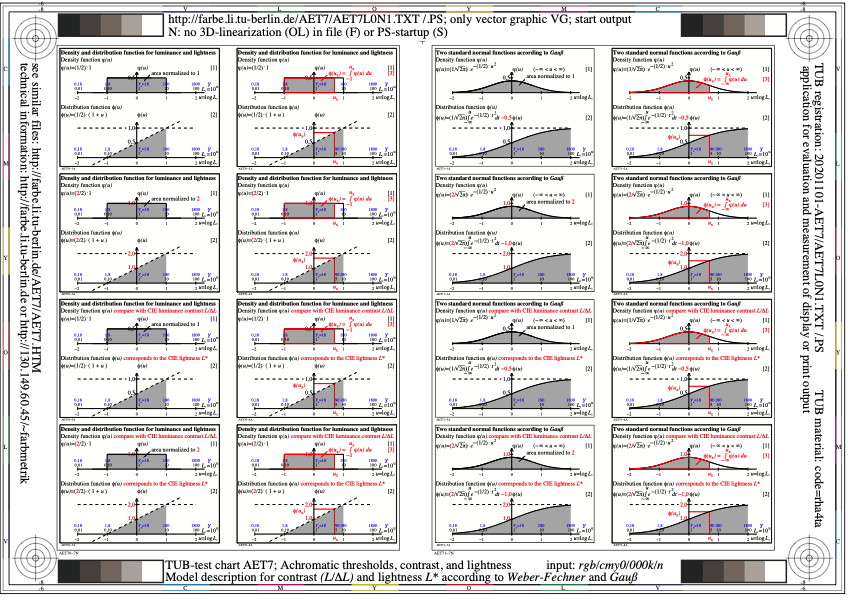
Figure AET7L0N1.jpg: Output in format A6 of the file
AET7L0NP.PDF, see
AET7L0N1.
PS /
TXT /
PDF /
jpg
AET7: TUB-Test chart AET7; Thresholds, contrast and lightness
Model description for contrast L/(delta L), and
TitleC7
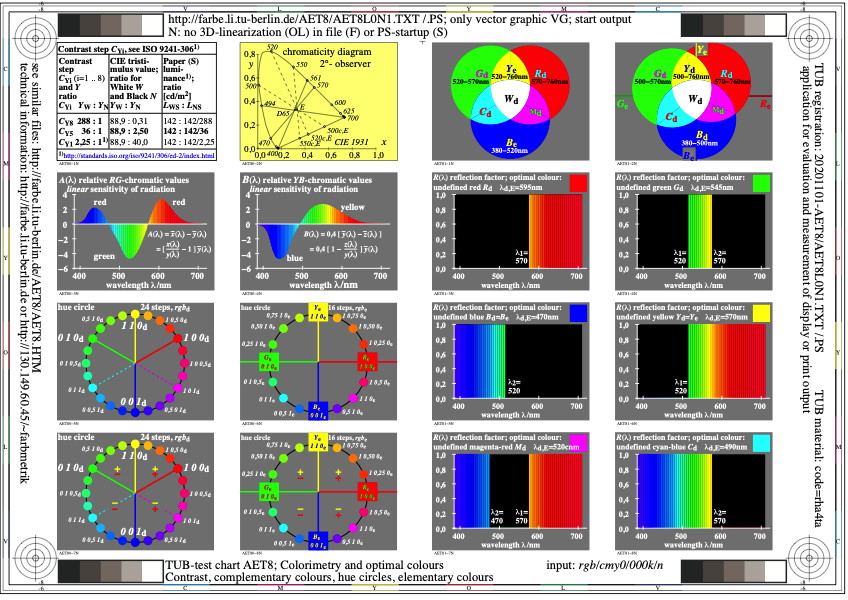
Figure AET8L0N1.jpg: Output in format A6 of the file
AET8L0NP.PDF, see
AET8L0N1.
PS /
TXT /
PDF /
jpg
AET8: TUB-Test chart AET8; Colorimetry and optimal colours
Contrast, complementary colours, hue circles
elementary colours, wavelength range
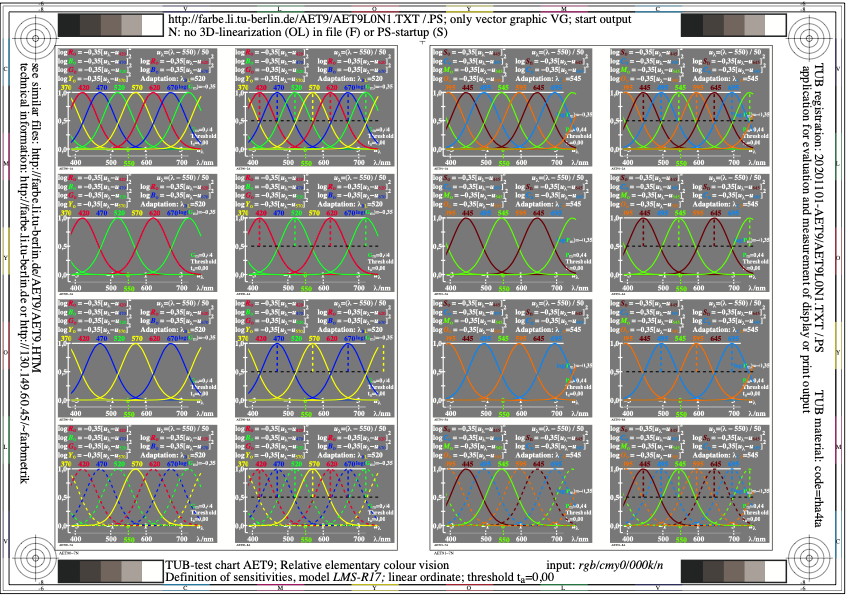
Figure AET9L0N1.jpg: Output in format A6 of the file
AET9L0NP.PDF, see
AET9L0N1.
PS /
TXT /
PDF /
jpg
AET9: TUB-Test chart AET9; Relative elementary colour vision
definition of log[sensitivities]; model
LMS_R17; linear ordinate; threshold ta=0,00
-------
For the archive information (2000-2009) of the BAM server "www.ps.bam.de"
(2000-2018)
about colour test charts, colorimetric calculations,
standards, and publications, see
indexAE.html in English,
indexAG.html in German.
Back to the main page of this TUB web site (NOT archive), see
index.html in English,
indexDE.html in German.