Figure BEA0L0N1.jpg: Output in format A6 of the file BEA0L0NP.PDF, see
BEA0L0N1. PS / TXT / PDF / jpg
241201 1L2L0X0B_S2710.KTS/YEALBIN.KTS, http://farbe.li.tu-berlin.de/BEAS.HTM or http://color.li.tu-berlin.de/BEAS.HTM
For links to the
Section 2, Chapter B
Colour Vision and Colourimetry (2020),
see
For this image page with 10 colour series, see
BEAS in English,
BGAS in German.
For the previous image page, see
BEZS in English,
BGZS in German.
For the next image page, see
BEBS in English,
BGBS in German.
For the first image page of the previous chapter A, see
AEAS in English,
AGAS in German.
For the first image page of the next chapter C, see
CEAS in English,
CGAS in German.
Content list of chapter B:
BEA_I in English or
BGA_I in German.
Summary of chapter B:
BEA_S in English or
BGA_S in German.
For the large image page of chapter B with 260 colour series, see
be2s in English or
bg2s in German.
Section 2, Chapter B
Colour vision and Colorimetry (2020),
Image part BEAS
The following ten pages BEA0 to BEA9 of this chapter
show the content with links to the single figures
in up to six formats.
Figure BEA0L0N1.jpg: Output in format A6 of the file
BEA0L0NP.PDF, see
BEA0L0N1.
PS /
TXT /
PDF /
jpg
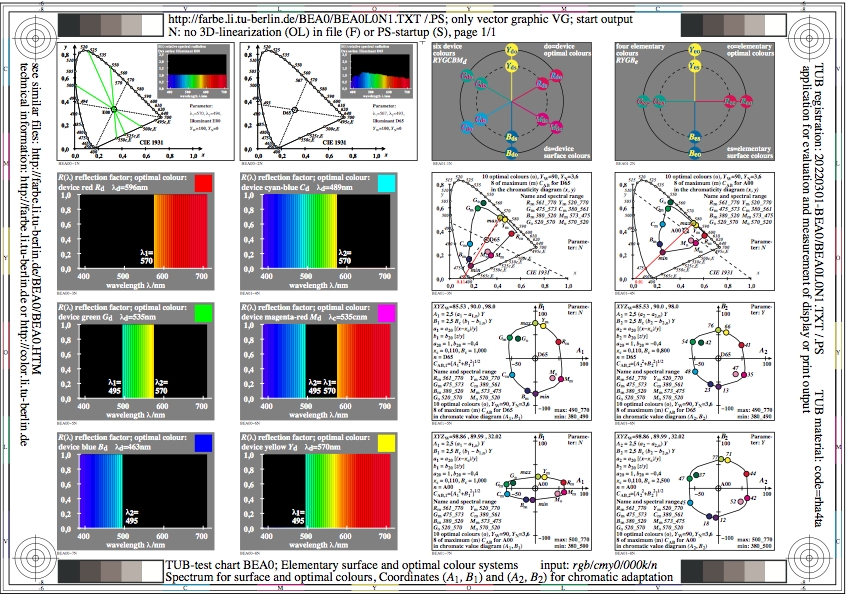
BEA0: TUB-test chart BEA0; Elementary colours and chromatic adaptation
Spectrum for surface and optimal colours
Coordinates (A1, B1) and (A2,B2) for chromatic adaptation

Figure BEA1L0N1.jpg: Output in format A6 of the file
BEA1L0NP.PDF, see
BEA1L0N1.
PS /
TXT /
PDF /
jpg
BEA1: TUB-test chart BEA1; Chromatic adaptation model
Ostwald-optimal colours for 8 Planck radiations
correlated colour temperatures 6000K (P60) to 2500K (P25)

Figure BEA2L0N1.jpg: Output in format A6 of the file
BEA2L0NP.PDF, see
BEA2L0N1.
PS /
TXT /
PDF /
jpg
BEA2: TUB-test chart BEA2; Optimal and Arens-elementary colours
Colour management for the devices sRGB and WCGa
(Wide Colour Gamut) with rgb*-colour data
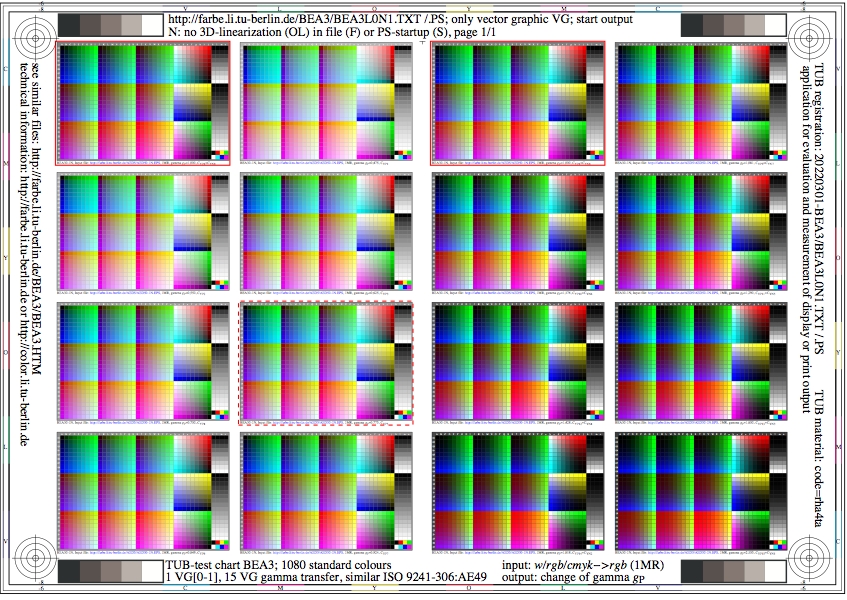
Figure BEA3L0N1.jpg: Output in format A6 of the file
BEA3L0NP.PDF, see
BEA3L0N1.
PS /
TXT /
PDF /
jpg
BEA3: TUB-test chart BEA3; 1080 standard colours, Code (row/column)
1 VG[0-1], transfer to 15 VG[0-2 to 0-8, 1-1 to 1-8]
15 VG with 0,475<=gp<=2,105, similar to ISO 9241-306:AG4
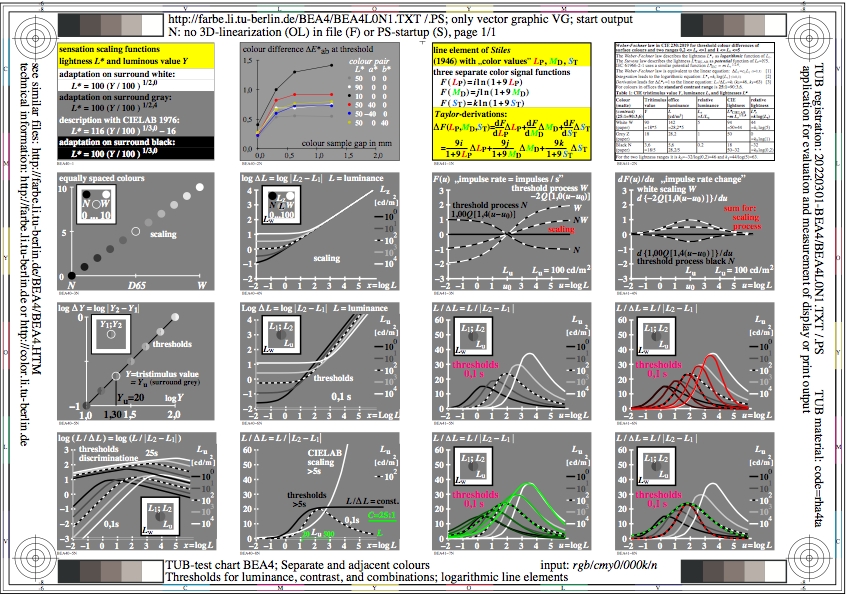
Figure BEA4L0N1.jpg: Output in format A6 of the file
BEA4L0NP.PDF, see
BEA4L0N1.
PS /
TXT /
PDF /
jpg
BEA4: TUB-test chart BEA4; Separate and adjacent colours
Thresholds for luminance, contrast, and combinations
Logarithmic line elements for colour and contrast
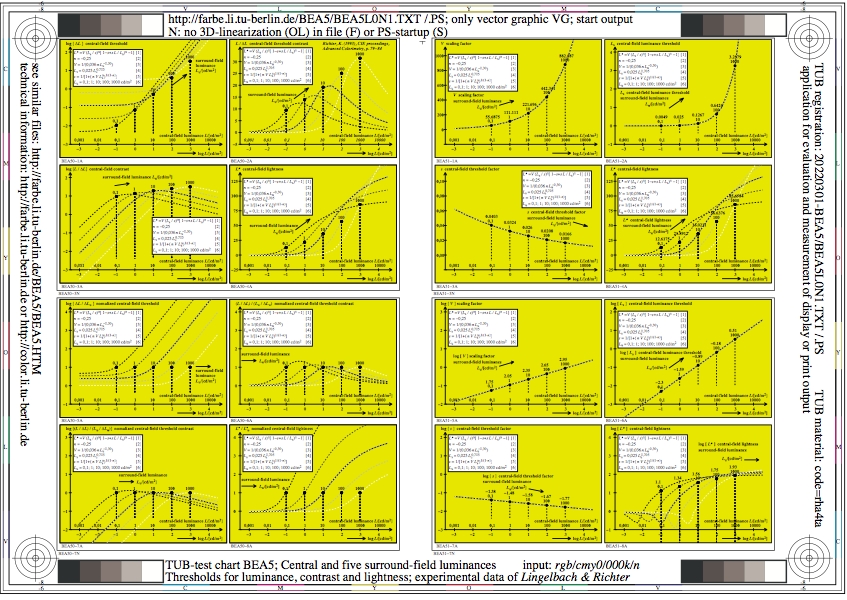
Figure BEA5L0N1.jpg: Output in format A6 of the file
BEA5L0NP.PDF, see
BEA5L0N1.
PS /
TXT /
PDF /
jpg
BEA5: TUB-test chart BEA5; Central and 5 surround-field luminances
Thresholds for luminance, and lightness;
experimental data of Lingelbach & Richter

Figure BEA6L0N1.jpg: Output in format A6 of the file
BEA6L0NP.PDF, see
BEA6L0N1.
PS /
TXT /
PDF /
jpg
BEA6: TUB-test chart BEA6; Criteria for elementary hues
Thresholds in NW, RG and YB direction as function of Y
Colour-difference formula LABJND and metric with (a, b) & Y
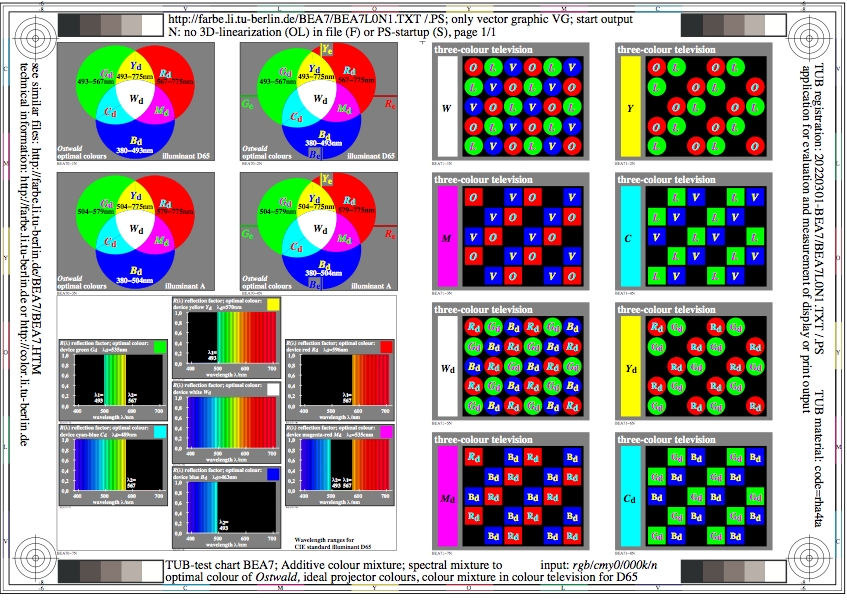
Figure BEA7L0N1.jpg: Output in format A6 of the file
BEA7L0NP.PDF, see
BEA7L0N1.
PS /
TXT /
PDF /
jpg
BEA7: TUB-test chart BEA7; Additive colour mixture, spectral
mixture to optimal colours of Ostwald, ideal
projector colours, colour mixture in colour television to D65

Figure BEA8L0N1.jpg: Output in format A6 of the file
BEA8L0NP.PDF, see
BEA8L0N1.
PS /
TXT /
PDF /
jpg
BEA8: TUB-test chart BEA8; Complementary spectral colours
for the calculation of Ostwald optimal colours for
8 illuminants Pxx and Dxx, and the CIE-02-degree observer
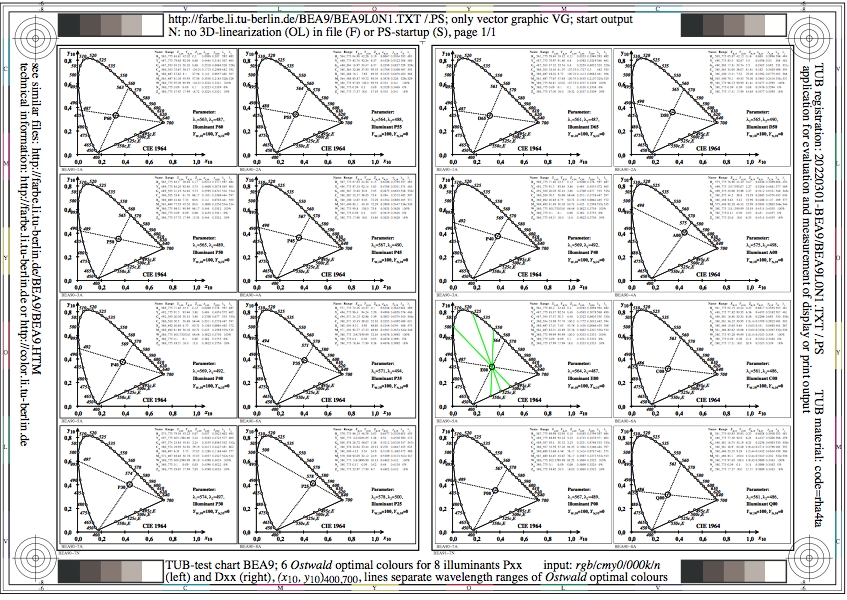
Figure BEA9L0N1.jpg: Output in format A6 of the file
BEA9L0NP.PDF, see
BEA9L0N1.
PS /
TXT /
PDF /
jpg
BEA9: TUB-test chart BEA9; Complementary spectral colours
for the calculation of Ostwald optimal colours for
8 illuminants Pxx and Dxx, and the CIE-10-degree observer
-------
For the archive information (2000-2009) of the BAM server "www.ps.bam.de"
(2000-2018)
about colour test charts, colorimetric calculations,
standards, and publications, see
indexAE.html in English,
indexAG.html in German.
Back to the main page of this TUB web site (NOT archive), see
index.html in English,
indexDE.html in German.