Figure AEU0L0N1.jpg: Output in format A6 of the file AEU0L0NP.PDF, see
AEU0L0N1. PS / TXT / PDF / jpg
240215 1L2L0X0A_S2710.KTS/YEULAIN.KTS, http://farbe.li.tu-berlin.de/AEUS.HTM or http://color.li.tu-berlin.de/AEUS.HTM
For links to the
Section 2, Chapter A
Colour Image Technology and Colour Management (2019),
see
For this image page with 10 colour series, see
AEUS in English,
AGUS in German.
For the previous image page, see
AETS in English,
AGTS in German.
For the next image page, see
AEVS in English,
AGVS in German.
No previous chapter of chapter A
.
For the first image page of the next chapter B, see
BEAS in English,
BGAS in German.
Content list of chapter A:
AEA_I in English or
AGA_I in German.
Summary of chapter A:
AEA_S in English or
AGA_S in German.
For the large image page of chapter A with 260 colour series, see
ae2s in English or
ag2s in German.
Section 2, Chapter A
Colour Image Technology and Colour Management (2019),
Image part AEUS
The following ten pages AEU0 to AEU9 of this chapter
show the content with links to the single figures
in up to six formats.
Figure AEU0L0N1.jpg: Output in format A6 of the file
AEU0L0NP.PDF, see
AEU0L0N1.
PS /
TXT /
PDF /
jpg
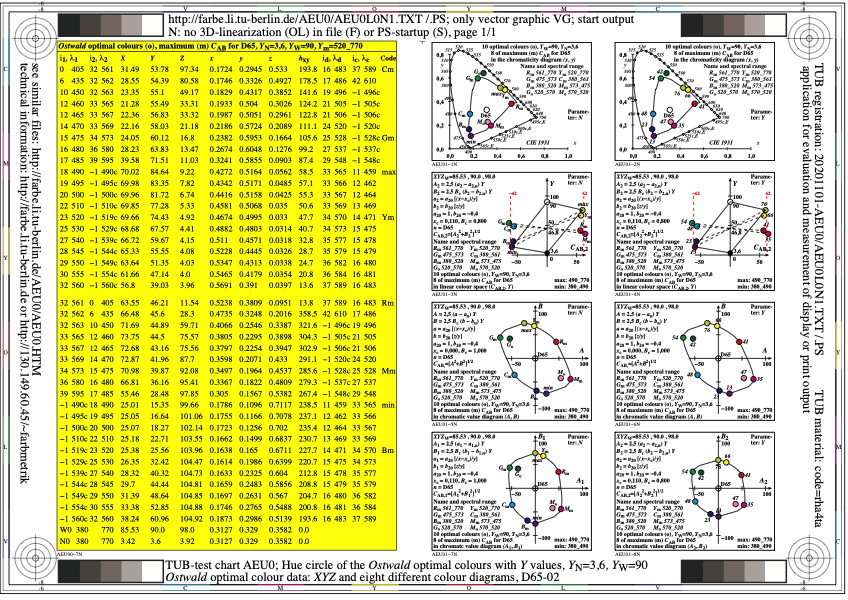
AEU0: TUB-test chart AEU0; Ostwald-optimal colours
YN=3,6, YW=90, CIE illuminant D65, CIE 02 degree
XYZ data of hue circle in 8 colour diagrams
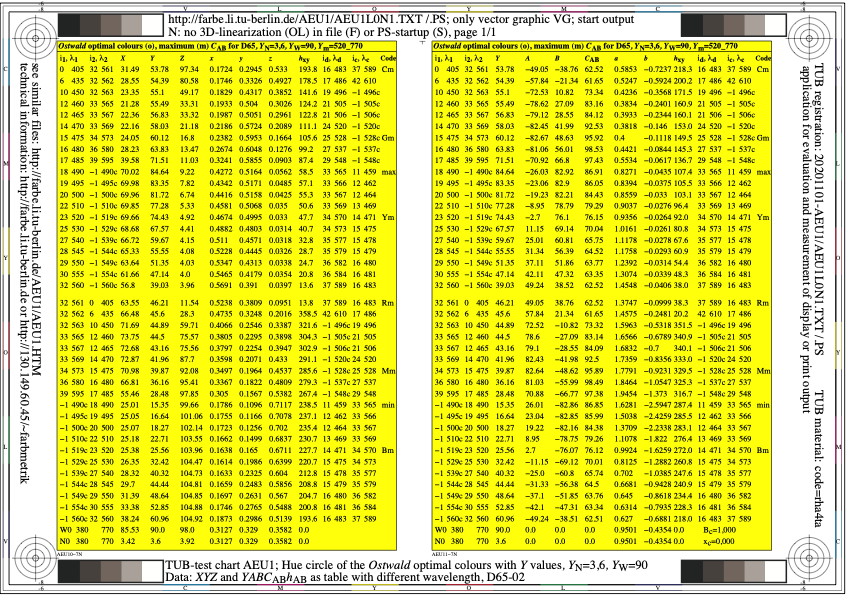
Figure AEU1L0N1.jpg: Output in format A6 of the file
AEU1L0NP.PDF, see
AEU1L0N1.
PS /
TXT /
PDF /
jpg
AEU1: TUB-test chart AEU1; Ostwald-optimal colours
YN=3,6, YW=90, CIE illuminant D65, CIE 02 degree
Data XYZ and YABCh as table with wavelength
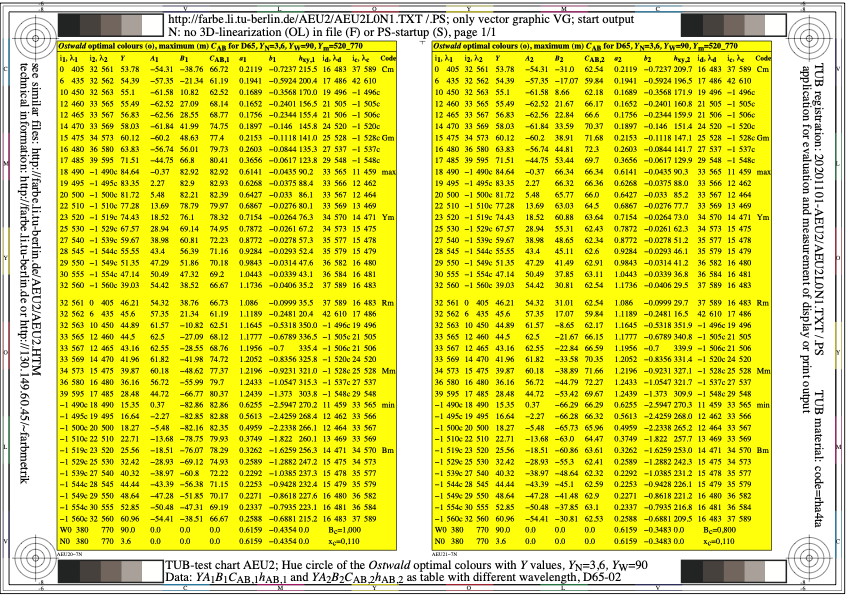
Figure AEU2L0N1.jpg: Output in format A6 of the file
AEU2L0NP.PDF, see
AEU2L0N1.
PS /
TXT /
PDF /
jpg
AEU2: TUB-test chart AEU2; Ostwald-optimal colours
YN=3,6, YW=90, CIE illuminant D65, CIE 02 degree
Data YABCh1 and YABCh2 as table with wavelength
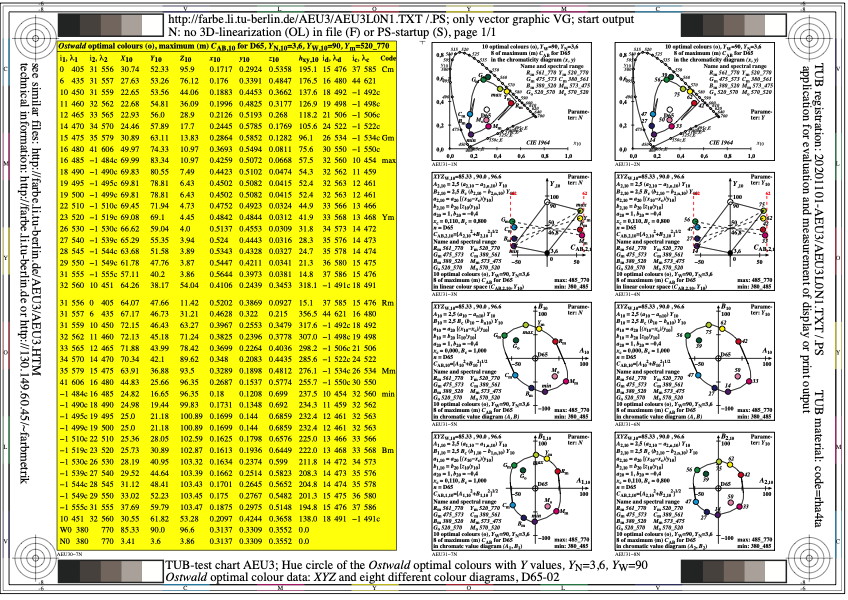
Figure AEU3L0N1.jpg: Output in format A6 of the file
AEU3L0NP.PDF, see
AEU3L0N1.
PS /
TXT /
PDF /
jpg
AEU3: TUB-test chart AEU3; Ostwald-optimal colours
YN=3,6, YW=90, CIE illuminant D65, CIE 10 degree
XYZ data and 8 colour diagrams
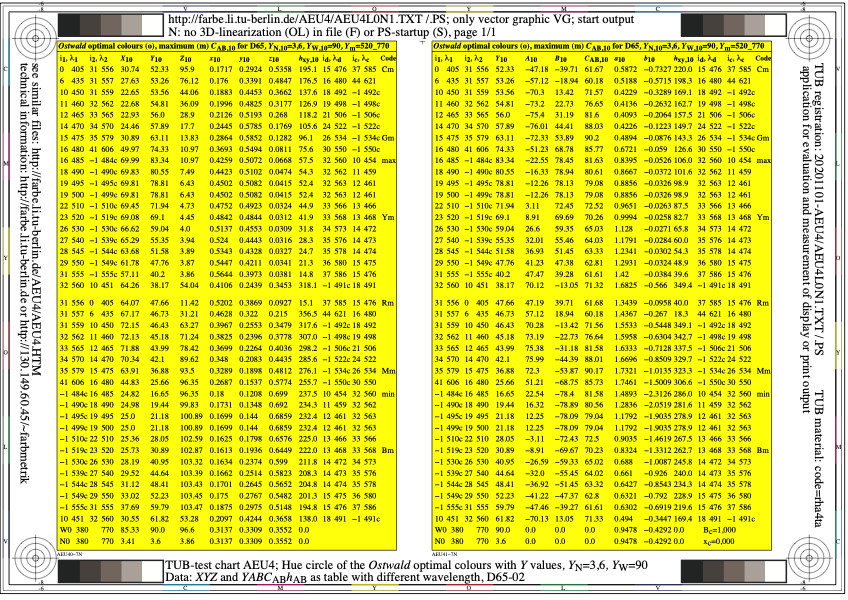
Figure AEU4L0N1.jpg: Output in format A6 of the file
AEU4L0NP.PDF, see
AEU4L0N1.
PS /
TXT /
PDF /
jpg
AEU4: TUB-test chart AEU4; Ostwald-optimal colours
YN=3,6, YW=90, CIE illuminant D65, CIE 10 degree
Data XYZ and YABCh as table with wavelength
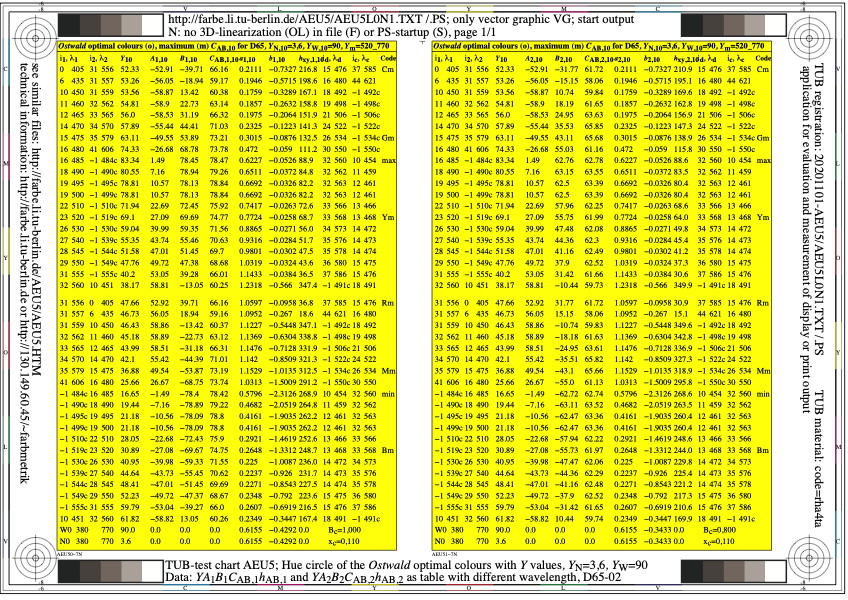
Figure AEU5L0N1.jpg: Output in format A6 of the file
AEU5L0NP.PDF, see
AEU5L0N1.
PS /
TXT /
PDF /
jpg
AEU5: TUB-test chart AEU5;Ostwald-optimal colours
YN=3,6, YW=90, CIE illuminant D65, CIE 10 degree
Data YABCh1 and YABCh2 as table with wavelength
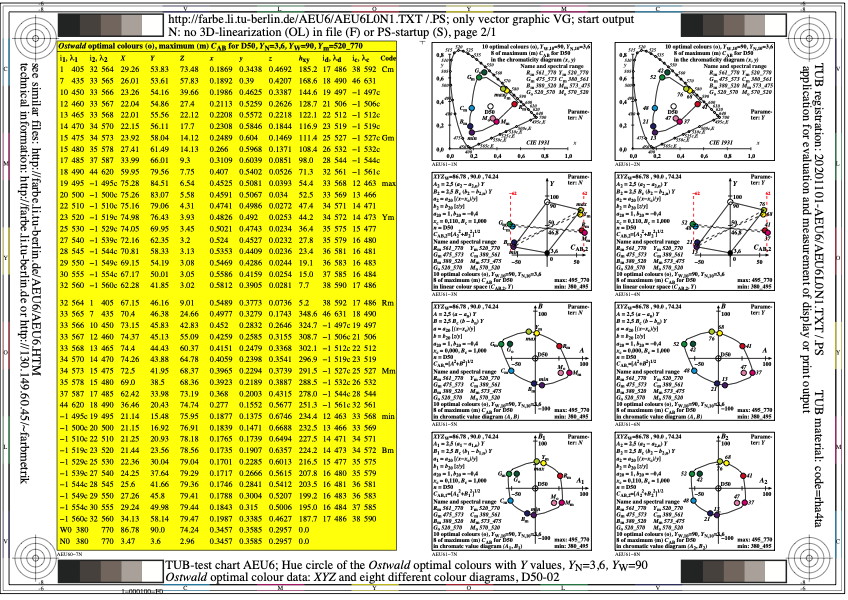
Figure AEU6L0N1.jpg: Output in format A6 of the file
AEU6L0NP.PDF, see
AEU6L0N1.
PS /
TXT /
PDF /
jpg
AEU6: TUB-test chart AEU6; Ostwald-optimal colours
YN=3,6, YW=90, CIE illuminant D50, CIE 02 degree
XYZ data of hue circle 8 colour diagrams

Figure AEU7L0N1.jpg: Output in format A6 of the file
AEU7L0NP.PDF, see
AEU7L0N1.
PS /
TXT /
PDF /
jpg
AEU7: TUB-test chart AEU7; Ostwald-optimal colours
YN=3,6, YW=90, CIE illuminant D50, CIE 02 degree
Data XYZ and YABCh as table with wavelength
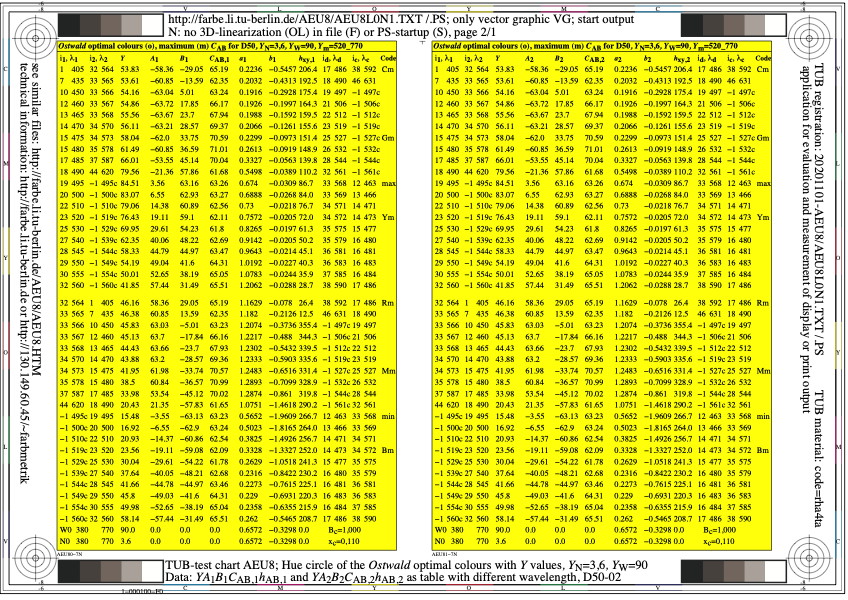
Figure AEU8L0N1.jpg: Output in format A6 of the file
AEU8L0NP.PDF, see
AEU8L0N1.
PS /
TXT /
PDF /
jpg
AEU8: TUB-test chart AEU8; Ostwald-optimal colours
YN=3,6, YW=90, CIE illuminant D50, CIE 02 degree
Data YABCh1 and YABCh2 as table with wavelength
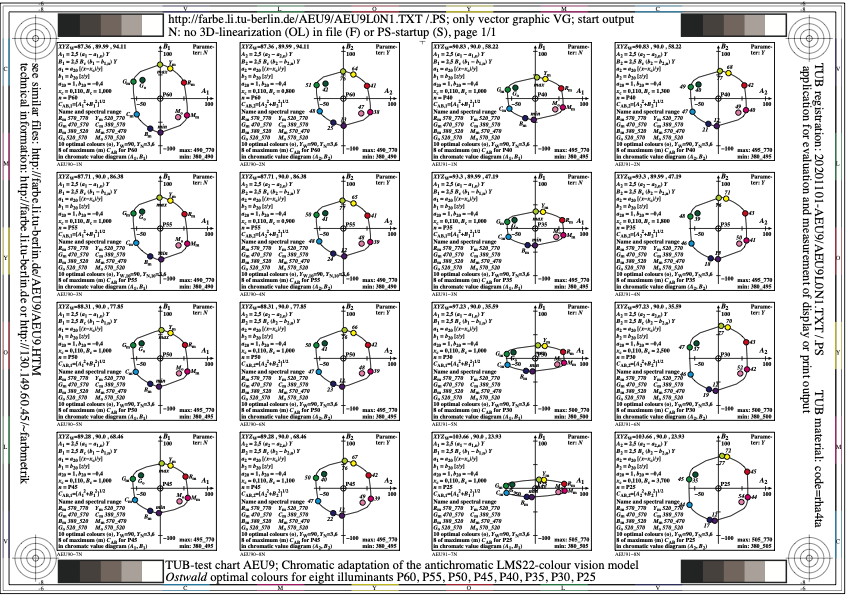
Figure AEU9L0N1.jpg: Output in format A6 of the file
AEU9L0NP.PDF, see
AEU9L0N1.
PS /
TXT /
PDF /
jpg
AEU9: TUB-test chart AEU9; Chromatic adaptation of LMS22 model
Ostwald-optimal colours for 8 illuminants:
P60 (6000K), P55, P50, P45, P40, P35, P30, P25 (2500K)
-------
For the archive information (2000-2009) of the BAM server "www.ps.bam.de"
(2000-2018)
about colour test charts, colorimetric calculations,
standards, and publications, see
indexAE.html in English,
indexAG.html in German.
Back to the main page of this TUB web site (NOT archive), see
index.html in English,
indexDE.html in German.