Figure fen0l0n1.jpg: Output in format A6 of the file fen0l0np.pdf, see
fen0l0n1. ps / txt / pdf / jpg
240215 1L2L0X0F_K2710.KTS/YEnlFIN.KTS http://farbe.li.tu-berlin.de/fens.htm or http://color.li.tu-berlin.de/fens.htm
For links to the
Section 2, Chapter F
Colour Metrics for chromatic and luminance adaptation (2024),
see
For this image page with 10 colour series, see
fens in English,
fgns in German.
For the previous image page, see
fems in English,
fgms in German.
For the next image page, see
feos in English,
fgos in German.
For the first image page of the previous chapter E, see
eeas in English,
egas in German.
For the first image page of the next chapter G (under work), see
geas in English,
ggas in German.
Content list of chapter F:
fea_i in English or
fga_i in German.
Summary of chapter F:
fea_s in English or
fga_s in German.
For the large image page of chapter F with 260 colour series, see
fe2s in English or
fg2s in German.
Section 2, Chapter F
Colour metrics for chromatic and luminance adaptation (2024),
Image part fens
The following ten pages fen0 to fen9 of this chapter
show the content with links to the single figures
in up to six formats.
Figure fen0l0n1.jpg: Output in format A6 of the file
fen0l0np.pdf, see
fen0l0n1.
ps /
txt /
pdf /
jpg
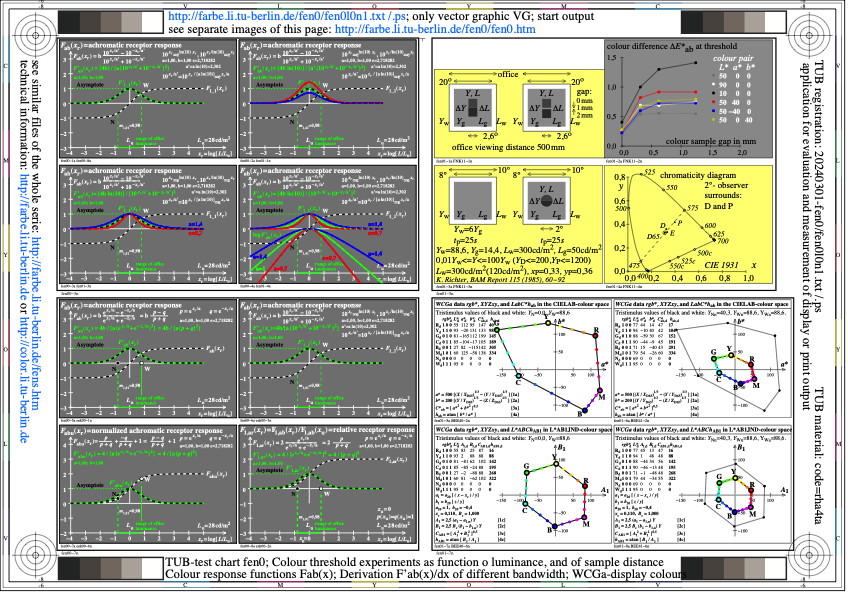
fen0: TUB-test chart fen0; Colour threshold experiments
as function of luminance and distance of the samples
Colour threshold function Fab and derivation as function of a

Figure fen1l0n1.jpg: Output in format A6 of the file
fen1l0np.pdf, see
fen1l0n1.
ps /
txt /
pdf /
jpg
fen1: TUB-test chart fen1; 1080 colours Grid 2g_di & flower image
File data: rgb/cmy0/000n/w &rgb*<=1,25; clipping ->1,00 for rgb*
1-Minus-Relation (1MR) and Device Hue (DH)
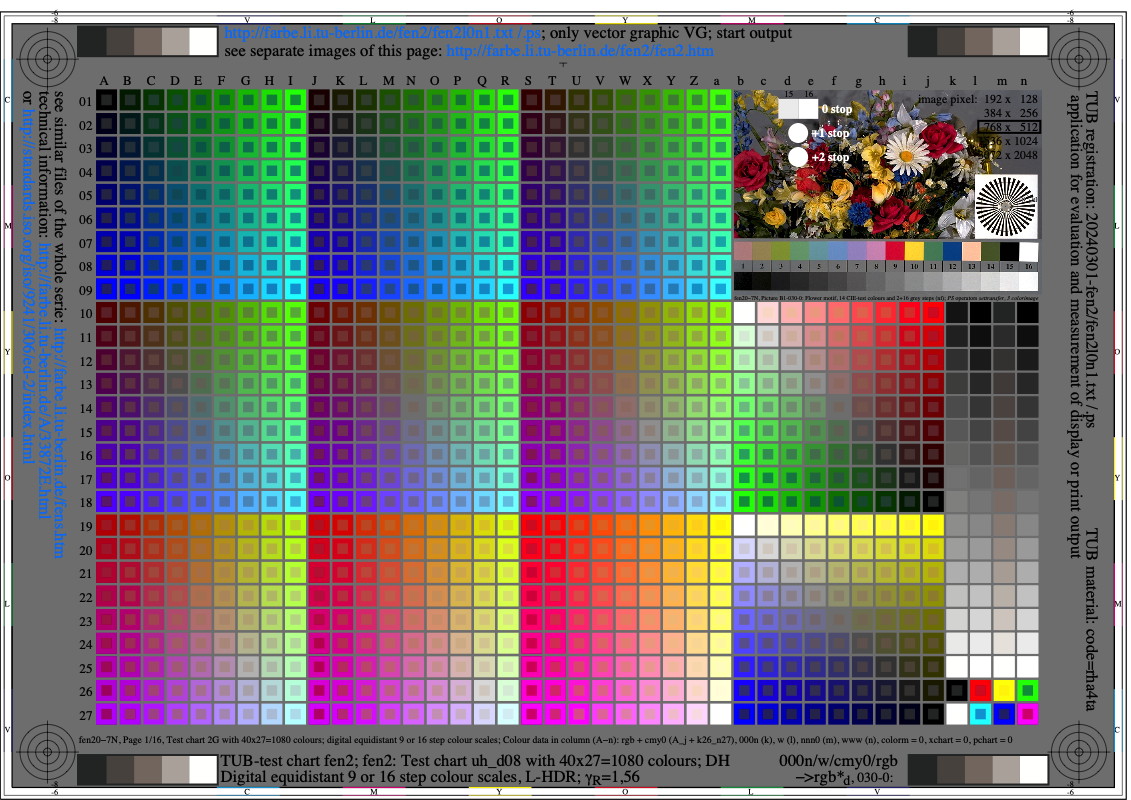
Figure fen2l0n1.jpg: Output in format A6 of the file
fen2l0np.pdf, see
fen2l0n1.
ps /
txt /
pdf /
jpg
fen2: TUB-test chart fen2; 1080 colours Grid 2g_di & flower image
File data: rgb/cmy0/000n/w &rgb*<=1,56; clipping ->1,00 for rgb*
1-Minus-Relation (1MR) and Device Hue (DH)

Figure fen3l0n1.jpg: Output in format A6 of the file
fen3l0np.pdf, see
fen3l0n1.
ps /
txt /
pdf /
jpg
fen3: TUB-test chart fen3; Colour-display systems, sRGB according
to IEC 61966-2-1, and WCGa according to ISO 22028-5
3 basic and mixture colours: CIEXYZ and CIELAB, Yw=88,6
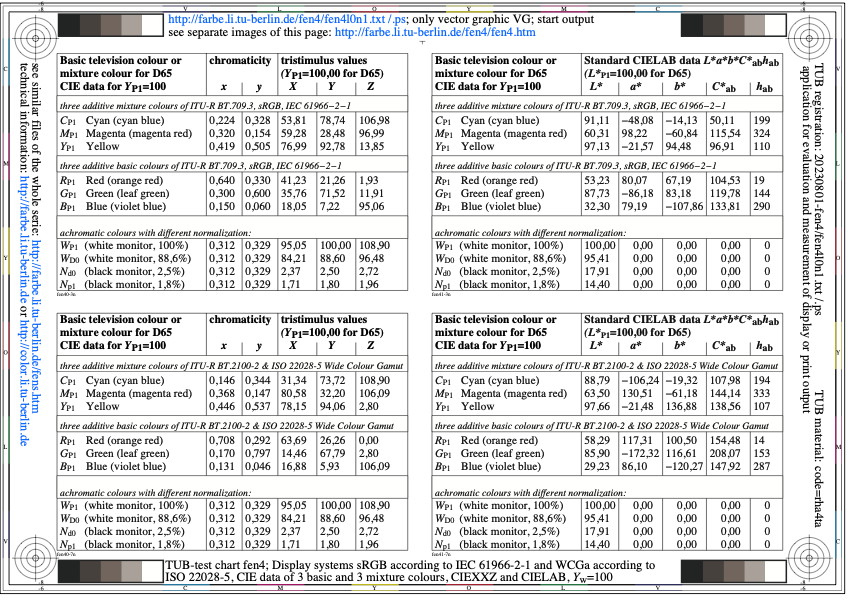
Figure fen4l0n1.jpg: Output in format A6 of the file
fen4l0np.pdf, see
fen4l0n1.
ps /
txt /
pdf /
jpg
fen4: TUB-test chart fen4; Colour-display systems, sRGB according
to IEC 61966-2-1, and WCGa according to ISO 22028-5
3 basic and mixture colours: CIEXYZ and CIELAB, Yw=100
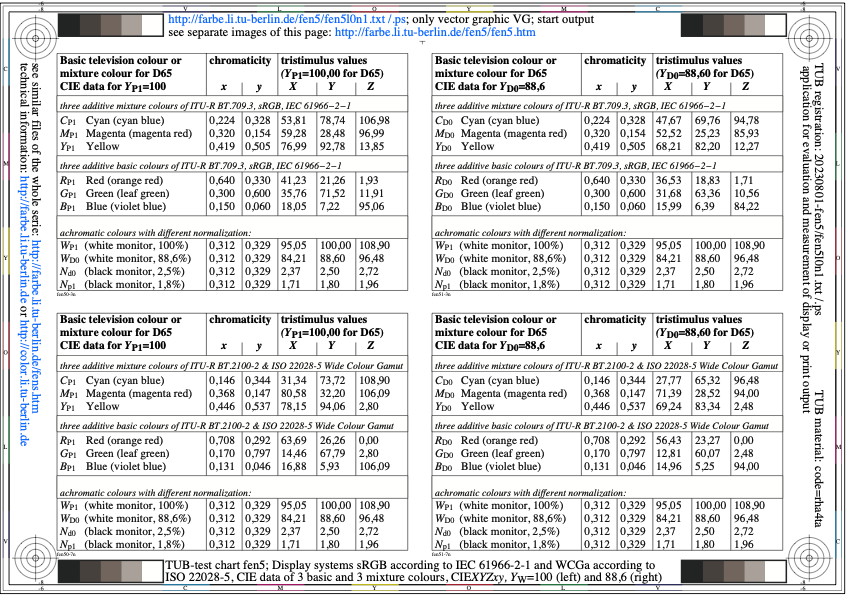
Figure fen5l0n1.jpg: Output in format A6 of the file
fen5l0np.pdf, see
fen5l0n1.
ps /
txt /
pdf /
jpg
fen5: TUB-test chart fen5; Colour-display systems
sRGB according IEC 61966-2-1, WCGa according to ISO 22028-5,
3 basic and mixture colours: CIEXYZxy, Y=100 & 88,6
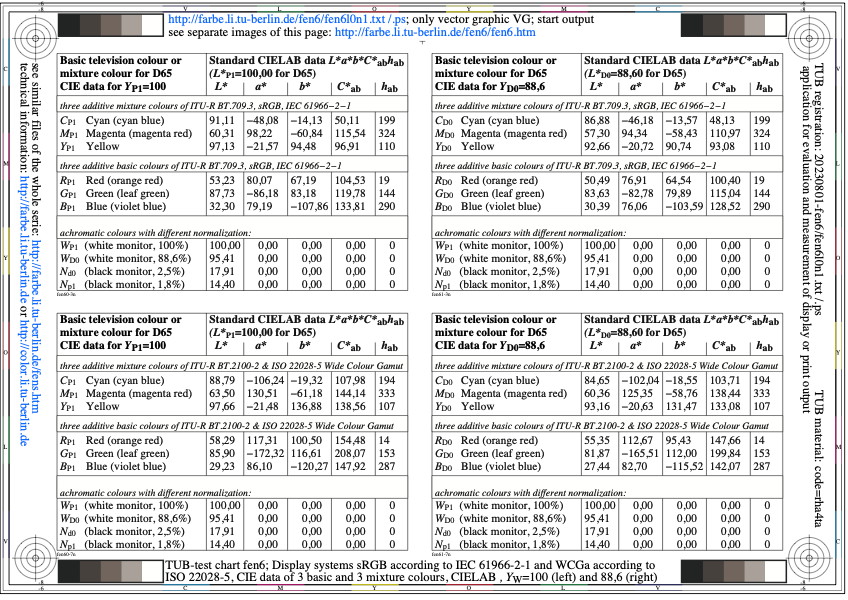
Figure fen6l0n1.jpg: Output in format A6 of the file
fen6l0np.pdf, see
fen6l0n1.
ps /
txt /
pdf /
jpg
fen6: TUB-test chart fen6; Colour-display systems
sRGB according IEC 61966-2-1, WCGa according to ISO 22028-5,
3 basic and mixture colours: CIELAB, Y=100 & 88,6
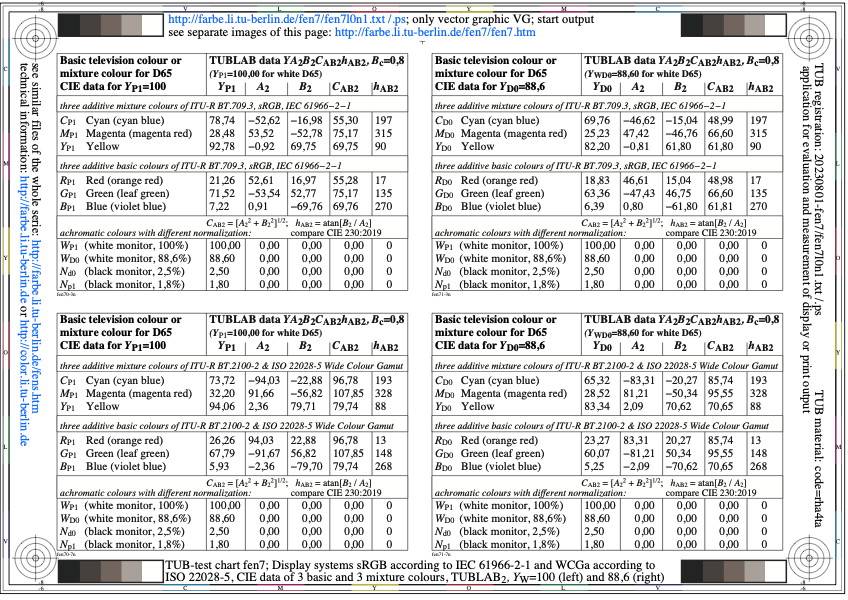
Figure fen7l0n1.jpg: Output in format A6 of the file
fen7l0np.pdf, see
fen7l0n1.
ps /
txt /
pdf /
jpg
fen7: TUB-test chart fen7;Colour-display systems
sRGB according IEC 61966-2-1, WCGa according to ISO 22028-5,
3 basic and mixture colours: TUBLAB2, Y=100 and 88,6
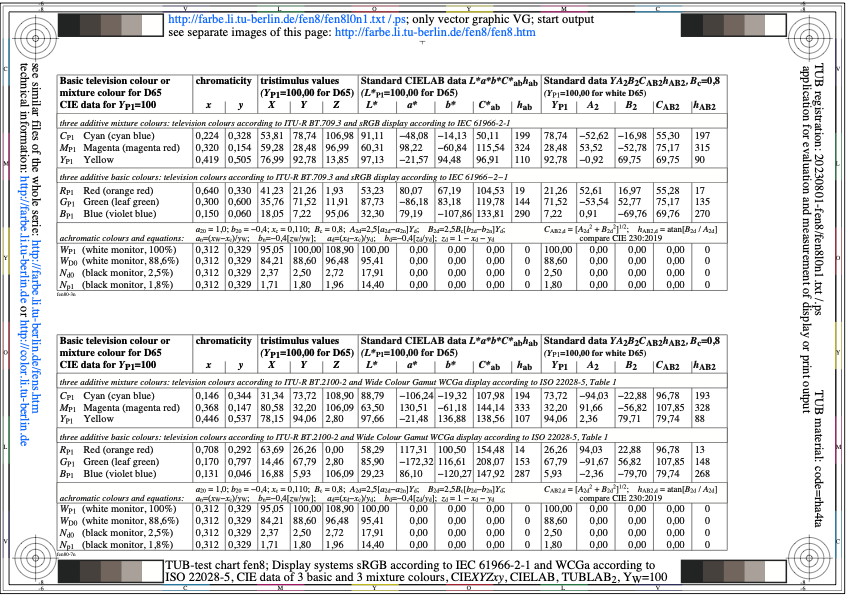
Figure fen8l0n1.jpg: Output in format A6 of the file
fen8l0np.pdf, see
fen8l0n1.
ps /
txt /
pdf /
jpg
fen8: TUB-test chart fen8;Colour-display systems
sRGB according IEC 61966-2-1, WCGa according to ISO 22028-5,
basic & mixture colours: CIEXYZxy, CIELAB, TUBLAB2, Y=100
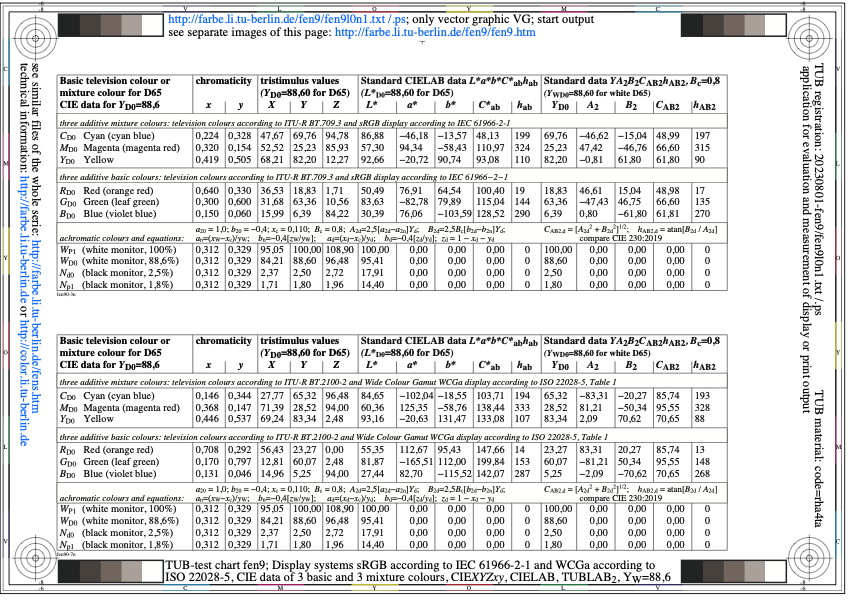
Figure fen9l0n1.jpg: Output in format A6 of the file
fen9l0np.pdf, see
fen9l0n1.
ps /
txt /
pdf /
jpg
fen9: TUB-test chart fen9;Colour-display systems
sRGB according IEC 61966-2-1, WCGa according to ISO 22028-5,
basic & mixture colours: CIEXYZ, CIELAB, TUBLAB2, Y=88,6
-------
For the archive information (2000-2009) of the BAM server "www.ps.bam.de"
(2000-2018)
about colour test charts, colorimetric calculations,
standards, and publications, see
indexAE.html in English,
indexAG.html in German.
Back to the main page of this TUB web site (NOT archive), see
index.html in English,
indexDE.html in German.