Figure feo0l0n1.jpg: Output in format A6 of the file feo0l0np.pdf, see
feo0l0n1. ps / txt / pdf / jpg
240215 1L2L0X0F_K2710.KTS/YEolFIN.KTS http://farbe.li.tu-berlin.de/feos.htm or http://color.li.tu-berlin.de/feos.htm
For links to the
Section 2, Chapter F
Colour Metrics for chromatic and luminance adaptation (2024),
see
For this image page with 10 colour series, see
feos in English,
fgos in German.
For the previous image page, see
fens in English,
fgns in German.
For the next image page, see
feps in English,
fgps in German.
For the first image page of the previous chapter E, see
eeas in English,
egas in German.
For the first image page of the next chapter G (under work), see
geas in English,
ggas in German.
Content list of chapter F:
fea_i in English or
fga_i in German.
Summary of chapter F:
fea_s in English or
fga_s in German.
For the large image page of chapter F with 260 colour series, see
fe2s in English or
fg2s in German.
Section 2, Chapter F
Colour metrics for chromatic and luminance adaptation (2024),
Image part feos
The following ten pages feo0 to feo9 of this chapter
show the content with links to the single figures
in up to six formats.
Figure feo0l0n1.jpg: Output in format A6 of the file
feo0l0np.pdf, see
feo0l0n1.
ps /
txt /
pdf /
jpg
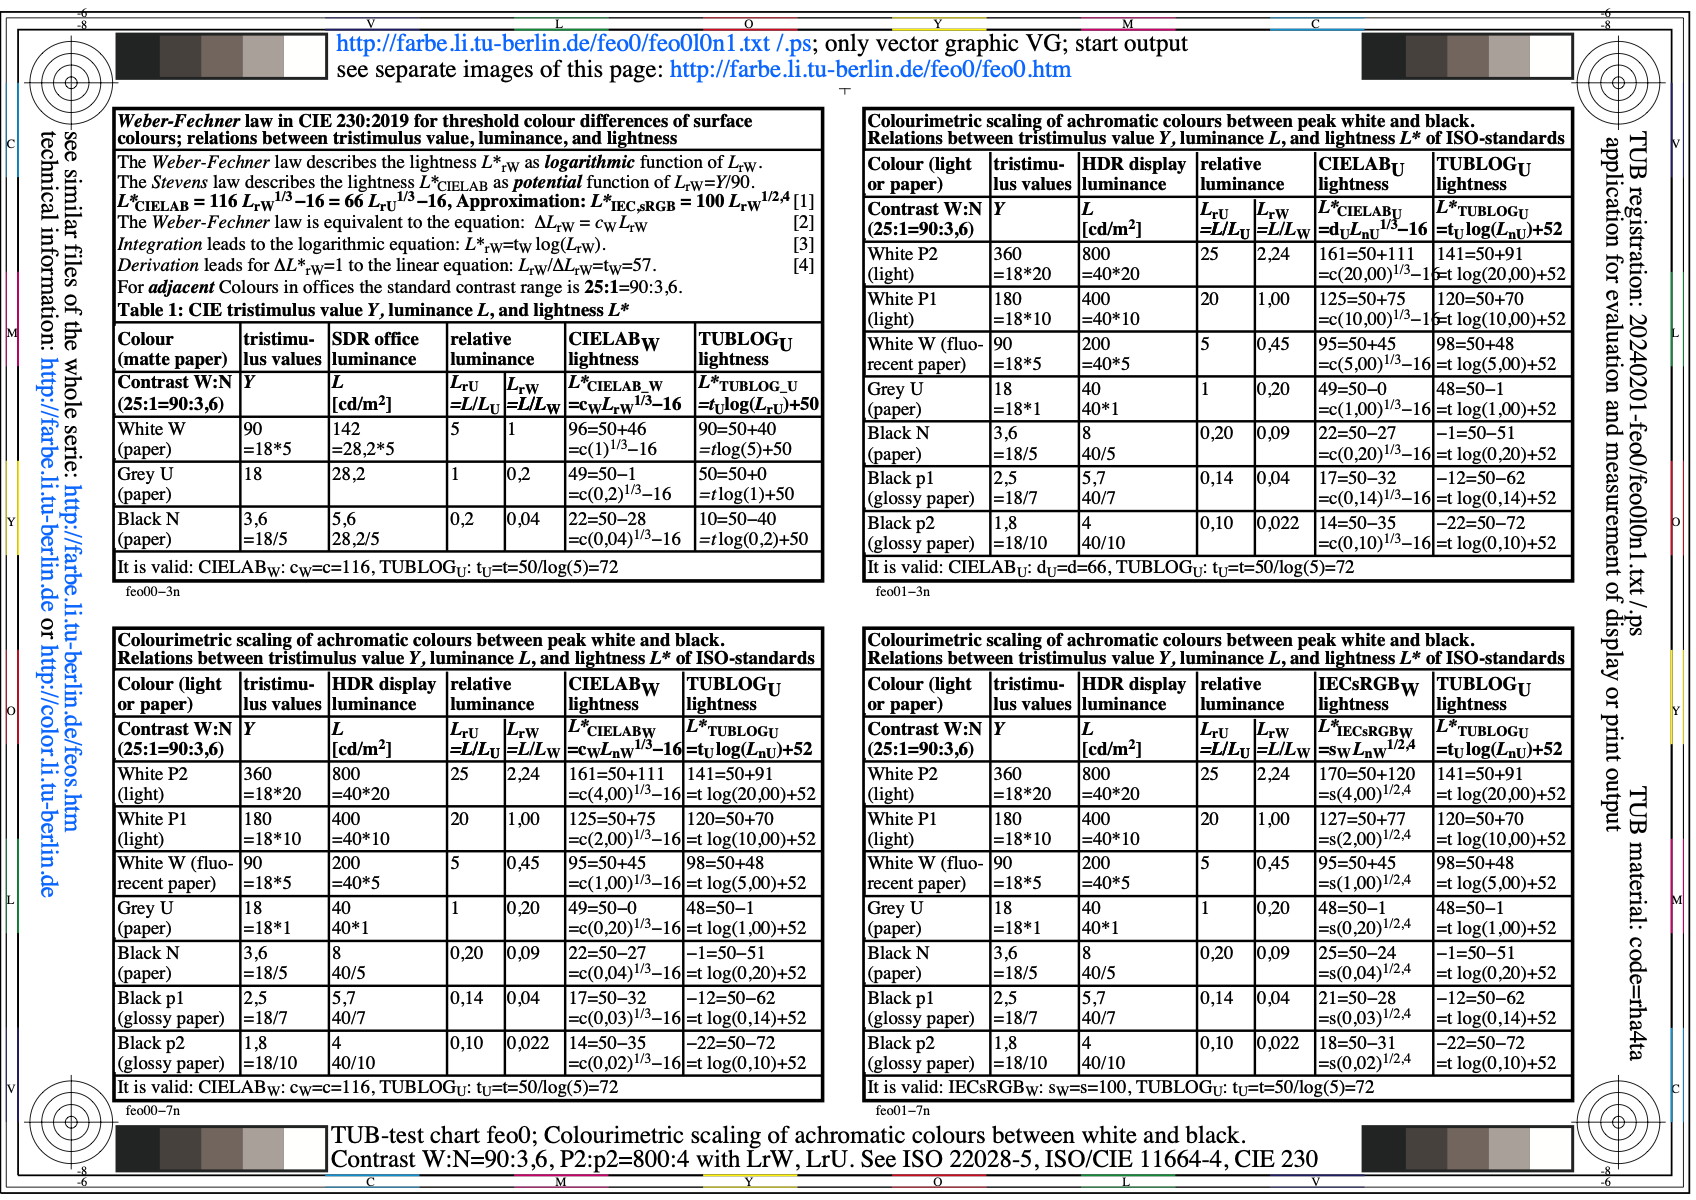
feo0: TUB-test chart feo0; Scaling of display colours
achromatic colurs between white W and black N, contrast
W:N=90:3,6, P2:p2=800:4 with YnW, YnU, see ISO 22028-5

Figure feo1l0n1.jpg: Output in format A6 of the file
feo1l0np.pdf, see
feo1l0n1.
ps /
txt /
pdf /
jpg
feo1: TUB-test chart feo1; Scaling of display colours
achromatic colurs between white W and black N, contrast
W:N=90:3,6, P1:p1=400:4 with YnW, YnU, see ISO 22028-5
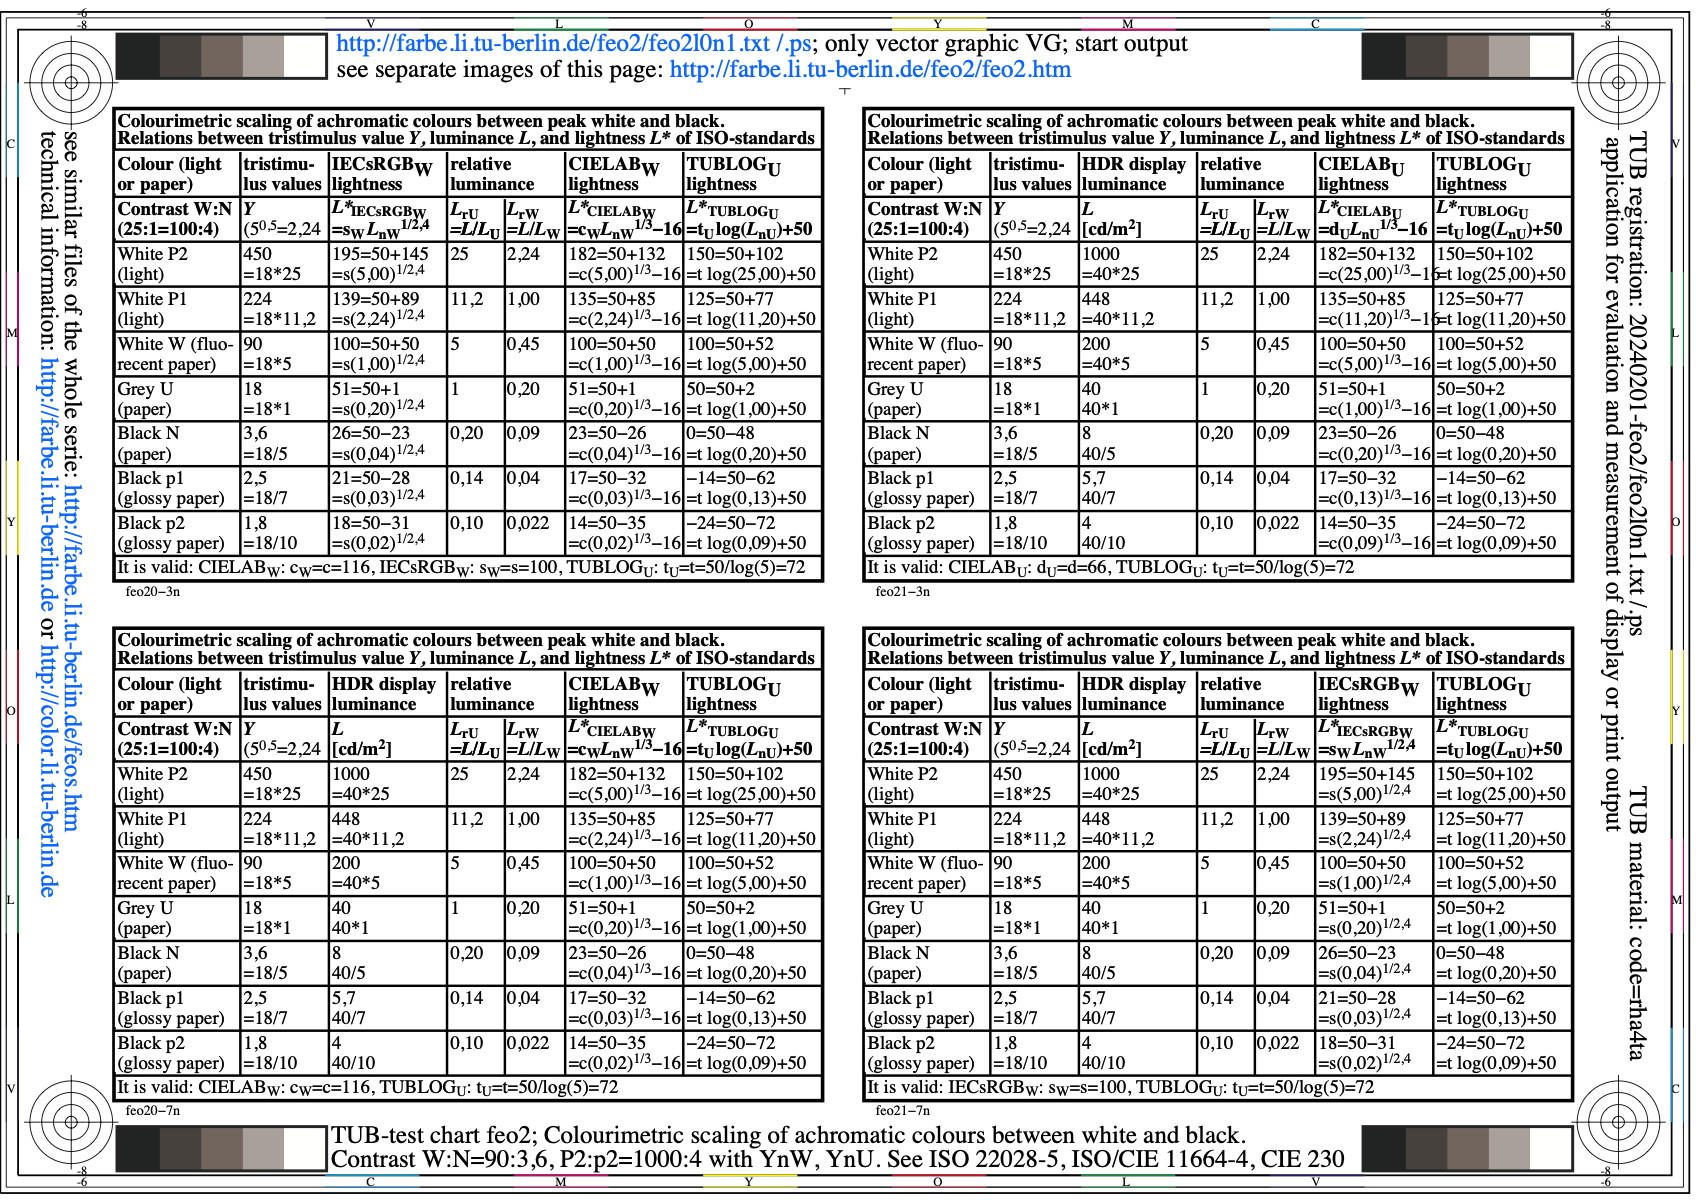
Figure feo2l0n1.jpg: Output in format A6 of the file
feo2l0np.pdf, see
feo2l0n1.
ps /
txt /
pdf /
jpg
feo2: TUB-test chart feo2; Scaling of display colours
achromatic colurs between white W and black N, contrast
W:N=90:3,6, P2:p2=1000:4 with YnW, YnU, see ISO 22028-5
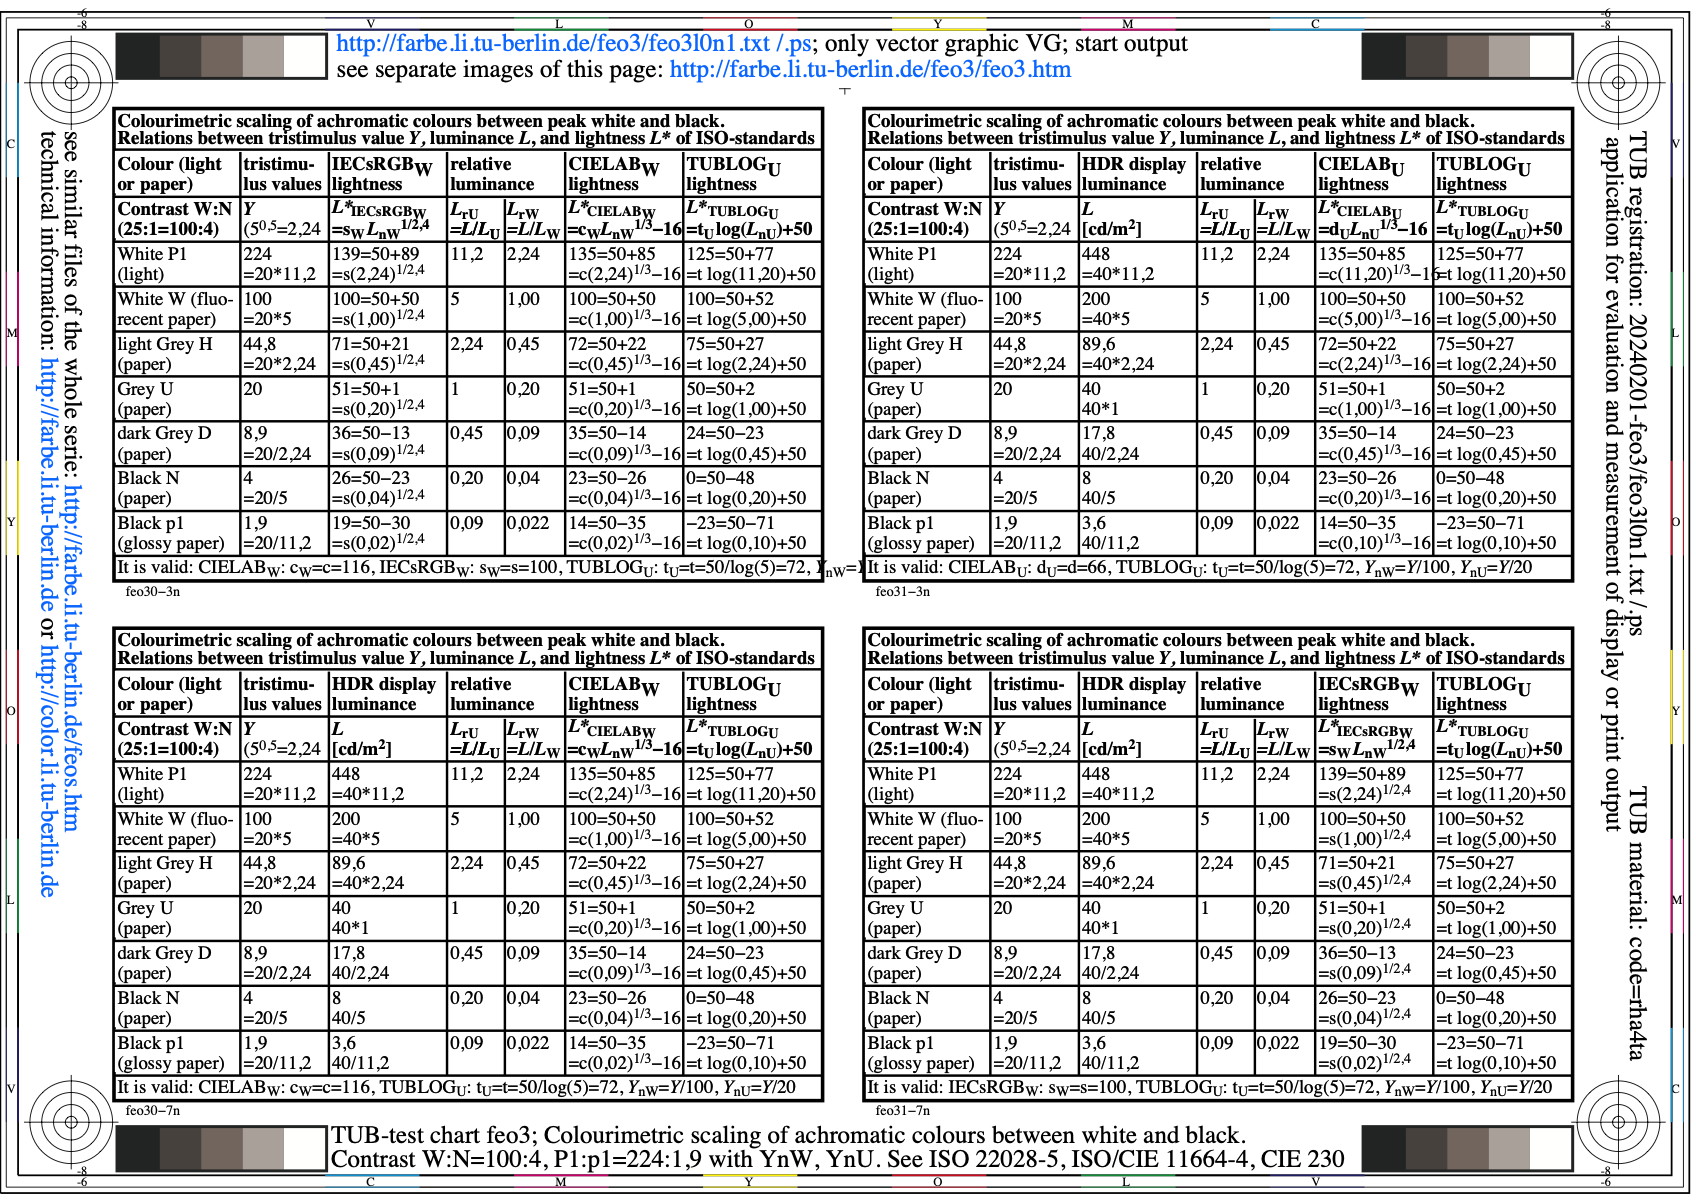
Figure feo3l0n1.jpg: Output in format A6 of the file
feo3l0np.pdf, see
feo3l0n1.
ps /
txt /
pdf /
jpg
feo3: TUB-test chart feo3; Scaling of display colours
achromatic colurs between white W and black N, contrast
W:N=90:3,6, P1:p1=448:3,6 with YnW, YnU, see ISO 22028-5

Figure feo4l0n1.jpg: Output in format A6 of the file
feo4l0np.pdf, see
feo4l0n1.
ps /
txt /
pdf /
jpg
feo4: TUB-test chart feo4; Scaling of display colours
achromatic colurs between white W and black N, contrast
W:N=90:3,6, P2:p2=800:4 with LrW, LrU, see ISO 22028-5
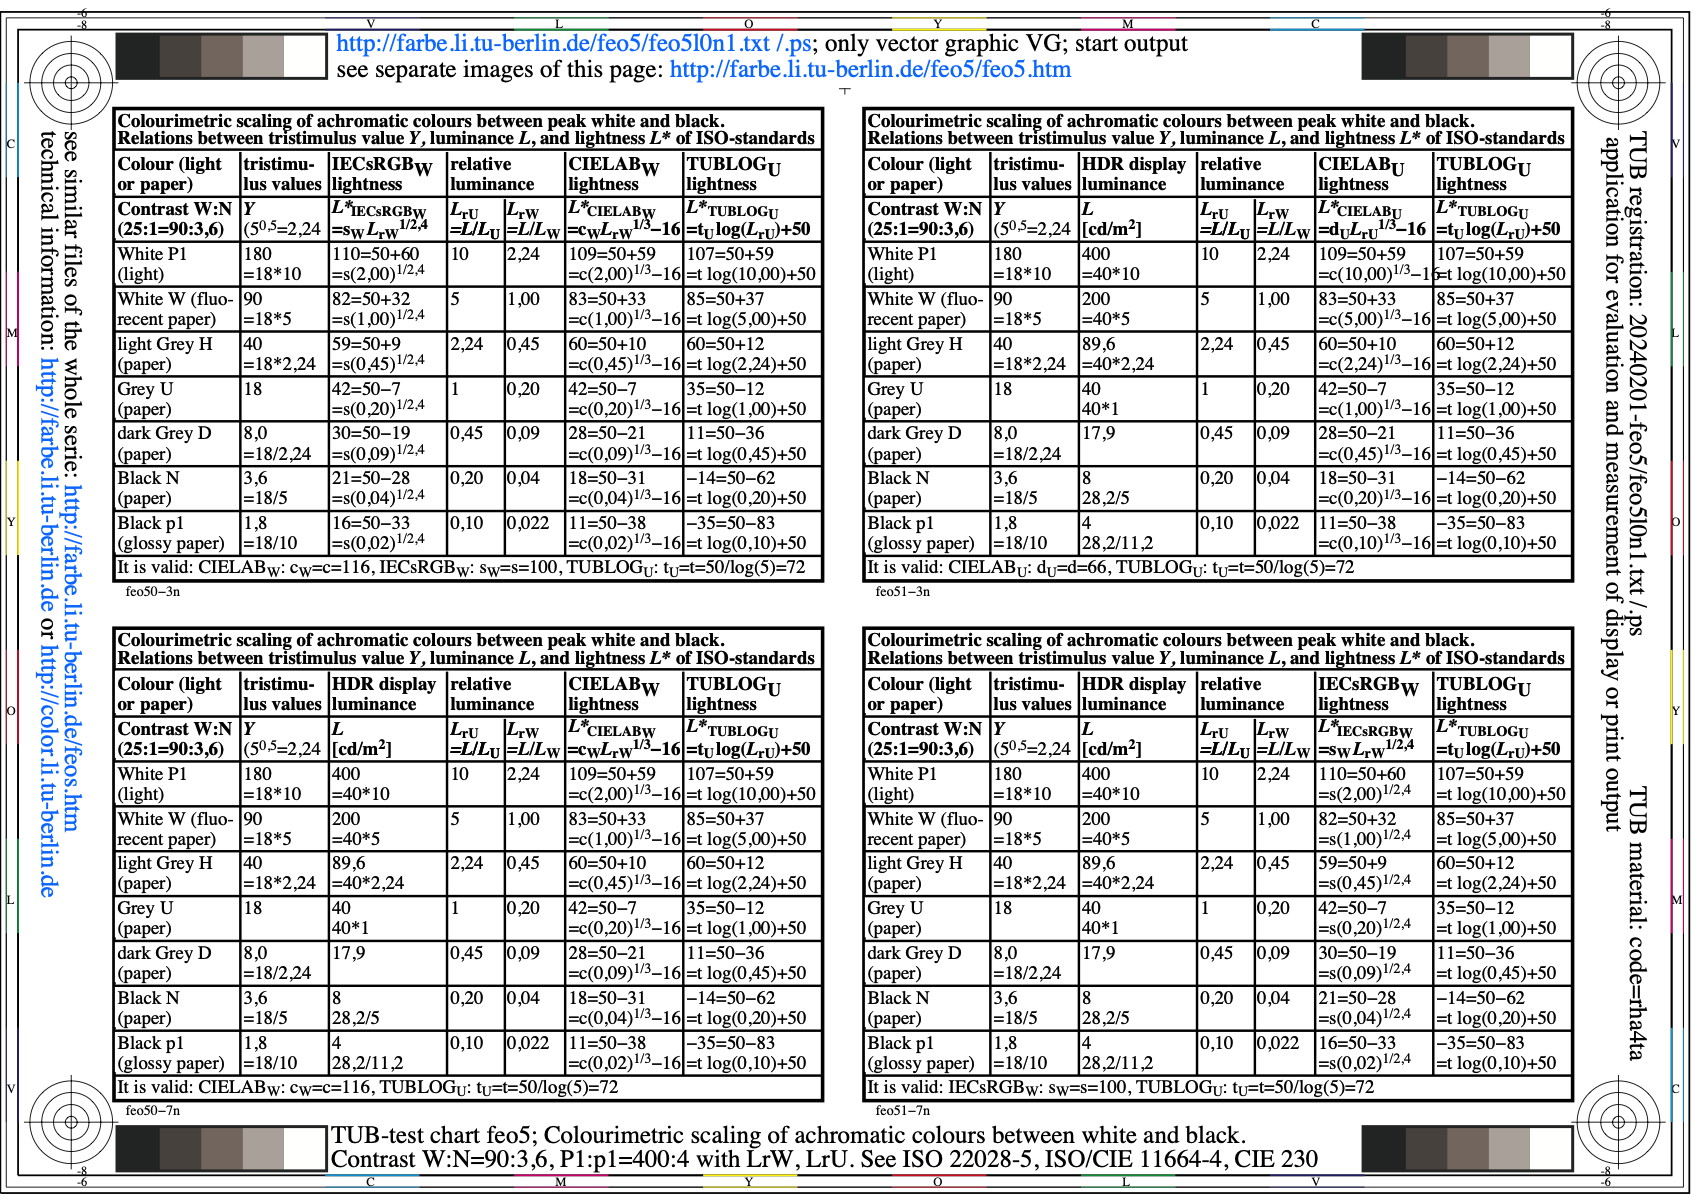
Figure feo5l0n1.jpg: Output in format A6 of the file
feo5l0np.pdf, see
feo5l0n1.
ps /
txt /
pdf /
jpg
feo5: TUB-test chart feo5; Scaling of display colours
achromatic colurs between white W and black N, contrast
W:N=90:3.6, P1:p1=400:4 with LrW, LrU, see ISO 22028-5

Figure feo6l0n1.jpg: Output in format A6 of the file
feo6l0np.pdf, see
feo6l0n1.
ps /
txt /
pdf /
jpg
feo6: TUB-test chart feo6; Scaling of display colours
achromatic colurs between white W and black N, contrast
W:N=90:3,6, P2:p2=1000:4 with LrW, LrU, see ISO 22028-5

Figure feo7l0n1.jpg: Output in format A6 of the file
feo7l0np.pdf, see
feo7l0n1.
ps /
txt /
pdf /
jpg
feo7: TUB-test chart feo7; Scaling of display colours
achromatic colurs between white W and black N, contrast
W:N=100:4, P2:p2=448:3,6 with LrW, LrU, see ISO 22028-5
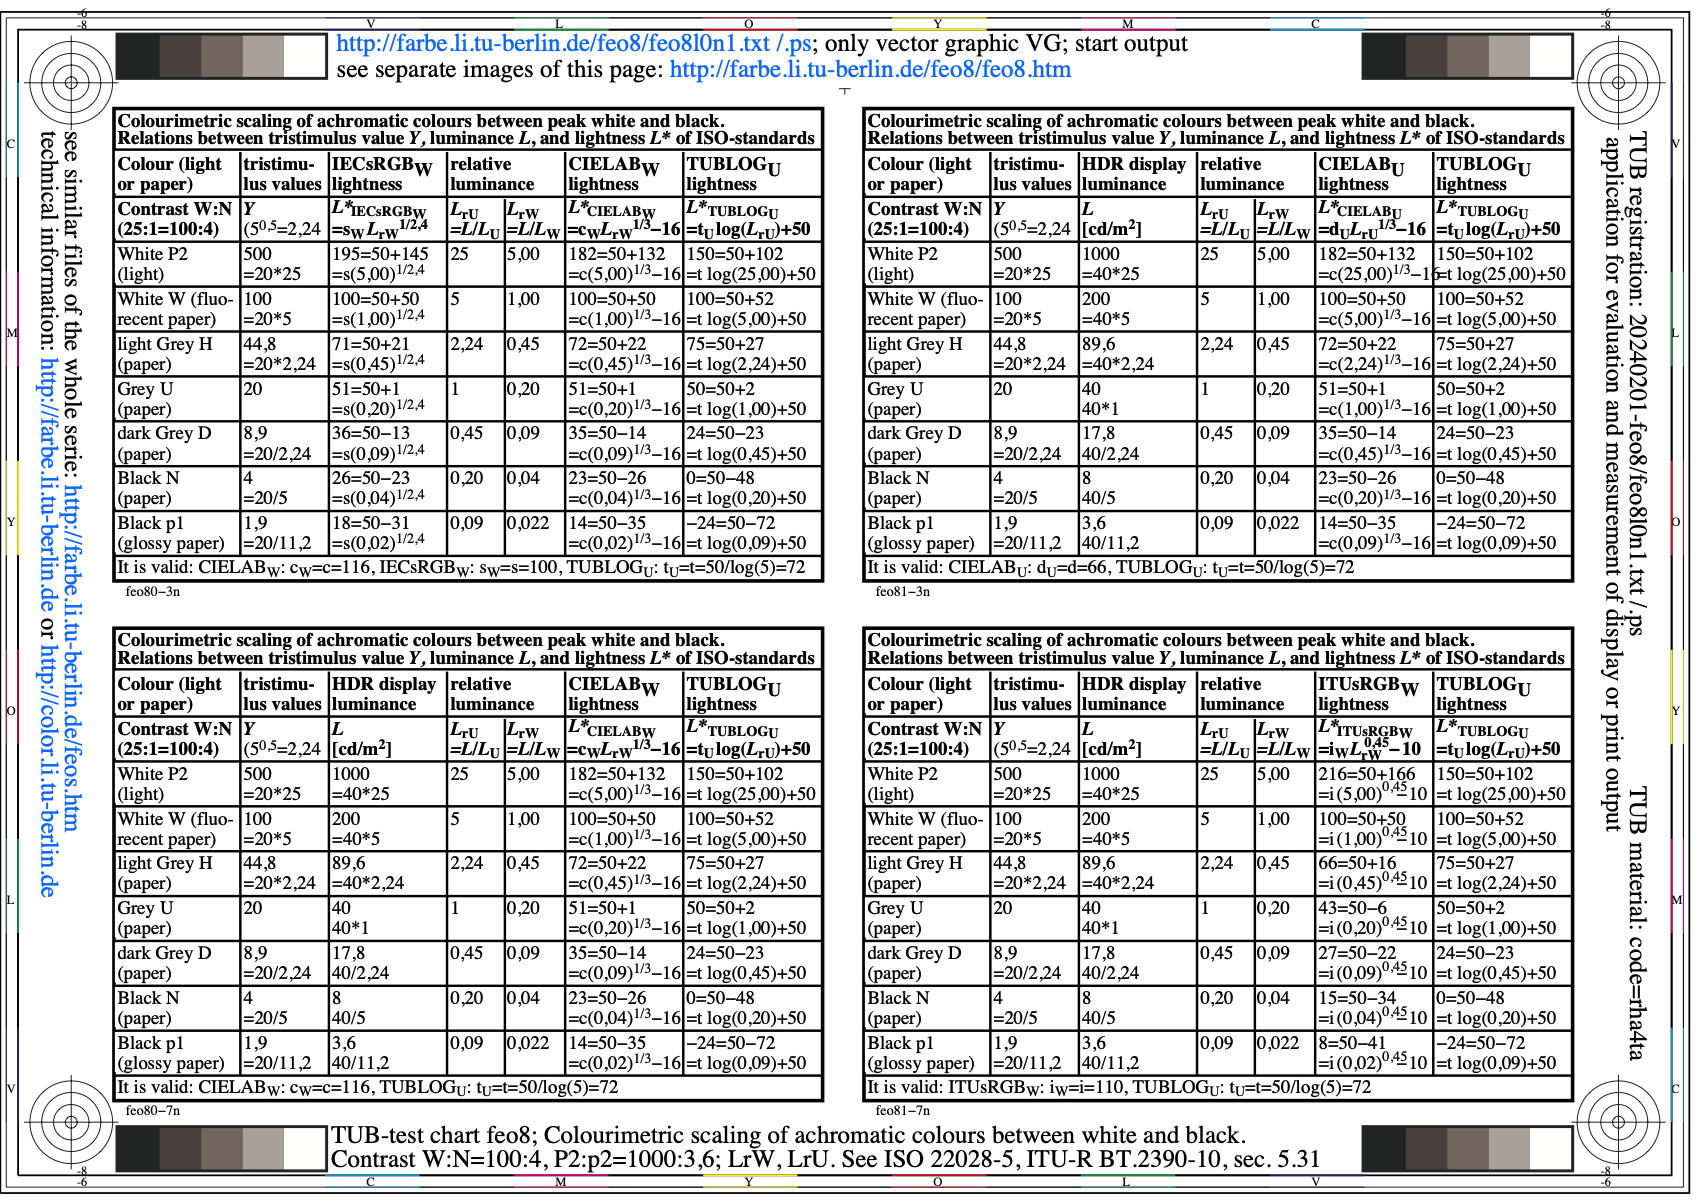
Figure feo8l0n1.jpg: Output in format A6 of the file
feo8l0np.pdf, see
feo8l0n1.
ps /
txt /
pdf /
jpg
feo8: TUB-test chart feo8; Scaling of display colours
achromatic colurs between white W and black N, contrast
W:N=100:4, P2:p2=1000:3,6, LrW, LrU, see ITU-R BT.2390-10, 5.31

Figure feo9l0n1.jpg: Output in format A6 of the file
feo9l0np.pdf, see
feo9l0n1.
ps /
txt /
pdf /
jpg
feo9: TUB-test chart feo9; Scaling of display colours
achromatic colurs between white W and black N, contrast
W:N=100:4, P2:p2=1000:3,6, LrW, LrU, see ITU-R BT.2390-10, 5.31
-------
For the archive information (2000-2009) of the BAM server "www.ps.bam.de"
(2000-2018)
about colour test charts, colorimetric calculations,
standards, and publications, see
indexAE.html in English,
indexAG.html in German.
Back to the main page of this TUB web site (NOT archive), see
index.html in English,
indexDE.html in German.