In my view there may several other conflicts with the results of CIE TC1-81. CIEDE2000 is the only CIE formula intended to describe colour differences of adjacent colours. However, CIEDE2000 has no colour space, and CIELAB is intended for separate colour samples.
In the scope range 0 <= dE*CIELAB <=2 the colour difference formula LABJND gives the best performance for 5 out of the 8 CIE datasets, see Table 9 and 11 in CIE 230. In one out of the eight cases the best performance was reached for CIELAB, CIEDE2000 and CMC. Therefore the colour difference formula LABJND with a colour space seems an alternate to CIEDE2000 without a colour space. This is expected at least for the scope range 0 <= dE*CIELAB <=2.
In addition the performance of LABJND seems similar and not worse compared to CIEDE2000 for Large Colour Differences (LCD). The performance of 6 datasets for Large Colour Differences (LCD) in the range 5 <= dE*CIELAB < 25, and for 3 datasets for Extrem Large Colour Differences (ELCD) in the range 25 <= dE*CIELAB < 99 has been calculated. The result is given in Fig. 4.17-1.
Summary:
The colour-difference formula LABJND of CIE 230:2019 and new research results for a larger luminance range may be a good starting point for colour-difference equations and colour spaces for a luminance range of about 5 log units including the surface-colour luminance range of about 1,5 log units.
Next steps:
New research results of Ostwald-optimal colours on chromatic adaptation will allow to extend the D65 results to all surrounds between the two CIE standard surrounds D65 and A. In this case the colour temperature changes between 6500K and near 3000 K, see part 4.12.
Physiological and psychophysical data for achromatic colours for the luminance range of about 5 log units compared to 1,5 log units for surface colours allow to extend the above results to achromatic colours for the luminance range of about 5 log units, see part 4.3.
Finally some assumptions about the properties of the Ostwald-optimal colours will allow to build a TUB colour vision model for the luminance range of about 5 log units, see part 4.4
The TUB colour vision model for the luminance range of about 5 log units may improve the colour-difference formula and colour space CIELABa for the surface-colour luminance range. In addition the colour-appearance attributes of the TUB colour-vision model for about 5 log units may be very usefull for image applications in the High Dynamic Range (HDR).
4.12. Colour vision and line elements for achromatic and chromatic colours
For example Schroedinger (1925) and Stiles (1971) have tried to connect experimental result on Just Noticeable Differences (JNDs) and the scaling of colours as function of Y, for example the lightness L*.
Stiles, W.S. (1971), The line elenment in colour theory, A historical review, , in Proceedings of the Helmholtz Memorial Symposium on Color Metrics, AIC/Holland, Soesterberg, see
https://aic-color.org/publications,
go to AIC 1971 to download the paper of Stiles as pdf file.
Stiles describes a general colour scaling function F* as function of the receptor responses. In former times the receptor responses were named by the three colour vision deficiencies Protanop (P), Deuteranop (D), and Tritanop (T). One receptor type is missing for these observers. CIE has named the three receptors LMS instead of PDT. In the next figure therefore LMS with an index PDT is used, see Fig. 4.12-1.
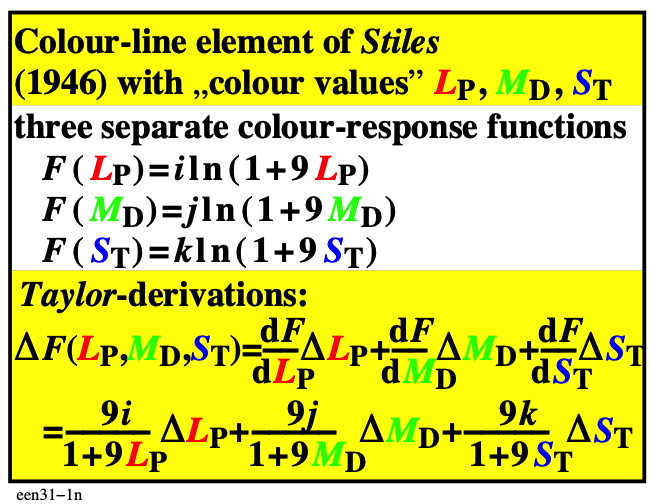
Figure 4.12-1: Line element of colour vision of Stiles connecting thresholds and scaling data
For the download of this figure in the VG-PDF format, see een31-1n.pdf.
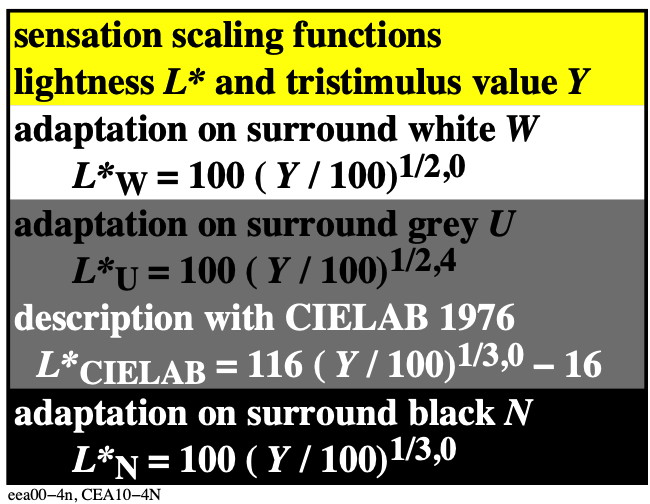
For achromatic colours the threshold (t) difference dYt is a function of the CIE tristimulus value Y, and used in CIE 230:2019. The normalized lightness L*tu compared to the surround (u) is based on the threshold difference dYt, and is called the line element, see Fig. 4.12-2.
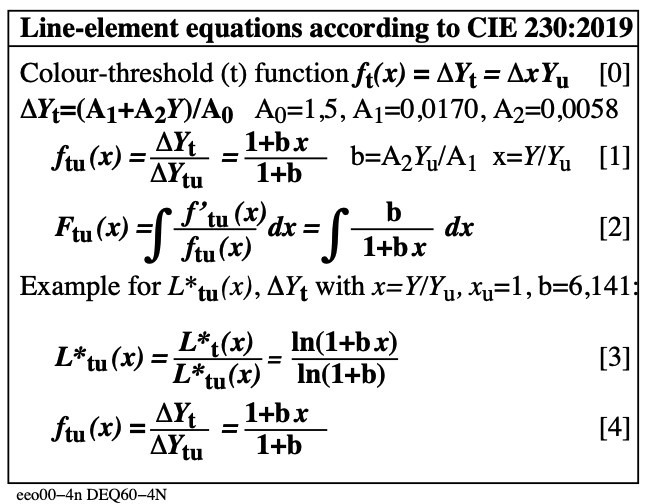
Figure 4.12-2: Line element equations with constants based on experimental data used in CIE 230:2019
For the download of this figure in the VG-PDF format, see eeo00-4n.pdf.
The constants of the line element equations and the experimental data will be described further in the section 4.14. The line element uses for all colours the tristimulus value Y.
For chromatic colours the colour space sRGB according to IEC 91966-2-1 uses for the three primaries three different relative lightness functions. These three lightness functions are called here triangle lightness T*. Instead of Yn = YnW = 100 for white (W) in the CIELAB formula, Fig. 4.12-3 uses the three values YnR = 21, YnG = 72, and YnB = 7.
Figure 4.12-3: sRGB-triangle lightness T* as function of the tristimulus value Y of the three sRGB primaries
For the download of this figure in the VG-PDF format, see eer30-2n.pdf.
For the tristimulus value of white YW the following equation is valid.
YnW = YnR + YnG + YnB = 21 + 72 + 7
If instead of YnW =100 the three values YnR=21, YnG=72, and YnB=7 are included in the lightness equation, then the triangle lightness shifts in to lower Y values on the x-axis, see Fig. 4.12-4.
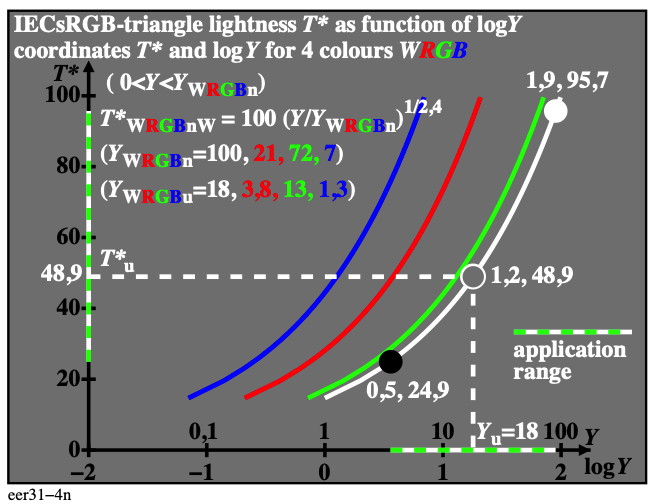
Figure 4.12-4: Triangle lightness T*RGB as function of log Y.
For the download of this figure in the VG-PDF format, see eer31-4n.pdf.
Visually the sRGB output appears equally spaced on displays, if the relative tristimulus values of the three primaries are used to calculate the lightness T*.
According to the ergonomic standard ISO 9241-306:2018 for display-work places, the equally spaced rgb* data between 0 and 1 in the digital file shall produce equally spaced colour series between black N and R G B, and similar between R G B and white W.
For achromatic surface colours the tristimulus value Y=3,6 produces Black N with the lightness L*=24,9 and the tristimulus value Y=90 produces White W with the lightness L*=95,7. The relative achromatic lightness compared to the surround varies between 0,5 and 1,9, compare Fig. 4.12-4.
The question raises how the blue primary looks for the tristimulus value range 1,3 <= Y <= 3,6, which is the tristimulus threshold value YtN for the achromatic black N. At least a larger part below Y <= 3,6 looks blue according to Evans (1974). Therefore the black threshold YtB is below the black threshold YtN.
In addition for the triangle contrast C*RGB shifts on the x-axis, similar as for the triangle lightness T*RGB, see Fig. 4.12-5.
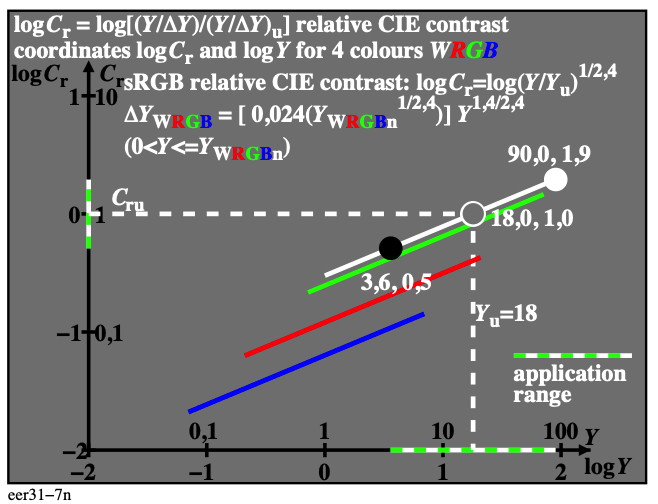
Figure 4.12-5: Triangle contrast C*RGB as function of log Y.
For the download of this figure in the VG-PDF format, see eer31-7n.pdf.
If the CIELAB lightness L* as function of log Y is calculated for the three primaries RGB of the sRGB-colour space the shift of the triangle lightness T* disappears, see Fig. 4.12-6.
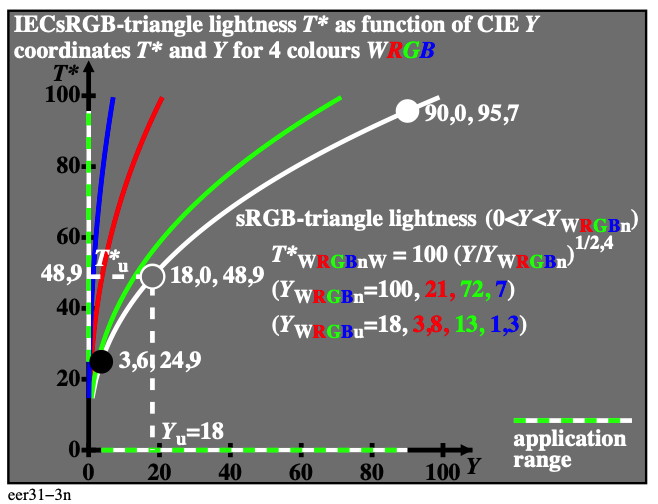
Bild 4.12-6: CIELAB lightness L* as function of log Y for the three primaries of the sRGB-colour space.
For the download of this figure in the VG-PDF format, see eer31-3n.pdf.
For the colour scales between black N and W, G, R, or B the CIELAB lightness L* produces different ranges on top of each other. The range for the primary B defines the darkest range and the primary G the lightest range which is darker compared to the achromatic range W.
At display work places the reflection of the ambient light changes all colours by a mixture with the achromatic reflection W. For example the 4% standard reflection compared to the white display reduces the colour gamut to about 70%, see ISO CEN DIN 9241-306:2018/9.
The three primaries RGB of the sRGB-colour space have complementary colours CMY. Without and with ambient reflection the six colours RYGCBM and white will be compared with similar optimal colours RYGCBM of the antagonistic Ostwald optimal colours in the next chanpter 4.2.
The Ostwald-optimal colours (o) have special properties. For example for chromatic adaptation to the colour temperatures between 6500K and 3000K there is approximately no change of their tristimulus values Yo, their chromatic values CAB,2,o and their hue angles hAB,2,o. This property is called colour constanty. The definition and more properties of the Ostwald-optimal colours will be described in the next chapter 4.2.
4.13. The Just Noticeable Difference (JND) in the colour-difference formula LABJND of CIE 230:2019.
The Just Noticeable Difference (JND) has been vsually determined by six observers for two adjacent samples in a grey surround with a white border, see Fig. 4.13-1.
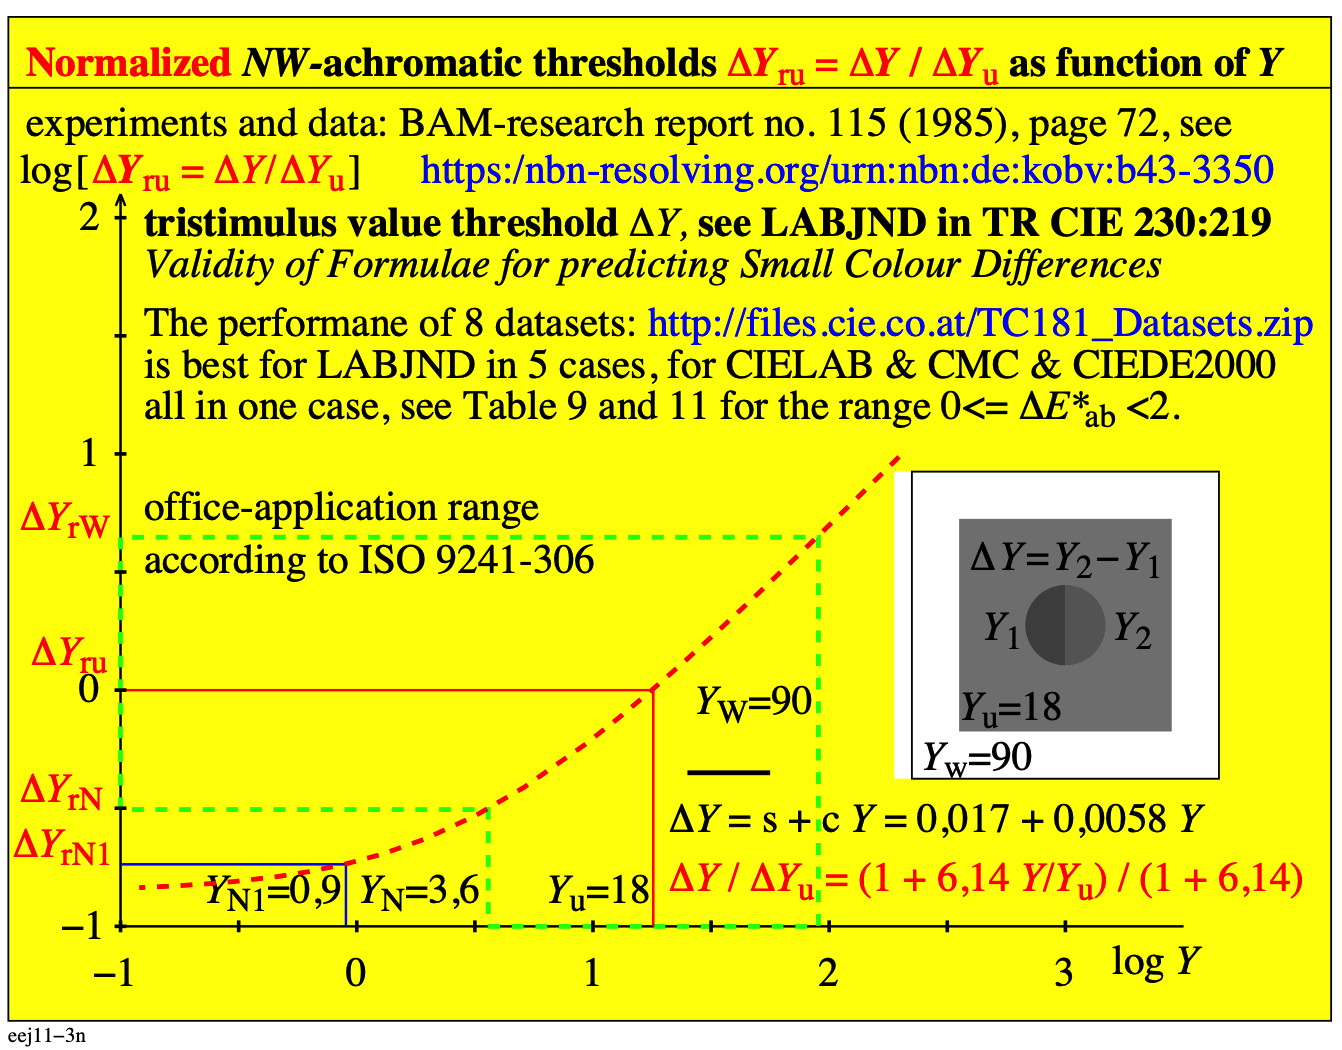
Figure 4.13-1: Experimental viewing condition for Just Noticeable Differences (JNDs) and linear equation for approximation of the experimental results.
For the download of this figure in the VG-PDF format, see eej11-3n.pdf.
The figure shows a linear equation between dY and Y to approximate the experimental BAM results. If A1 is at the beginning, then the constant c in the figure changes to A2, if the tristimulus value Y is used. The constant c changes to A2u, if the relative tristimulus value Y/Yu is used, see Fig. 4.12-2.
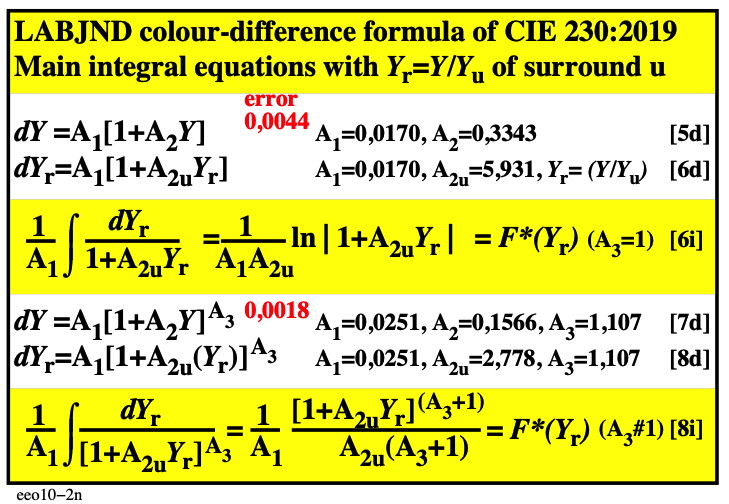
Figure 4.13-2: Linear and nonlinear equations to approximate threshold results, and to calculate the line element lightness.
For the download of this figure in the VG-PDF format, see eeo10-2n.pdf.
Equations [5d] and [6d] are linear equations. Equations [7d] and [8d] are potential (nonlinear) equations. A value for the least square error is given. The accuracy for the potential approximation is higher. In both cases the calculation of a line element is possible by integration. One can expect an increase of the accuracy by a factor 2,5 by the potential approximation in equation [8i] compared to the linear equation in equation [6i].
One must consider that the luminance range of surface colours is only 1,5 log units compared to the about 5 units of the HDR luminance range. In chapter 3 we will use exponential (nonlinear) approximations to describe physiological and psychophysical experimental data for the HDR luminance range. For example the accuracy of the potential approximation is still limited for the HDR range.
4.14. Line element for connection of the colour-difference formula TUBJNDa and the colour space TUBLABa
A linear and potential line element connection between TUBJNDa and TUBLABa is given in the last Fig. 4.13-2. In both cases the constant A1 will be obsolete, if the relative lightness compared to the lightness of the surround is used. For the linear version, see Fig. 4.14-1.
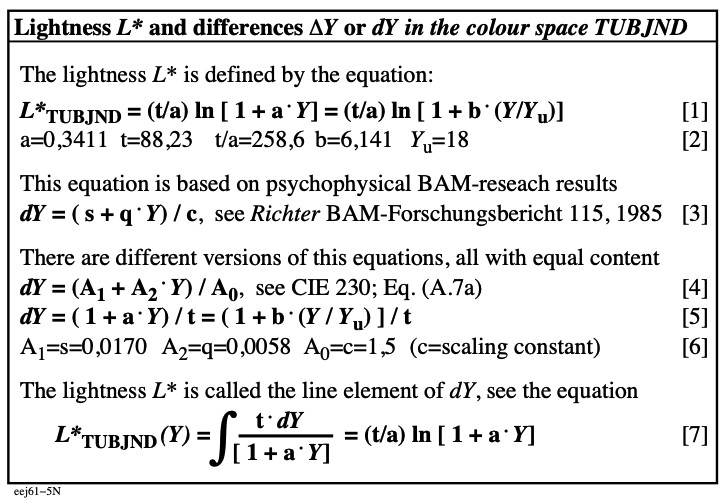
Figure 4.14-1: Linear colour-difference formula TUBJNDa and the colour space TUBLABa
For the download of this figure in the VG-PDF format, see eej61-5n.pdf.
In addition the constant A1 will be obsolet, if the relative threshold and the relative contrast compared to the surround is used.
For comparison of experimental results usually the relative values are necessary. Then the results are independent of different scaling factors which are usually used in different experiments. This allows to compare different results, for example for viewing of adjacent (a) colours in the colour space LABJNDa, and for viewing of separate (s) colours in the colours space CIELABs.
The experimental data of the BAM-results are shown for the relative
1. lightness L*/L*u,
2. tristimulus value difference at threshold dY/dYu,
3. sensitivity (dY/Y)/(dY/Y)u, and
4. contrast (Y/dY)/(Y/dY)u
on a linear ordinate scale, see Fig. 4.14-2.
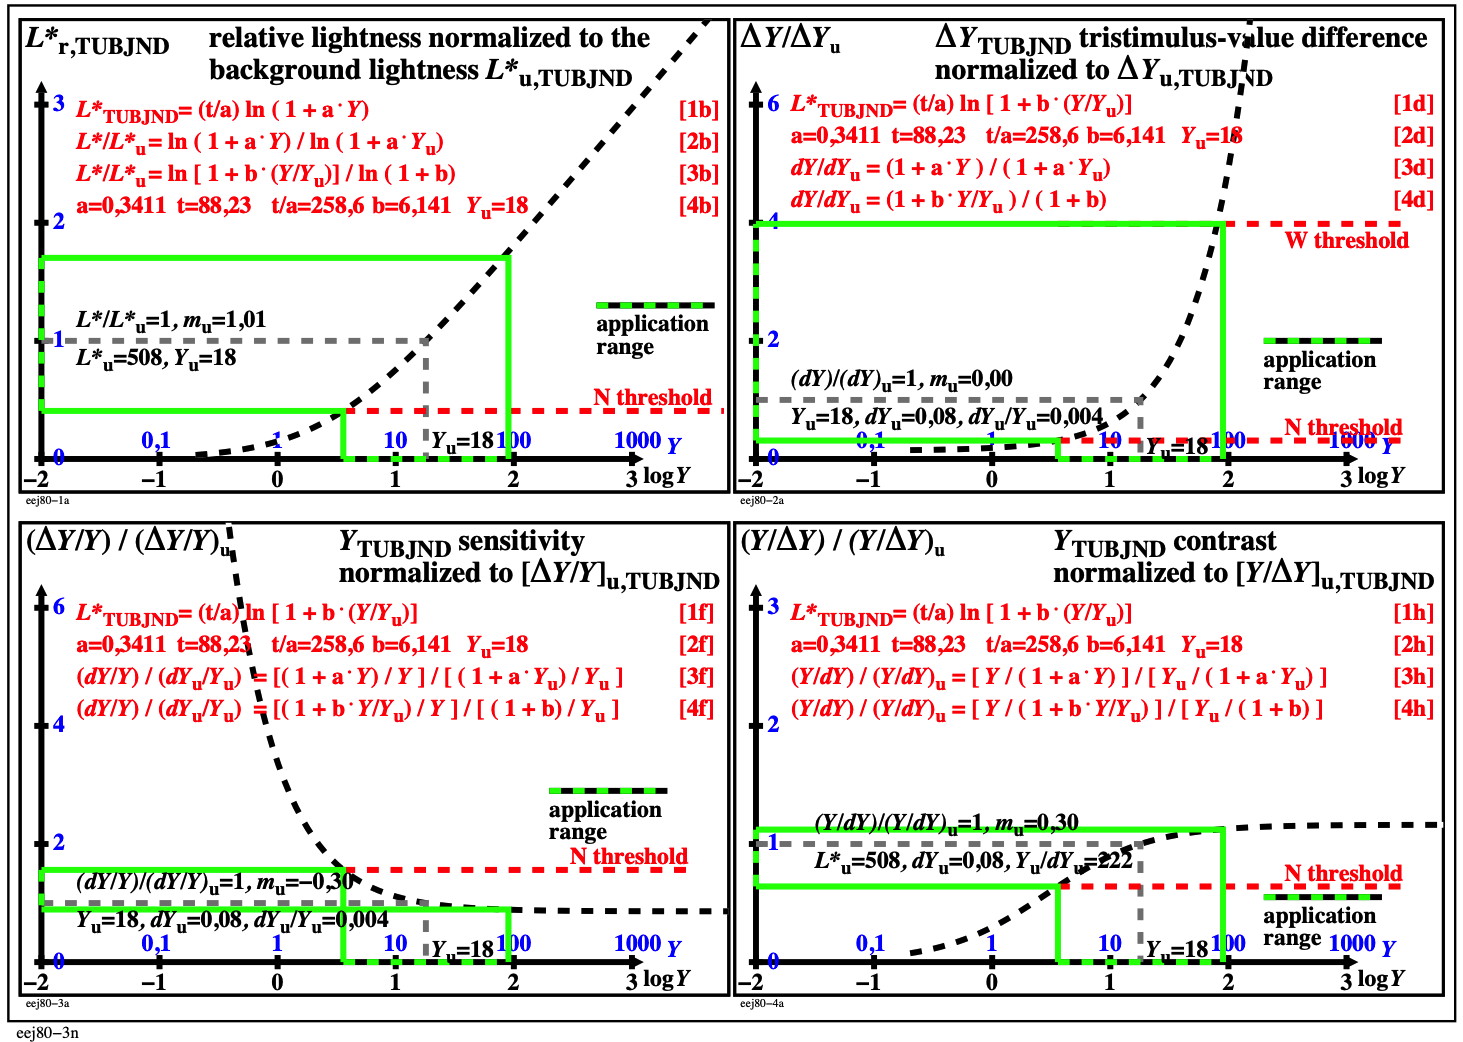
Figure 4.14-2: Normalized functions L*/L*u, dY/dYu, (dY/Y)/(dY/Y)u, and (Y/dY)/(Y/dY)u as function of Y for TUBJNDa
For the download of this figure in the VG-PDF format, see eej80-3n.pdf.
The experimental data of the BAM-results are shown for the relative
1. lightness L*/L*u,
2. tristimulus value difference at threshold dY/dYu,
3. sensitivity (dY/Y)/(dY/Y)u, and
4. contrast (Y/dY)/(Y/dY)u
on a log ordinate scale Fig. 4.14-3.
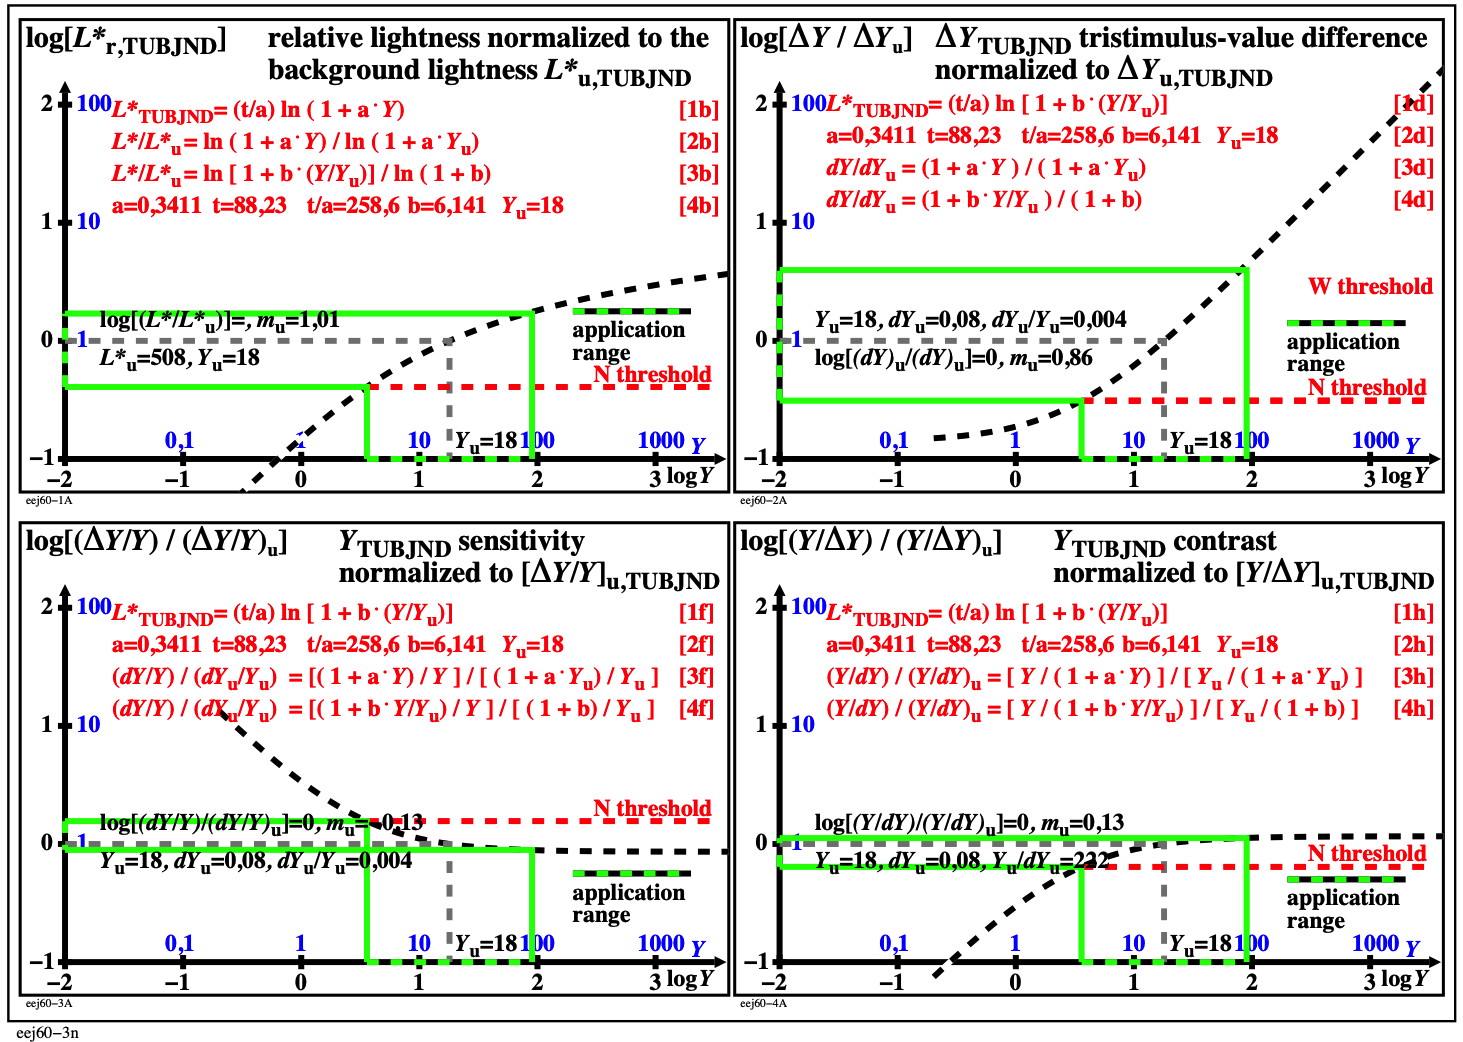
Figure 4.14-3: Normalized functions log[L*/L*u, dY/dYu, (dY/Y)/(dY/Y)u, and (Y/dY)/(Y/dY)u] as function of logY for TUBJNDa
For the download of this figure in the VG-PDF format, see eej60-3n.pdf.
On a log scale the nonlinear dependance of some of the four relative values may show a linear part in the figure, see for example the contrast for Y > Yu.
4.15. The colour space and colour difference formula CIELABs for separated (s) colours.
In the following the relative values are calculated from the CIELAB colour space and the CIELAB colour difference formula according to ISO/CIE 11664-4?. The scaling constant k=116 or ku=65,50 will be obsolete, if the relative lightness compared to the lightness of the surround is used, see Fig. 4.15-1.
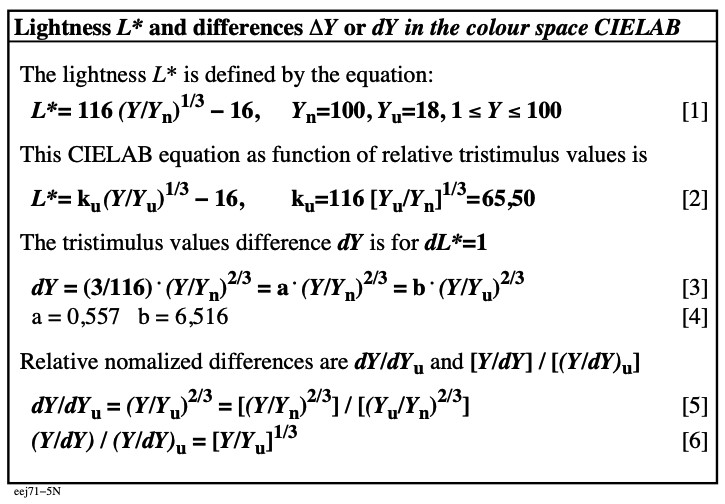
Figure 4.15-1: Potential colour-difference formula CIELABs and potential colour space formula CIELABs
For the download of this figure in the VG-PDF format, see eej71-5n.pdf.
The experimental data of Nickerson (1942) have been used to define the CIELAB system. The figure shows the relative:
1. lightness L*/L*u,
2. tristimulus value difference at threshold dY/dYu,
3. sensitivity (dY/Y)/(dY/Y)u, and
4. contrast (Y/dY)/(Y/dY)u
on a linear ordinate scale see Fig. 4.15-2.
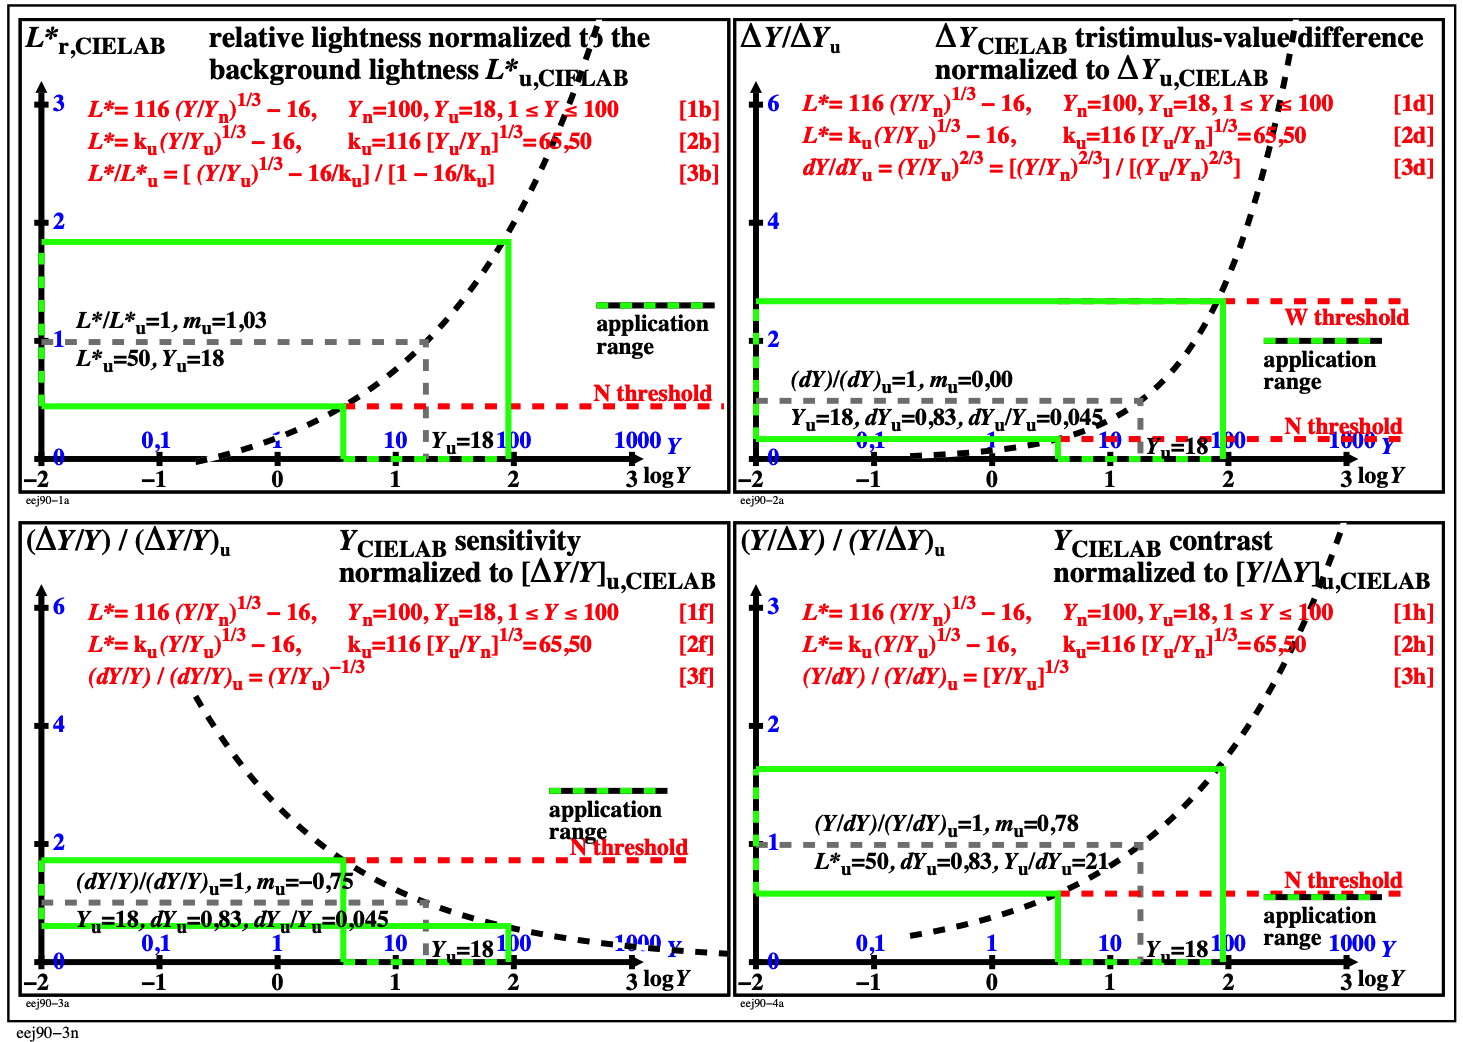
Figure 4.15-2: Normalized functions L*/L*u, dY/dYu, (dY/Y)/(dY/Y)u, and (Y/dY)/(Y/dY)u as function of logY for CIELAB
For the download of this figure in the VG-PDF format, see eej90-3n.pdf.
The experimental data of Nickerson (1942) have been used to define the CIELAB system. The figure shows the relative:
1. lightness L*/L*u,
2. tristimulus value difference at threshold dY/dYu,
3. sensitivity (dY/Y)/(dY/Y)u, and
4. contrast (Y/dY)/(Y/dY)u
on a log ordinate scale, see Fig. 4.15-3.
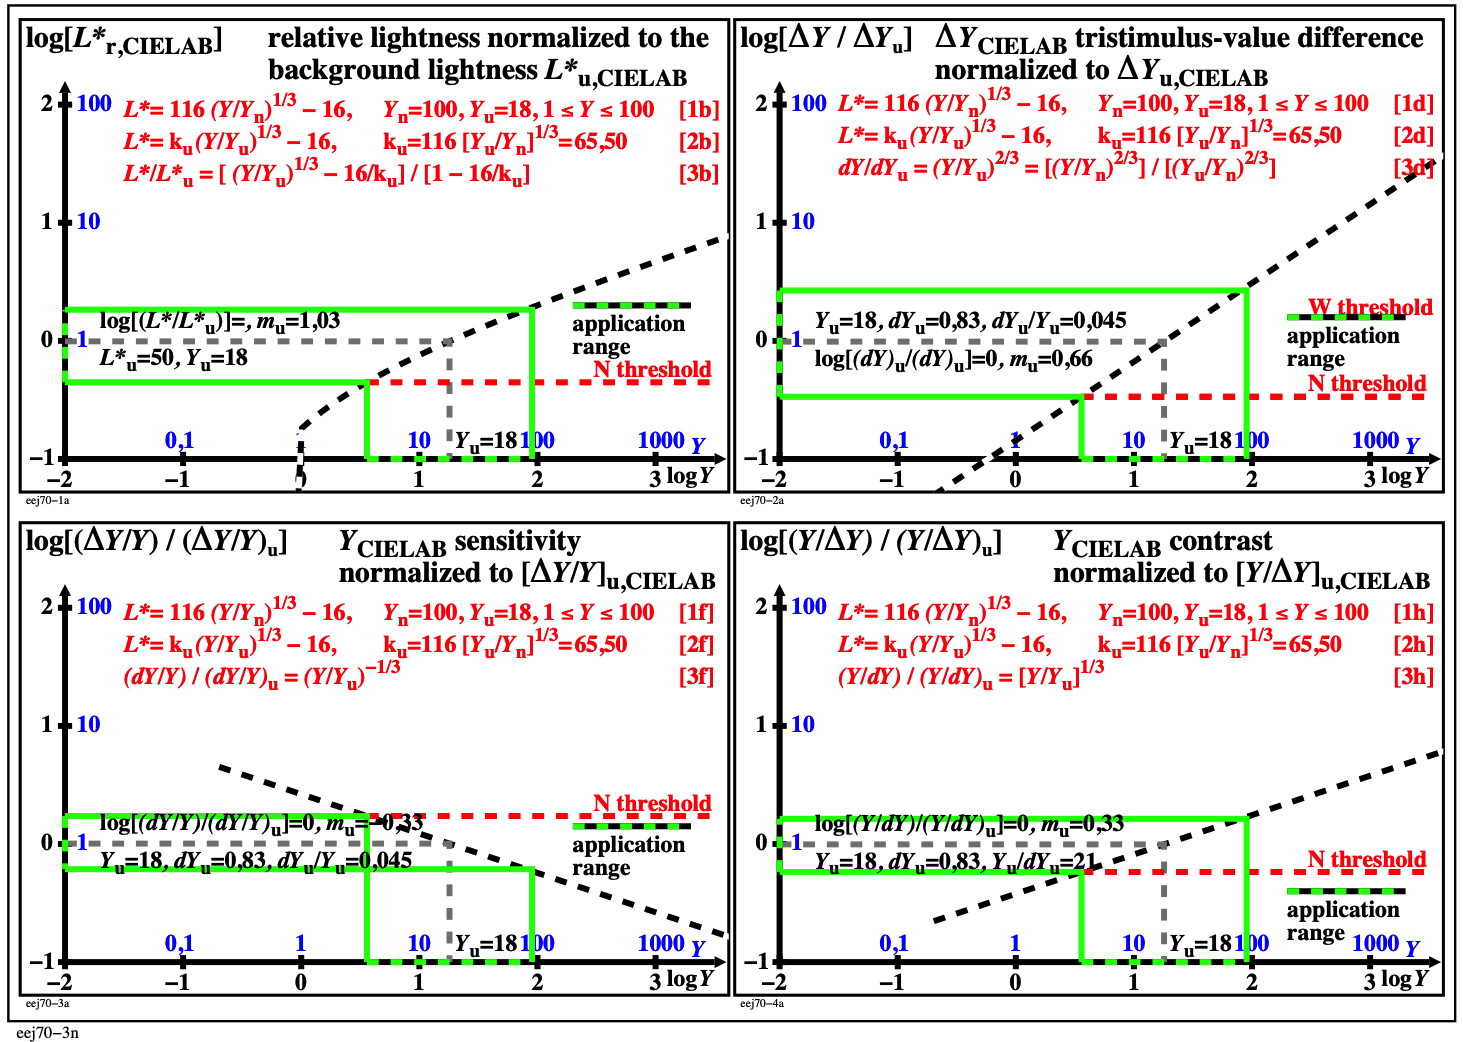
Figure 4.15-3: Normalized functions log[L*/L*u, dY/dYu, (dY/Y)/(dY/Y)u, and (Y/dY)/(Y/dY)u] as function of logY for CIELAB
For the download of this figure in the VG-PDF format, see eej70-3n.pdf.
On a log scale the nonlinear dependance of some of the four relative values may show a linear part in the log-log figure, see for example the contrast for all Y values.
The log ordinate of Figure 4.15-3 is more of theoretical value. One must consider that only the linear ordinate in Fig. 4.15-2 relates to visual properties in applications.
4.16. Colour difference formula CIEDE2000a, TUBJNDa for adjacent colours without and with a colour space, and comparison with CIELABa
CIEDE2000 is a colour-difference formula and has no colour space. Therefore the color space coordinate lightness is not defined. There is a larger complexity with two separate parts of the CIEDE2000 formula. The colour difference formula includes the lightness difference dL* and L* of CIELAB, and not the tristimulus value difference dY.
dL*CIEDE2000 = 1 + [0,015 (L*CIELAB - 50)^2] / [20 + (L*CIELAB - 50)^2]^(1/2)
Therefore, it seems not possible to develop a mathematical formula for the lightness of CIEDE2000 by integration. However, by numerical approximation of the dY data of CIEDE2000 as a function of Y, a CIEDE2000 lightness and contrast approximation may be possible, for example by a potential function similar compared to the dYdata of LABJND. This is not done here for lightness. However, in any case the two parts for lightness below and above L*CIELAB = 50 will remain.
For the comparison of the lightness L* and the contrast C between LABJND with CIELAB, and LABJND with CIEDE2000, see Fig. 4.16-1.
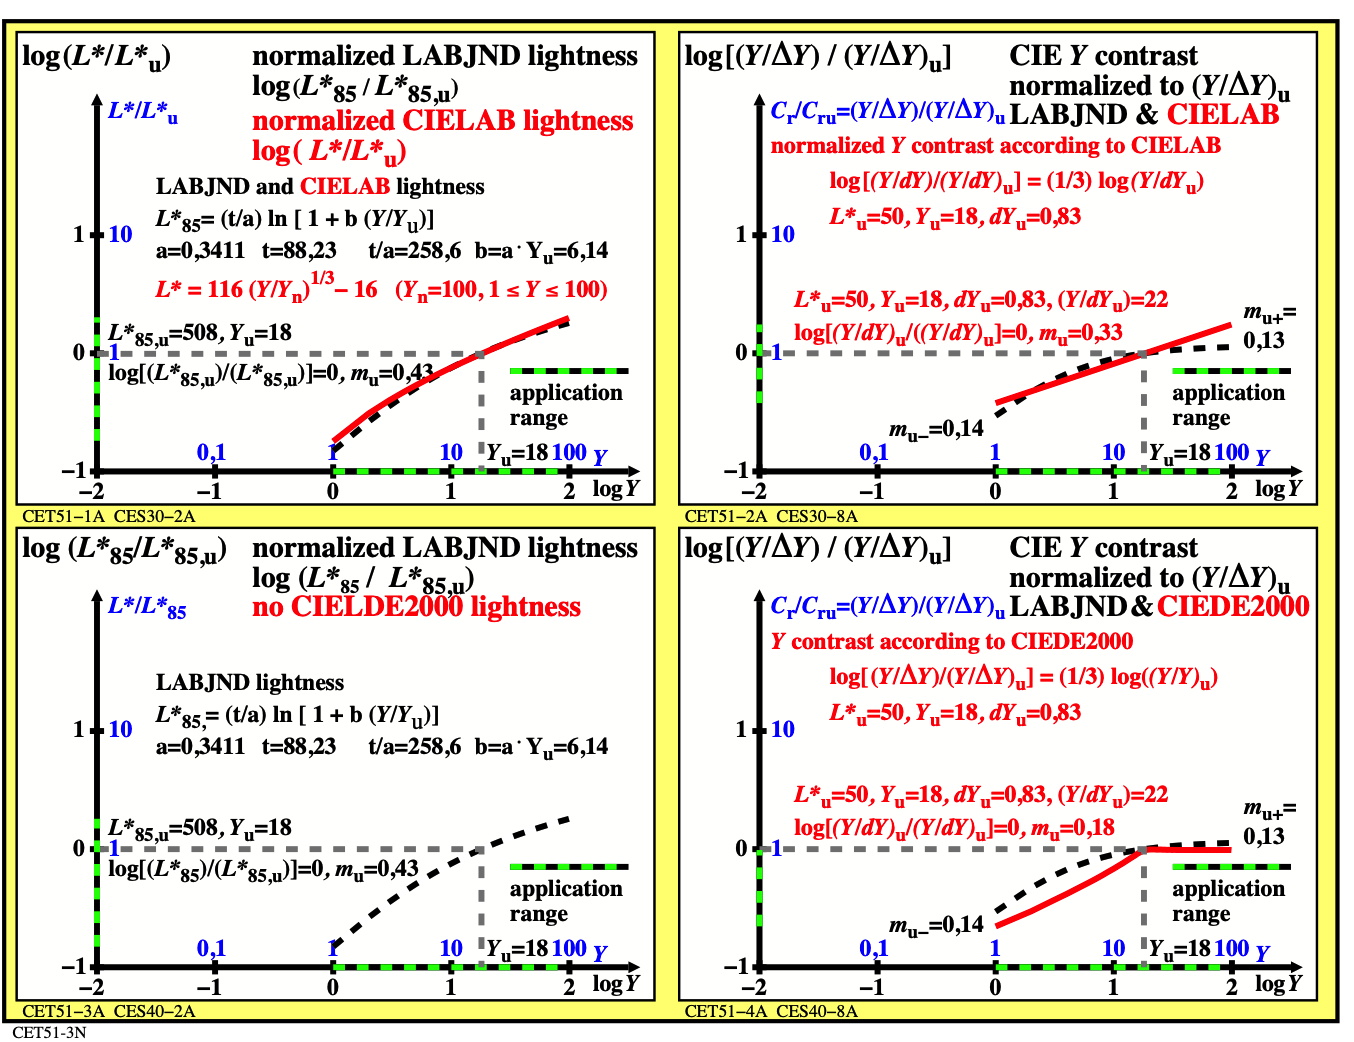
Figure 4.16-1: Normalized functions log[L*/L*u, and C/Cu = (Y/dY)/(Y/dY)u] as function of logY for LABJND & CIELAB, and for LABJND & CIEDE2000.
For the download of this figure in the VG-PDF format, see CET51-3N.PDF.
The comparison of the contrast shows similarities for LABJND and CIEDE2000 for all lighter colours compared to the grey surround.
However, the differences are larger on a linear ordinate scale, which corresponds to the visual evaluation. For the relative lightness L*/L*u of CIELAB and LABJND compared to the surround (u), see Fig. 4.16-2.
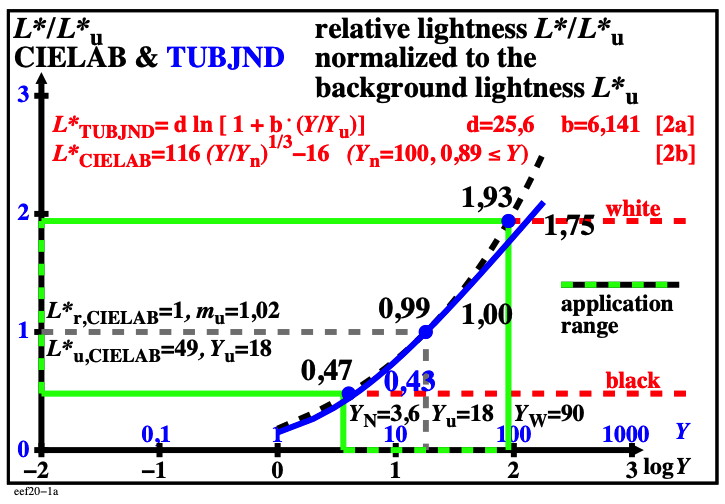
Figure 4.16-2: Relative lightness L*/L*u for CIELAB and LABJND as function of log Y.
For the download of this figure in the VG-PDF format, see eef20-1a.pdf.
The value of the relative lightness has the value one for both CIELAB and LABJND. The equal slope at the surround for the lightness difference is expected. If the darker sample has the luminance of the surround, then only one sample is viewed. This is the case separate sample of CIELAB. In this viewing situations the case separate (CIELAB) and adjacent (LABJND) sample is identical and therefore the same slope is expected, see Fig. 4.16-3.
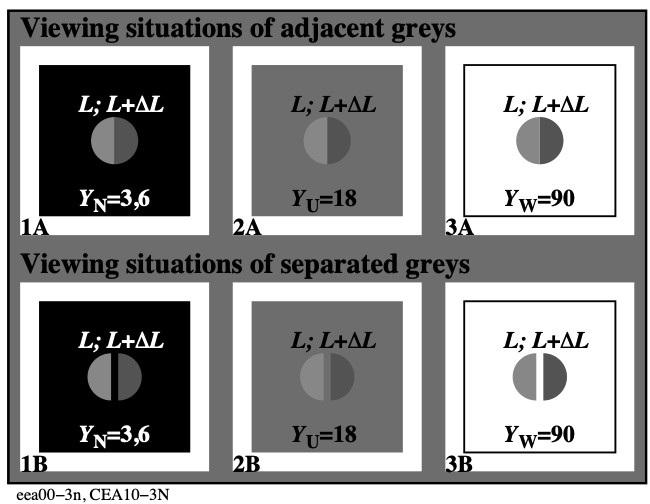
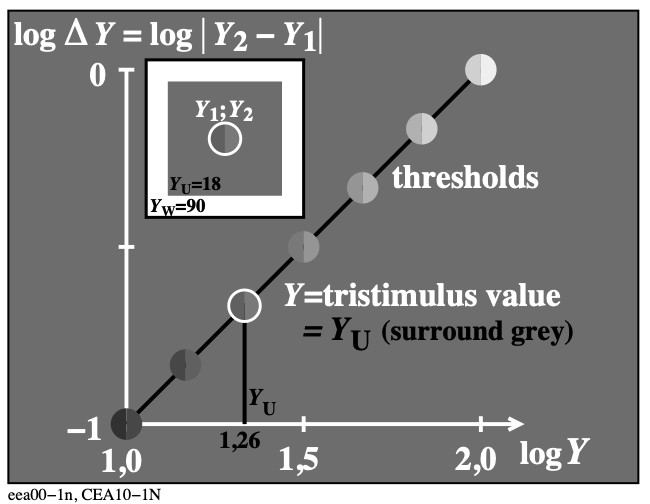
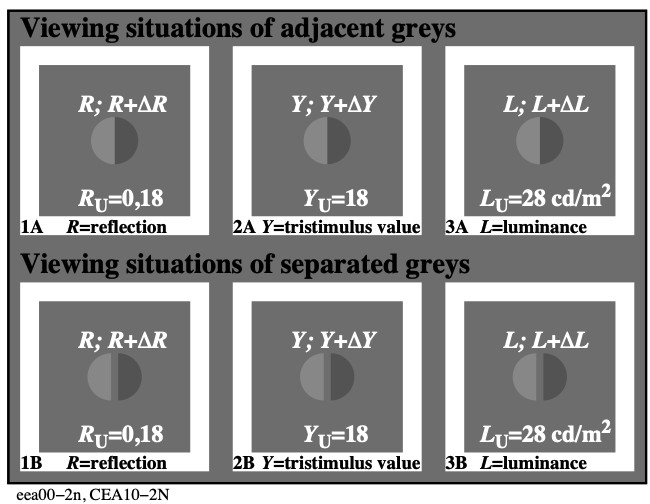
Figure 4.16-3: Colorimetric description of the samples and the surround by the reflection factor R, the tristimulus value Y or the luminance L.
For the download of this figure in the VG-PDF format, see eea00-3n.pdf.
However in the viewing situations adjacent of Fig. 4.16-3, the lightness in Fig. 4.16-2 is smaller for LABJND compared to the separate samples of CIELAB. However, the difference dY for equal lightness differences dL*/dL*u is larger for the adjacent samples of LABJND compared to the separate samples of CIELAB.
For the relative contrast C*/C*u compared to the surround for CIELAB and LABJND, see Fig. 4.16-4.
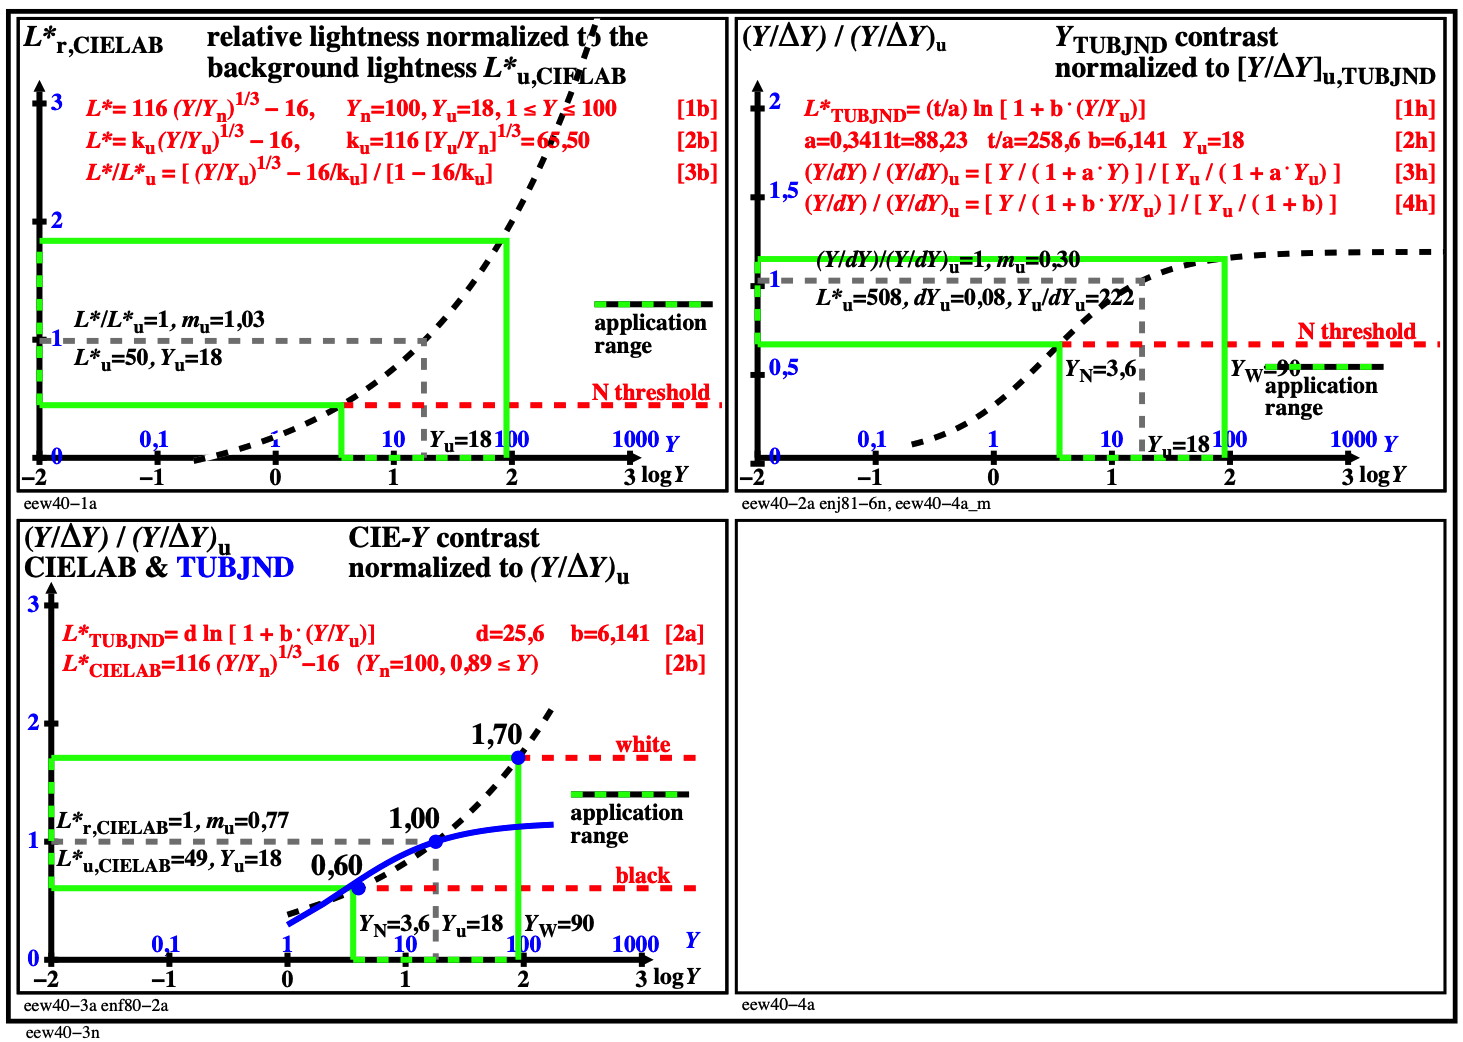
Figure 4.16-4: Relative contrast C/Cu = (Y/dY)/(Y/dY)u as function of logY for CIELAB and LABJND. Also a direct comparison is shown.
For the download of thie three figures in the VG-PDF format, see eew40-3n.pdf
The log ordinate of Figure 4.16-4 is more of theoretical value (still missing). One must consider that only the linear ordinate in this Figure relates to visual properties in applications.
A reason or explanation for the large contrast difference between CIELAB and LABJND is unknown. The vieving of separate samples according to CIELAB and the adjacent samples of LABJND may be the reason as shown in the dissertation of Kittelmann 2011.
Both LABJND and CIEDE2000 are based on viewing of adjacent samples. Therefore LABJND and CIEDE2000 may produce the more similar contrast, at least for all samples lighter compared to the surround Yu, see Fig. 4.16-5.
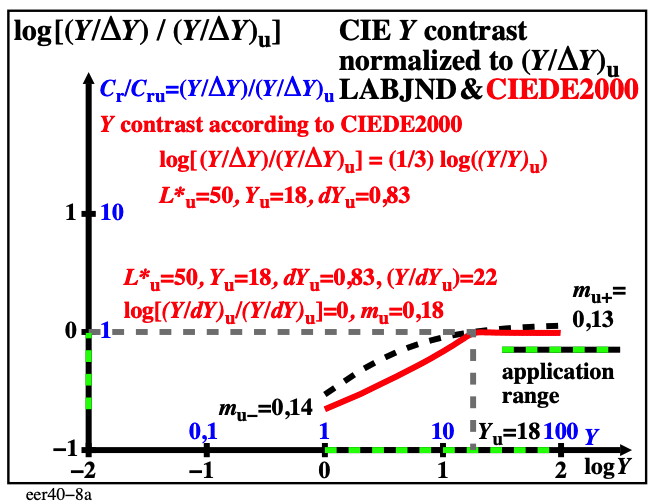

Figure 4.16-5: Relative contrast C/Cu = (Y/dY)/(Y/dY)u as function of logY for CIEDE2000 and LABJND.
For the download of the two figures in the VG-PDF format, see eer40-8a.pdf and eer50-8a.pdf.
Figure 4.16-5 shows the LABJND contrast for the linear approximation of the experimental BAM data. If the potential approximation of the experimental BAM data is used, then a negative slope appears for all Y values larger Yu. This is similar for CIEDE2000 in this range and very different compared to CIELAB.
4.17. Uniform metric for large colour differences for both adjacent and separated colours
For this topic the following references may be important:
Richter, Klaus (1985), The colour-perception attribute elementary hue, and chroma differences as function of chromaticity and luminance of center and surround field (german title: Farbempfindungsmerkmal Elementarbuntton und Buntheitsabstände als Funktion von Farbart und Leuchtdichte von In- und Umfeld).
Forschungsbericht 115, Bundesanstalt für Materialforschung und -prüfung (BAM), (Research report 115, Federal Institute for Material Research and Testing (BAM)), 1985, 119 pages, 87 figures, 50 tables, 184 MB, ISSN 0938-5533, ISBN 3-88314-420-7, "Open Access" since 2015, see
https://nbn-resolving.org/urn:nbn:de:kobv:b43-3350
Luo M.R., G. Cui, and B. Rigg (2001), The development of the CIE colour-difference formula: CIEDE2000. Color Research and Application 26: 340-350.
Richter, K. (2006), Relation of Weber law and Stevens law at achromatic threshold, (11 pages, 200 kByte), see A/BAMAT.PDF
ISO/CIE 11664-6:2022 Colorimetry - Part 6: CIEDE2000 Colour-Difference Formula.
CIE 230:2019, Validity of formulae for prediction small colour differences
Remarks:
CIE 230 has been developed by CIE TC1-81 with the chairman: Klaus Richter, see for a summary at
http://www.cie.co.at/publications/validity-formulae-predicting-small-colour-differences .
CIE 230 has used CIE datasets with about 7000 pairs of adjacent colour samples from different countries, see
http://files.cie.co.at/TC181_Datasets.zip.
The files are provided in three different formats: .TXT (text), .PS (PostScript), and .PDF (Portable Document).
CIE 230 has studied the validity of five colour difference formulae. For example the performance of the formula LABJND 1985 for adjacent colours is compared with the formula CIELAB for separate colours on a grey background. LABJND uses the logarithmic Weber-Fechner law, and CIELAB the cube root Stevens law.
For example out of 8 CIE datasets, and for the intended colour differences < 2 CIELAB of CIE 230, the formula LABJND_PF performs best in 5 cases, and CIEDE2000_PF in 1 case. For example out of 13 (all) CIE datasets, and for the colour differences < 5 CIELAB, the formula CIEDE2000_PF performs best in 6, and LABJND_PF in 5 cases. CIELAB is best in 1 case, see section "7 Conclusions" of CIE 230. According to this section E, part 1, one may consider the advantage of a lightness-line element in LABJND which is missing in CIEDE2000.
The performance for large colour differences of LABJND and CIEDE2000 have been studied in CIE TC1-63. The CIE requirement of a complete agreement of the TC members on a CIE report was not possible. Therefore TC1-63 was deleted in 2019 without a CIE report.
For example the calculated performance for Large Colour Differences (LCD) show no clear preference of LABJND or CIEDE2000, see Fig. 4.17-1
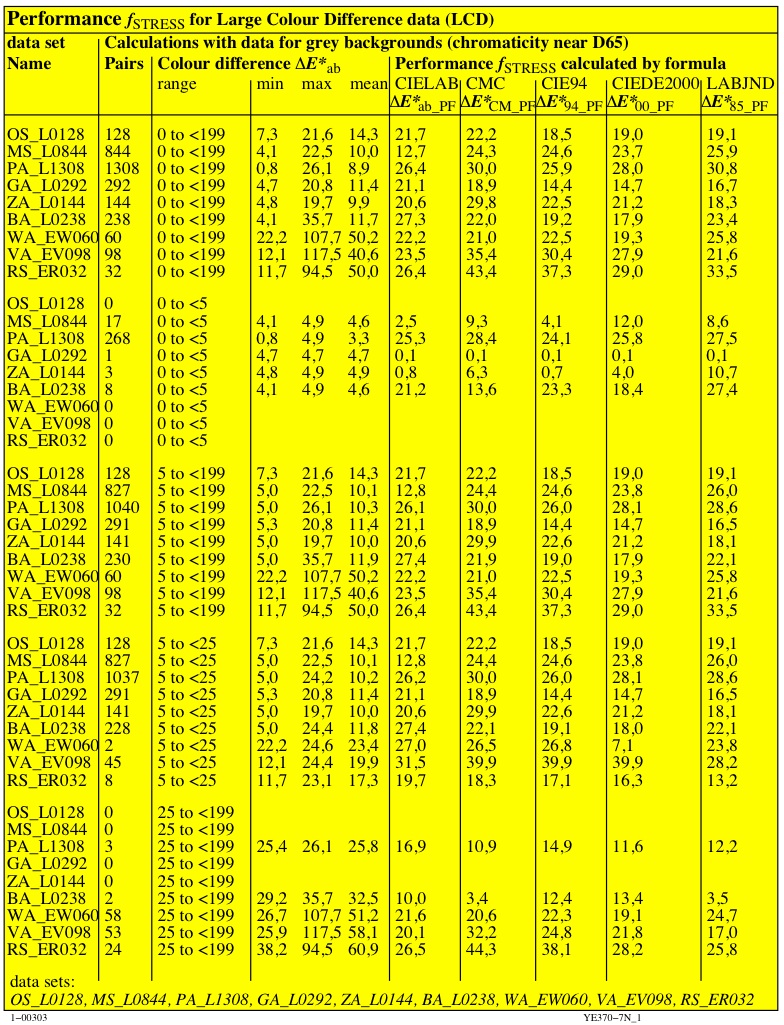
Figure 4.17-1: Performance of five different colour difference formulae for Large Colour Differences (LCD), data of OSA (OS), Munsell (MS), and others.
For the download of this figure in the VG-PDF format, see YE370-7N.PDF.
For the colour-difference range of LCD colours in the range 5 <= dE*CIELAB < 25 there is no clear advantage for one of the formulae LABJND or CIEDE2000.
It is intended to repeat the calculations of this Fig. 4.17-1 of 2016 with the new research results of this chapter E, compare results of the following parts 4.2 to 4.4.
_________________________
For links to the main chapter E
Colour Metrics, Differences, and Appearance (2023), under work.
Content list of chapter E (links and file names use small letters), see
eea_s in English or ega_s in German.
This web page is since 2023 under work.
In future the figures and the text may be improved.
Link to the next topic (under work in 2023)
Title of part 4.2: Achromatic and chromatic colour metric for the surface colour range
eea_s42 in English or ega_s42 in German.
-------
For the TUB start site (not archive), see
index.html in English, or
indexDE.html in German.
For the TUB archive site (2000-2009) of the BAM server
"www.ps.bam.de" (2000-2018)
about colour test charts, colorimetric calculations, standards,
and publications, see
indexAE.html in English,
indexAG.html in German.
For similar Information of the BAM server "www.ps.bam.de"
from the WBM server (WayBackMachine)
https://web.archive.org/web/20090402212108/http://www.ps.bam.de/index.html