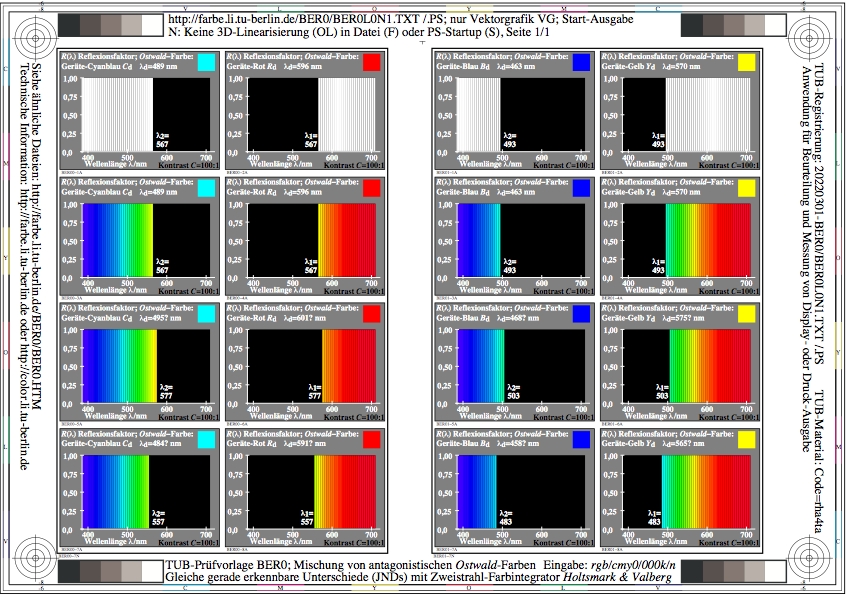
Figure BER0L0N1.jpg: Output in format A6 of the file BER0L0NP.PDF, see
BER0L0N1. PS / TXT / PDF / jpg
240215 1L2L0X0B_S2710.KTS/YERLBIN.KTS, http://farbe.li.tu-berlin.de/BERS.HTM or http://color.li.tu-berlin.de/BERS.HTM
For links to the
Section 2, Chapter B
Colour Vision and ColourimetRL (2020),
see
For this image page with 10 colour series, see
BERS in English,
BGRS in German.
For the previous image page, see
BEQS in English,
BGQS in German.
For the next image page, see
BESS in English,
BGSS in German.
For the first image page of the previous chapter A, see
AEAS in English,
AGAS in German.
For the first image page of the next chapter C, see
CEAS in English,
CGAS in German.
Content list of chapter B:
BEA_I in English or
BGA_I in German.
Summary of chapter B:
BEA_S in English or
BGA_S in German.
For the large image page of chapter B with 260 colour series, see
be2s in English or
bg2s in German.
Section 2, Chapter B
Colour vision and Colorimetry (2020),
Image part BERS
The following ten pages BER0 to BER9 of this chapter
show the content with links to the single figures
in up to six formats.
Figure BER0L0N1.jpg: Output in format A6 of the file
BER0L0NP.PDF, see
BER0L0N1.
PS /
TXT /
PDF /
jpg
BER0: TUB-test chart BER0; Mixture to Ostwald colours
Equal just noticeable colour differences (JNDs) for
C-R and B-Y with double beam colour integrator
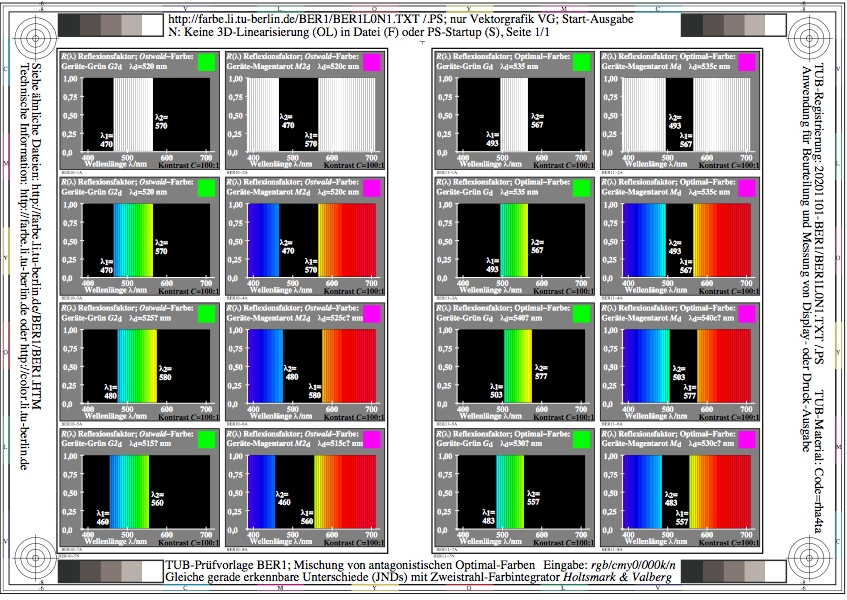
Figure BER1L0N1.jpg: Output in format A6 of the file
BER1L0NP.PDF, see
BER1L0N1.
PS /
TXT /
PDF /
jpg
BER1: TUB-test chart BER1; Mixture to optimal colours
Equal just noticeable colour differences (JNDs) for
G-M and G2-M2 with double beam colour integrator
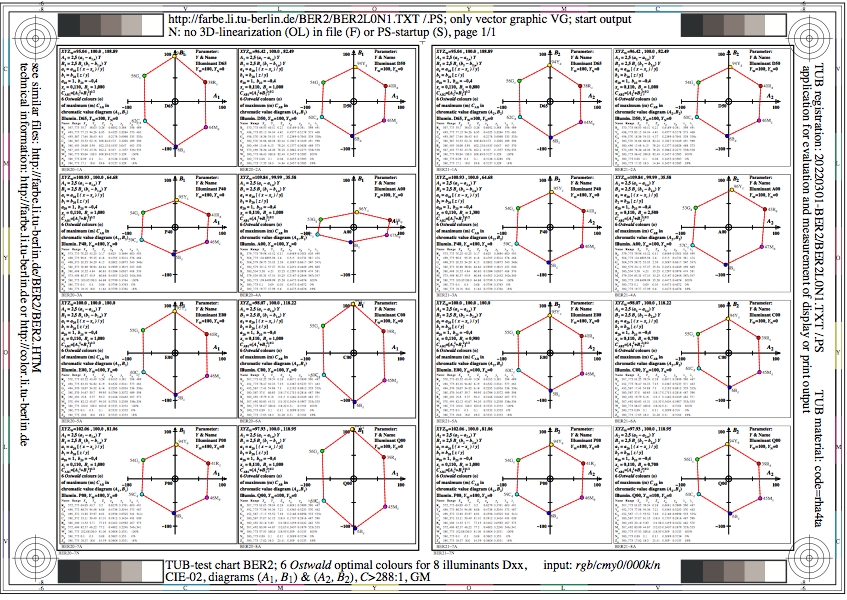
Figure BER2L0N1.jpg: Output in format A6 of the file
BER2L0NP.PDF, see
BER2L0N1.
PS /
TXT /
PDF /
jpg
BER2: TUB-test chart BER2; 6 Ostwald optimal colours, GM
for 8 illuminants Dxx, CIE-02-degree observer, chromatic value
diagrams (CAB1, CAB2), contrast C>=288:1
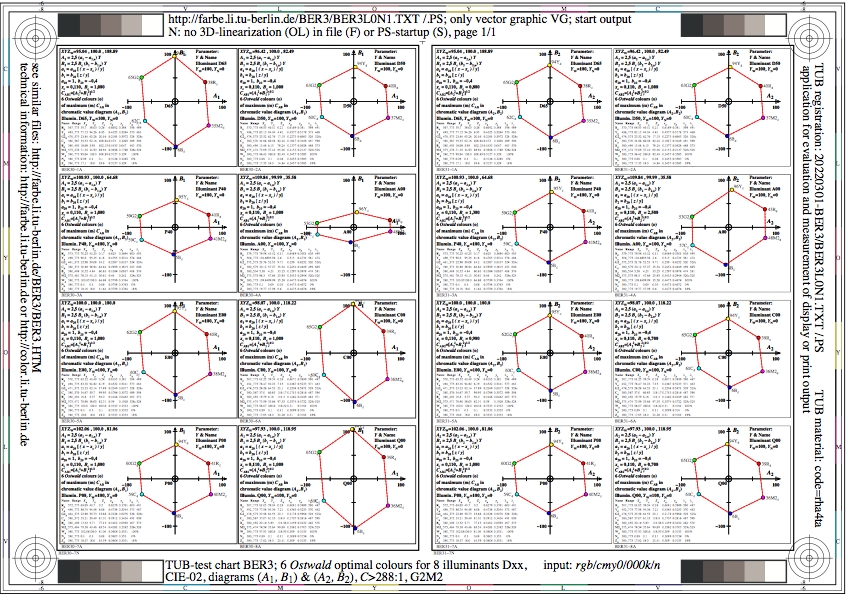
Figure BER3L0N1.jpg: Output in format A6 of the file
BER3L0NP.PDF, see
BER3L0N1.
PS /
TXT /
PDF /
jpg
BER3: TUB-test chart BER3; 6 Ostwald optimal colours, GM2
for 8 illuminants Dxx, CIE-02-degree observer, chromatic value
diagrams (CAB1, CAB2), contrast C>=288:1
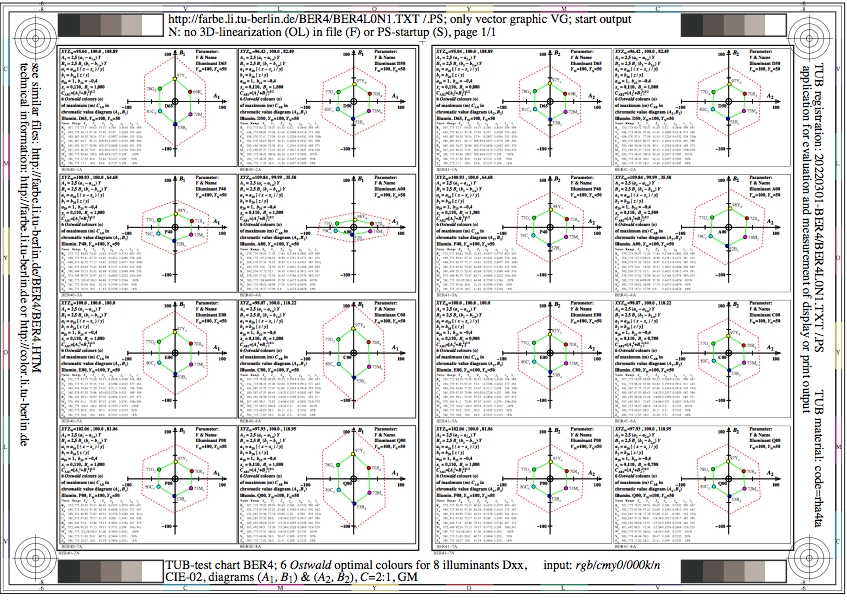
Figure BER4L0N1.jpg: Output in format A6 of the file
BER4L0NP.PDF, see
BER4L0N1.
PS /
TXT /
PDF /
jpg
BER4: TUB-test chart BER4; 6 Ostwald optimal colours, GM
for 8 illuminants Dxx, CIE-02-degree observer, chromatic value
diagrams (CAB1, CAB2), contrast C=2:1
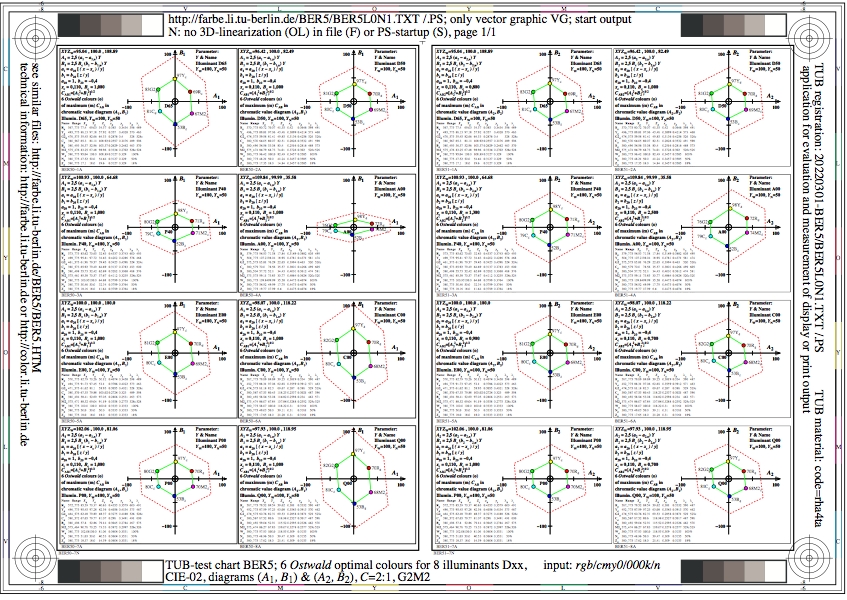
Figure BER5L0N1.jpg: Output in format A6 of the file
BER5L0NP.PDF, see
BER5L0N1.
PS /
TXT /
PDF /
jpg
BER5: TUB-test chart BER5; 6 Ostwald optimal colours, GM2
for 8 illuminants Dxx, CIE-02-degree observer, chromatic value
diagrams (CAB1, CAB2), contrast C=2:1
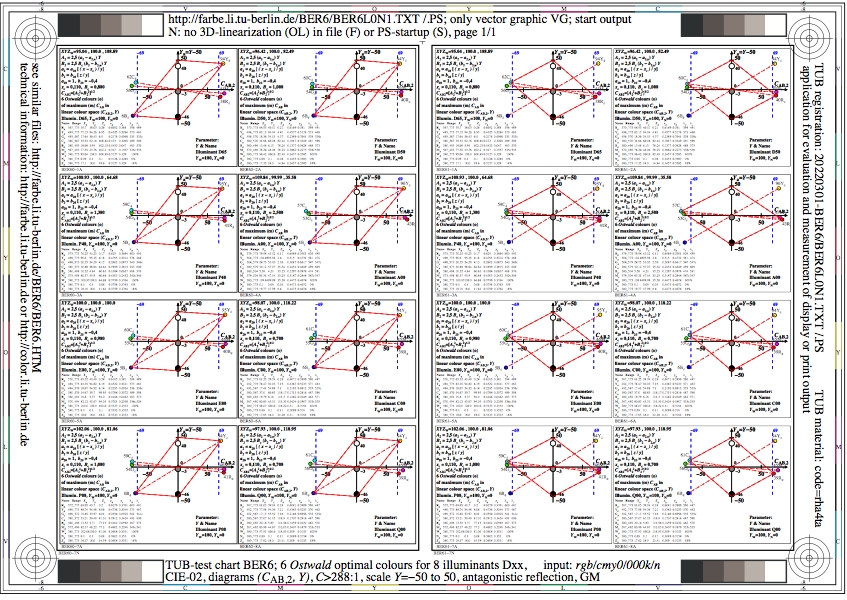
Figure BER6L0N1.jpg: Output in format A6 of the file
BER6L0NP.PDF, see
BER6L0N1.
PS /
TXT /
PDF /
jpg
BER6: TUB-test chart BER6; 6 Ostwald optimal colours, GM
for 8 illuminants Dxx, CIE-02-degree observer, diagram
(CAB2, Y), C>=288:1, -50<=Ya<=50
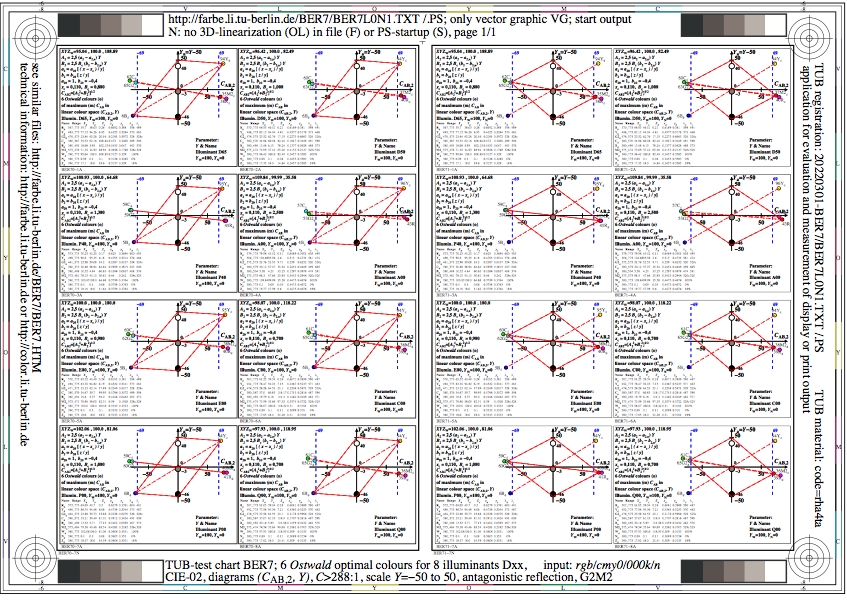
Figure BER7L0N1.jpg: Output in format A6 of the file
BER7L0NP.PDF, see
BER7L0N1.
PS /
TXT /
PDF /
jpg
BER7: TUB-test chart BER7; 6 Ostwald optimal colours, GM2
for 8 illuminants Dxx, CIE-02-degree observer, diagram
(CAB2, Y), C>=288:1, -50<=Ya<=50
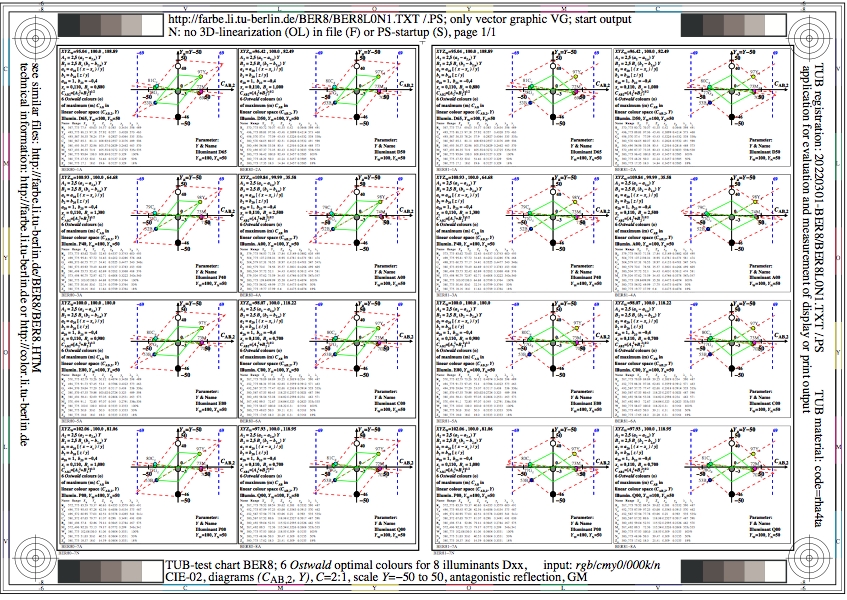
Figure BER8L0N1.jpg: Output in format A6 of the file
BER8L0NP.PDF, see
BER8L0N1.
PS /
TXT /
PDF /
jpg
BER8: TUB-test chart BER8; 6 Ostwald optimal colours, GM
for 8 illuminants Dxx, CIE-02-degree observer, diagram
(CAB2, Y), C=2:1, -50<=Ya<=50
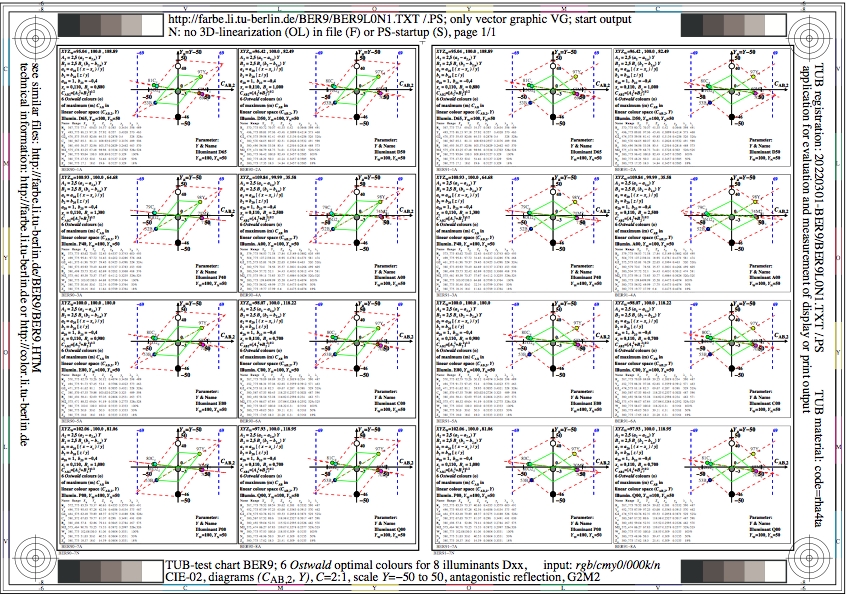
Figure BER9L0N1.jpg: Output in format A6 of the file
BER9L0NP.PDF, see
BER9L0N1.
PS /
TXT /
PDF /
jpg
BER9: TUB-test chart BER9; 6 Ostwald optimal colours, GM2
for 8 illuminants Dxx, CIE-02-degree observer, diagram
(CAB2, Y), C=2:1, -50<=Ya<=50
-------
For the archive information (2000-2009) of the BAM server "www.ps.bam.de"
(2000-2018)
about colour test charts, colorimetric calculations,
standards, and publications, see
indexAE.html in English,
indexAG.html in German.
Back to the main page of this TUB web site (NOT archive), see
index.html in English,
indexDE.html in German.