Figure hel0l0n1.jpg: Output in format A6 of the file hel0l0np.pdf, see
hel0l0n1. ps / txt / pdf / jpg
241201 1L2L0X0H_K2710.KTS/YEllHIN.KTS http://color.li.tu-berlin.de/hels.htm or http://farbe.li.tu-berlin.de/hels.htm
For links to the
Section 2, Chapter H
SDR and HDR-colour metric for optimal colour-image quality (2025)
, under work, see
For this image page with 10 colour series, see
hels in English,
hgls in German.
For the previous image page, see
heks in English,
hgks in German.
For the next image page, see
hems in English,
hgms in German.
For the first image page of the previous chapter G, see
geas in English,
ggas in German.
For the first image page of the next chapter I (under work), see
ieas in English,
igas in German.
Content list of chapter H (under work):
hea_i in English or
hga_i in German.
Summary of chapter H:
hea_s in English or
hga_s in German.
For the large image page of chapter H with 260 colour series, see
he2s in English or
hg2s in German.
Section 2, Chapter H
SDR and HDR-colour metric for optimal colour-image quality (2025),
Image part hels
The following ten pages hel0 to hel9 of this chapter
show the content with links to the single figures
in up to six formats.
Figure hel0l0n1.jpg: Output in format A6 of the file
hel0l0np.pdf, see
hel0l0n1.
ps /
txt /
pdf /
jpg
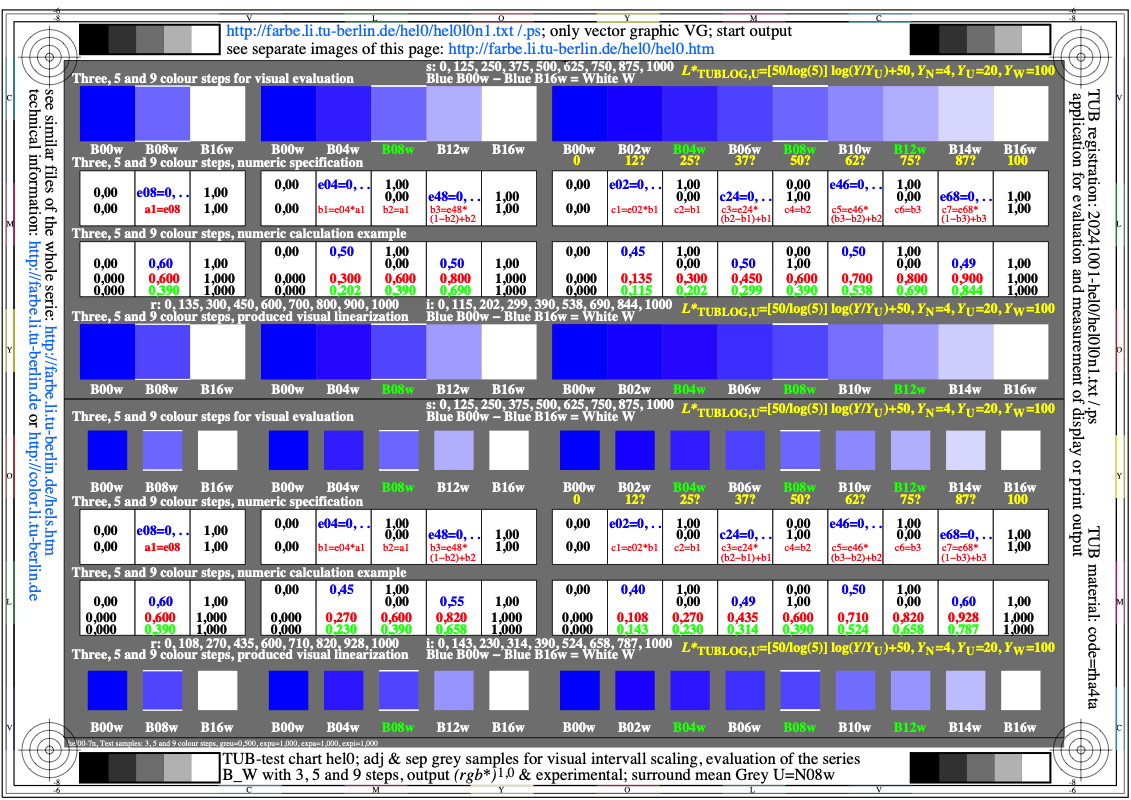
hel0: TUB-test chart hel0; adjacent (a) and separate (s) samples
B-W for visual interval scaling of 3, 5, and 9 steps
output without data a&s, (rgb*)^1 & manuel, surround U=N08w
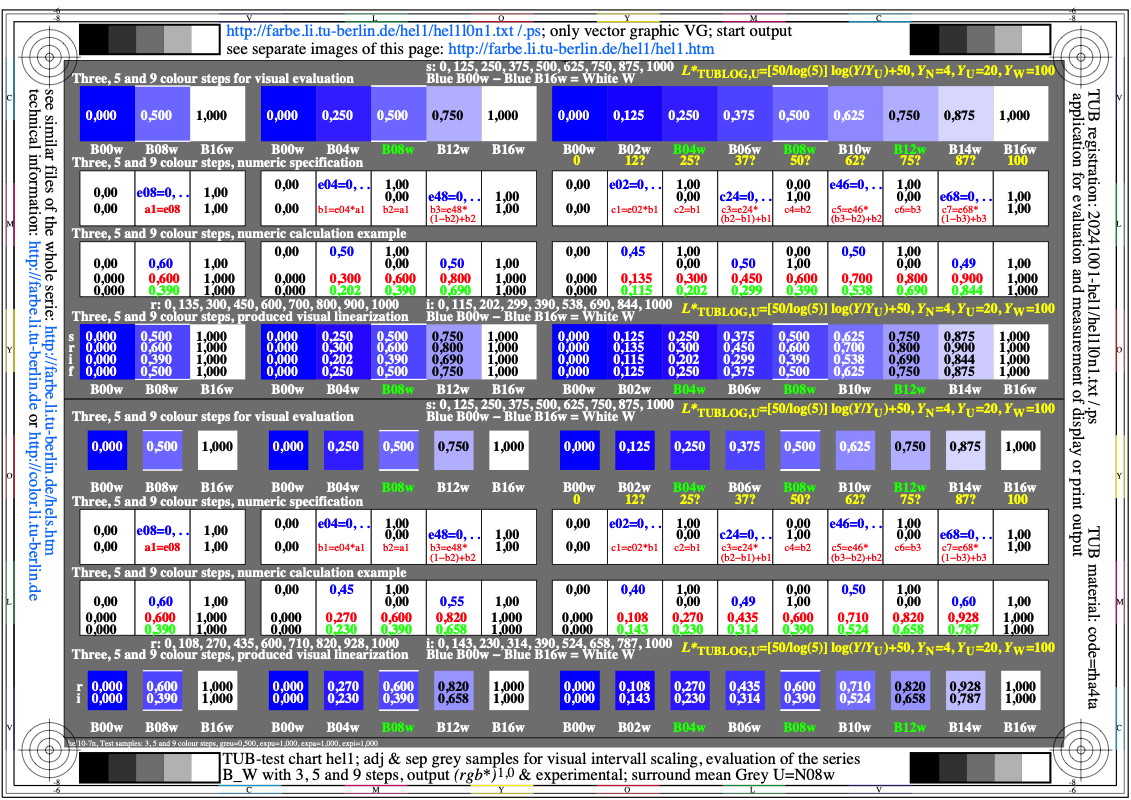
Figure hel1l0n1.jpg: Output in format A6 of the file
hel1l0np.pdf, see
hel1l0n1.
ps /
txt /
pdf /
jpg
hel1: TUB-test chart hel1; adjacent (a) and separate (s) samples
B-W for visual interval scaling of 3, 5, and 9 steps
output with data a&s, (rgb*)^1 & manuel, surround U=N08w
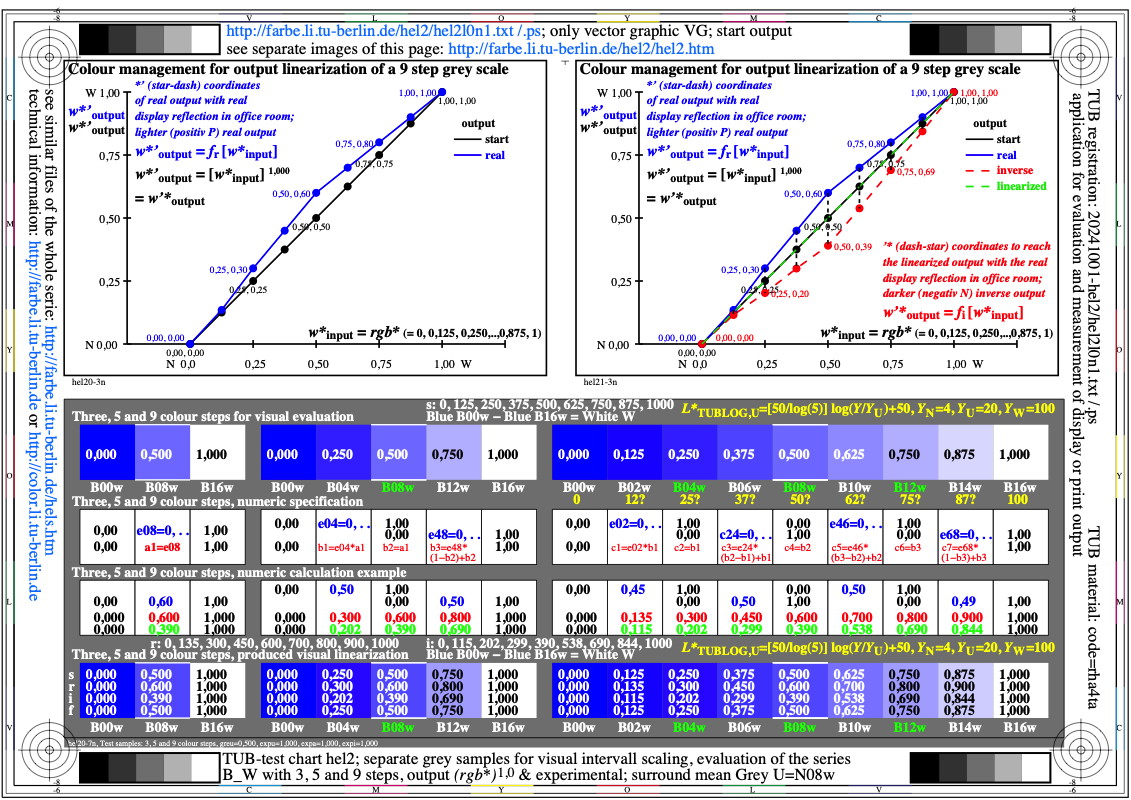
Figure hel2l0n1.jpg: Output in format A6 of the file
hel2l0np.pdf, see
hel2l0n1.
ps /
txt /
pdf /
jpg
hel2: TUB-test chart hel2; adjacent (a) samples
B-W for visual interval scaling of 3, 5, and 9 steps
with data & graphic a, (rgb*)^1 & manuel, surround U=N08w

Figure hel3l0n1.jpg: Output in format A6 of the file
hel3l0np.pdf, see
hel3l0n1.
ps /
txt /
pdf /
jpg
hel3: TUB-test chart hel3; adjacent (a) samples
B-W for visual interval scaling of 3, 5, and 9 steps
with graphic a, (rgb*)^1 & manuel, surround U=N08w

Figure hel4l0n1.jpg: Output in format A6 of the file
hel4l0np.pdf, see
hel4l0n1.
ps /
txt /
pdf /
jpg
hel4: TUB-test chart hel4; separate (s) samples
B-W for visual interval scaling of 3, 5, and 9 steps
with graphic s, (rgb*)^1 & manuel, surround U=N08w

Figure hel5l0n1.jpg: Output in format A6 of the file
hel5l0np.pdf, see
hel5l0n1.
ps /
txt /
pdf /
jpg
hel5: TUB-test chart hel5; adjacent (a) and separate (s) samples
C-W for visual interval scaling of 3, 5, and 9 steps
output without data a&s, (rgb*)^1 & manuel, surround U=N08w

Figure hel6l0n1.jpg: Output in format A6 of the file
hel6l0np.pdf, see
hel6l0n1.
ps /
txt /
pdf /
jpg
hel6: TUB-test chart hel6; adjacent (a) and separate (s) samples
C-W for visual interval scaling of 3, 5, and 9 steps
output with data a&s, (rgb*)^1 & manuel, surround U=N08w

Figure hel7l0n1.jpg: Output in format A6 of the file
hel7l0np.pdf, see
hel7l0n1.
ps /
txt /
pdf /
jpg
hel7: TUB-test chart hel7; adjacent (a) samples
C-W for visual interval scaling of 3, 5, and 9 steps
with data & graphic a, (rgb*)^1 & manuel, surround U=N08w

Figure hel8l0n1.jpg: Output in format A6 of the file
hel8l0np.pdf, see
hel8l0n1.
ps /
txt /
pdf /
jpg
hel8: TUB-test chart hel8; adjacent (a) samples
C-W for visual interval scaling of 3, 5, and 9 steps
with graphic a, (rgb*)^1 & manuel, surround U=N08w

Figure hel9l0n1.jpg: Output in format A6 of the file
hel9l0np.pdf, see
hel9l0n1.
ps /
txt /
pdf /
jpg
hel9: TUB-test chart hel9; separate (s) samples
C-W for visual interval scaling of 3, 5, and 9 steps
with graphic s, (rgb*)^1 & manuel, surround U=N08w
-------
For the archive information (2000-2009) of the BAM server "www.ps.bam.de"
(2000-2018)
about colour test charts, colorimetric calculations,
standards, and publications, see
indexAE.html in English,
indexAG.html in German.
Back to the main page of this TUB web site (NOT archive), see
index.html in English,
indexDE.html in German.