Figure hew0l0n1.jpg: Output in format A6 of the file hew0l0np.pdf, see
hew0l0n1. ps / txt / pdf / jpg
241201 1L2L0X0H_K2710.KTS/YEwlHIN.KTS http://color.li.tu-berlin.de/hews.htm or http://farbe.li.tu-berlin.de/hews.htm
For links to the
Section 2, Chapter H
SDR and HDR-colour metric for optimal colour-image quality (2025)
, under work, see
For this image page with 10 colour series, see
hews in English,
hgws in German.
For the previous image page, see
hevs in English,
hgvs in German.
For the next image page, see
hexs in English,
hgxs in German.
For the first image page of the previous chapter G, see
geas in English,
ggas in German.
For the first image page of the next chapter I (under work), see
ieas in English,
igas in German.
Content list of chapter H (under work):
hea_i in English or
hga_i in German.
Summary of chapter H:
hea_s in English or
hga_s in German.
For the large image page of chapter H with 260 colour series, see
he2s in English or
hg2s in German.
Section 2, Chapter H
SDR and HDR-colour metric for optimal colour-image quality (2025),
Image part hews
The following ten pages hew0 to hew9 of this chapter
show the content with links to the single figures
in up to six formats.
Figure hew0l0n1.jpg: Output in format A6 of the file
hew0l0np.pdf, see
hew0l0n1.
ps /
txt /
pdf /
jpg
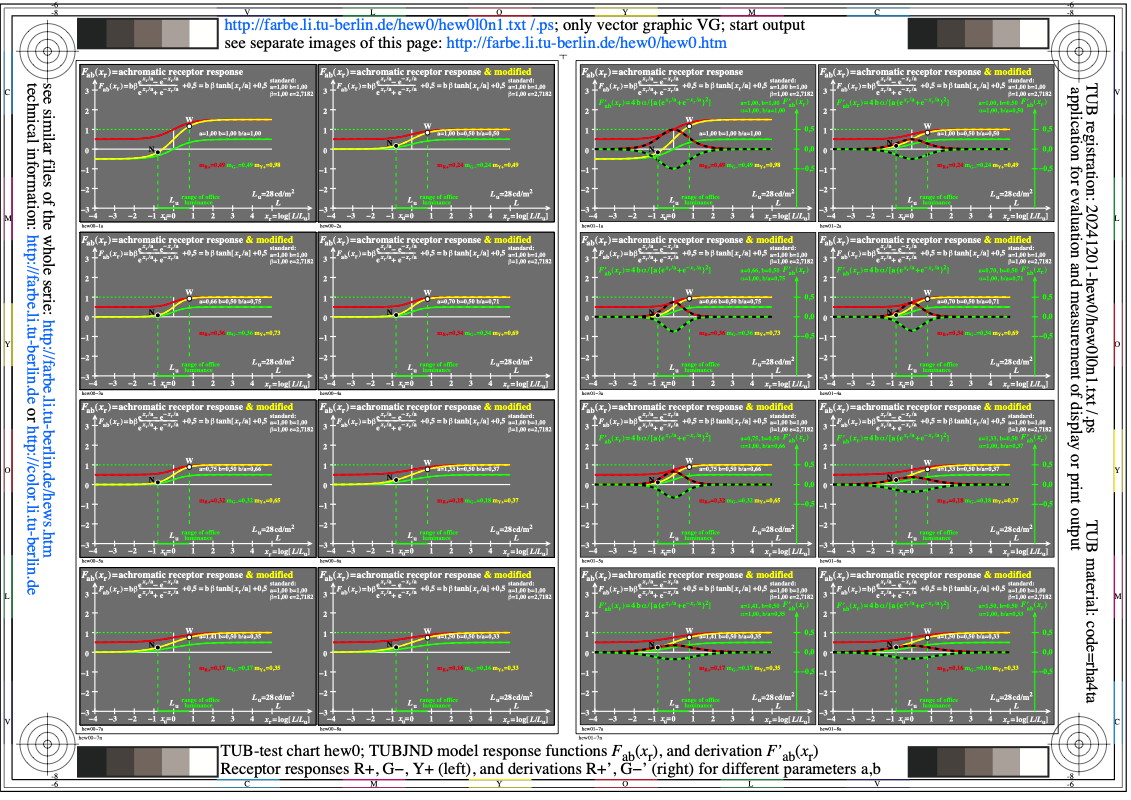
hew0: TUB-test chart hew0; TUBJND model with functions Fab, F'ab
Receptor responses R+, G-, Y+ (left & right), and derivations
R+', G-' (right) for diferent parameters a,b
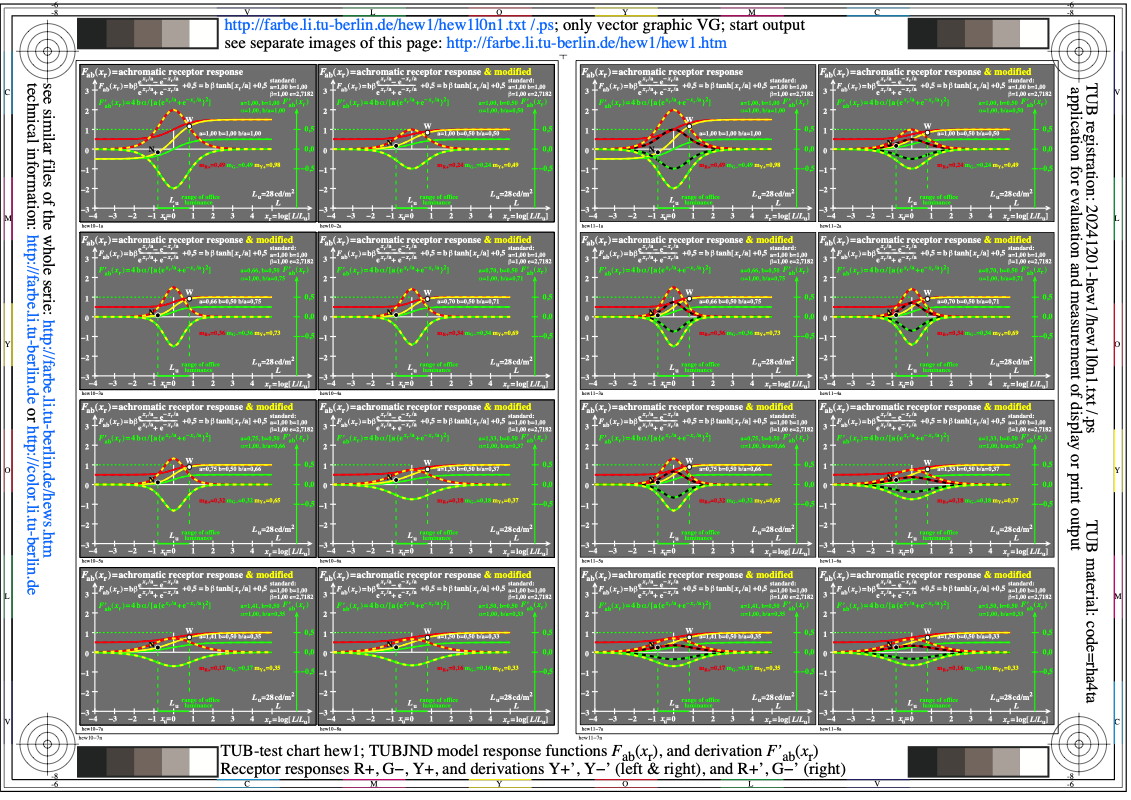
Figure hew1l0n1.jpg: Output in format A6 of the file
hew1l0np.pdf, see
hew1l0n1.
ps /
txt /
pdf /
jpg
hew1: TUB-test chart hew1; TUBJND model with functions Fab, F'ab
Receptor responses R+, G-, Y+ (left & right), and derivations
Y+', Y-' (left & right), and R+'/G-' (right) for a,b

Figure hew2l0n1.jpg: Output in format A6 of the file
hew2l0np.pdf, see
hew2l0n1.
ps /
txt /
pdf /
jpg
hew2: TUB-test chart hew2; Fab(xr)-model for visual responses
derivation of the responses; tanh(xr) with e^xr/a and 10^xr/a'
a'=a ln(10); a^n = a^0,5; 4 x 4 images
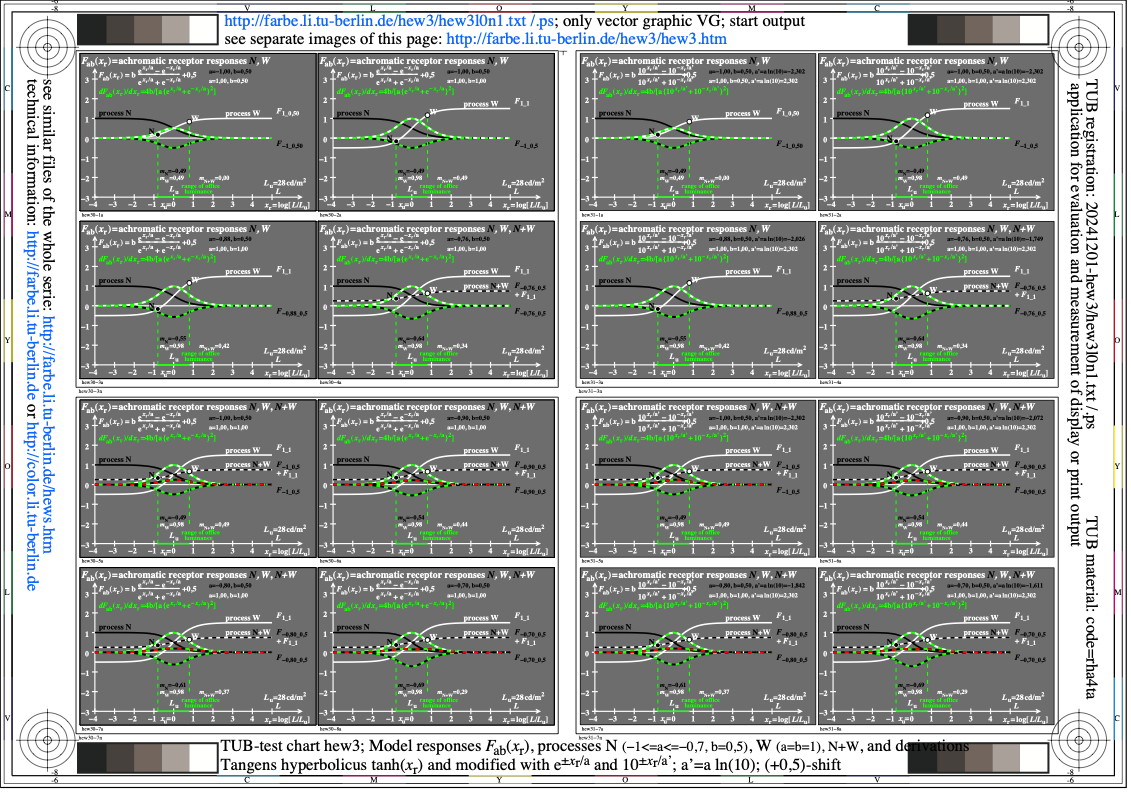
Figure hew3l0n1.jpg: Output in format A6 of the file
hew3l0np.pdf, see
hew3l0n1.
ps /
txt /
pdf /
jpg
hew3: TUB-test chart hew3; Fab(xr)-model for visual responses
derivation of the responses; tanh(xr) with e^xr/a and 10^xr/a'
a'=a ln(10); a^n = a^1,0; 4 x 4 images

Figure hew4l0n1.jpg: Output in format A6 of the file
hew4l0np.pdf, see
hew4l0n1.
ps /
txt /
pdf /
jpg
hew4: TUB-test chart hew4; Fab(xr)-model for visual responses
derivation of the responses; tanh(xr) with e^xr/a and 10^xr/a'
a'=a ln(10); a^n = a^0,7; 4 x 4 images
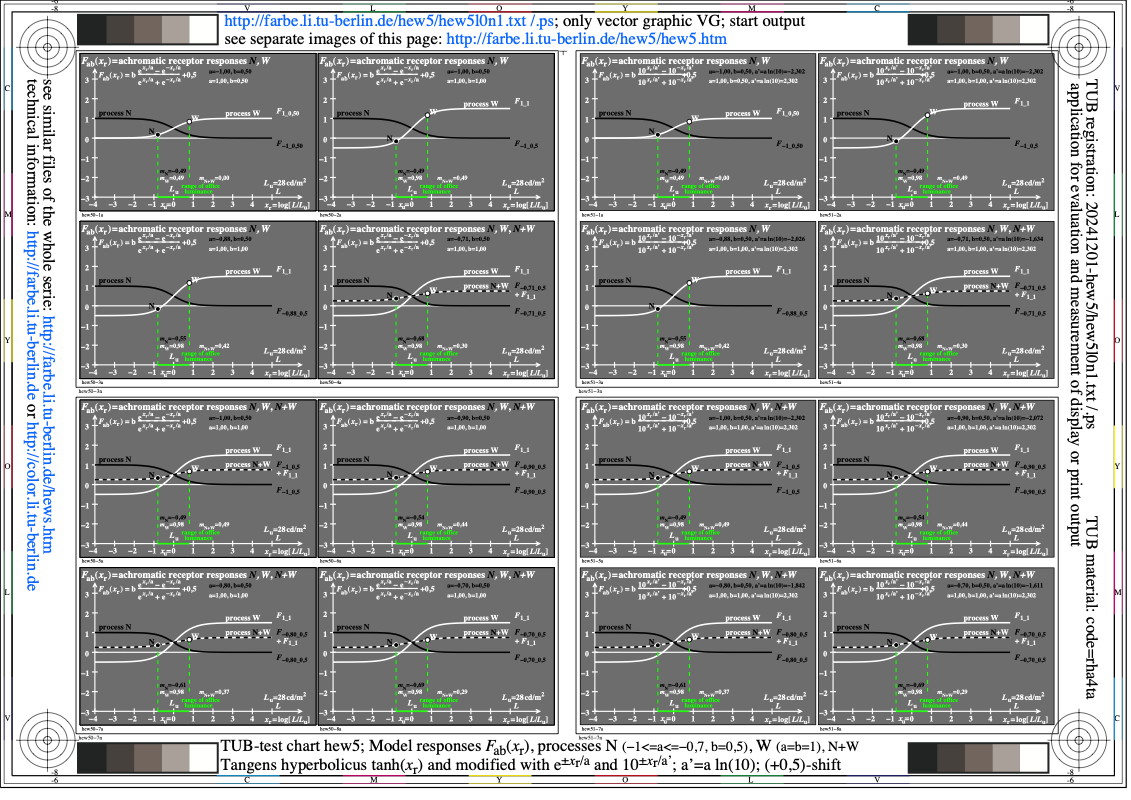
Figure hew5l0n1.jpg: Output in format A6 of the file
hew5l0np.pdf, see
hew5l0n1.
ps /
txt /
pdf /
jpg
hew5: TUB-test chart hew5; Fab(xr)-model for visual responses
derivation of the responses; tanh(xr) with e^xr/a and 10^xr/a'
a'=a ln(10); a^n = a^0,5; 4 x 4 images

Figure hew6l0n1.jpg: Output in format A6 of the file
hew6l0np.pdf, see
hew6l0n1.
ps /
txt /
pdf /
jpg
hew6: TUB-test chart hew6; HAULAB & IEC, Adaptations 300, 1000,
200 & 40 cd/m^2, (Haubner, 1980) & data; lin [ligtness L*,
threshold delta_Y, sensitivity delta_Y/Y, contrast Y/delta_Y]
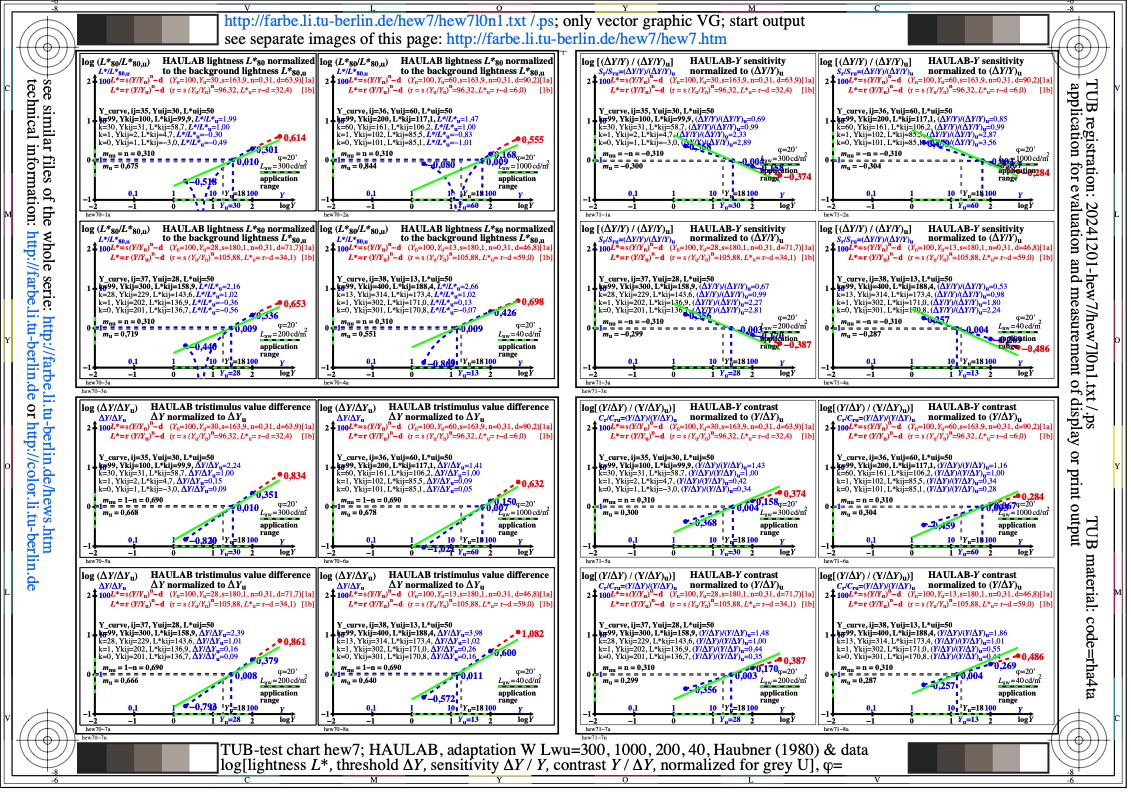
Figure hew7l0n1.jpg: Output in format A6 of the file
hew7l0np.pdf, see
hew7l0n1.
ps /
txt /
pdf /
jpg
hew7: TUB-test chart hew7; HAULAB & IEC, Adaptations 300, 1000,
200 & 40 cd/m^2, (Haubner, 1980) & data; log [ligtness L*,
threshold delta_Y, sensitivity delta_Y/Y, contrast Y/delta_Y]
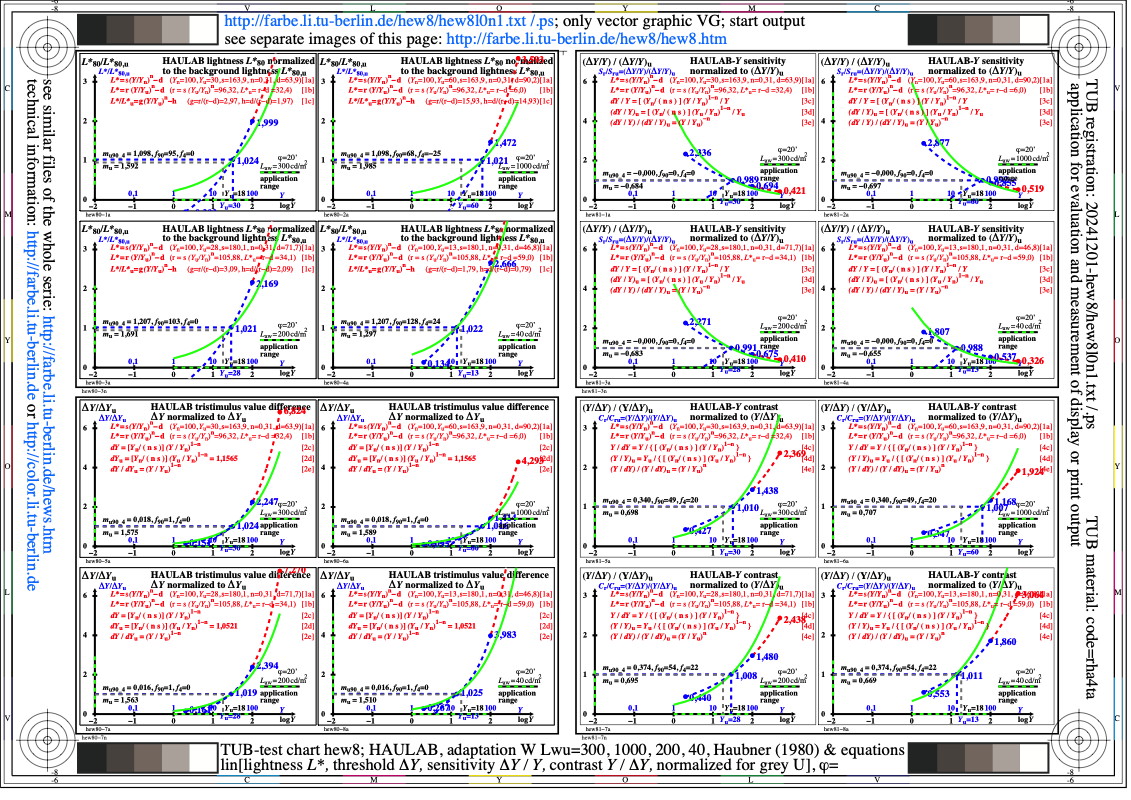
Figure hew8l0n1.jpg: Output in format A6 of the file
hew8l0np.pdf, see
hew8l0n1.
ps /
txt /
pdf /
jpg
hew8: TUB-test chart hew8; HAULAB & IEC, Adaptations 300, 1000,
200 & 40 cd/m^2, (Haubner) & equations; lin [ligtness L*,
threshold delta_Y, sensitivity delta_Y/Y, contrast Y/delta_Y]

Figure hew9l0n1.jpg: Output in format A6 of the file
hew9l0np.pdf, see
hew9l0n1.
ps /
txt /
pdf /
jpg
hew9: TUB-test chart hew9; HAULAB & IEC, Adaptations 300, 1000,
200 & 40 cd/m^2, (Haubner) & equations; log [ligtness L*,
threshold delta_Y, sensitivity delta_Y/Y, contrast Y/delta_Y]
-------
For the archive information (2000-2009) of the BAM server "www.ps.bam.de"
(2000-2018)
about colour test charts, colorimetric calculations,
standards, and publications, see
indexAE.html in English,
indexAG.html in German.
Back to the main page of this TUB web site (NOT archive), see
index.html in English,
indexDE.html in German.