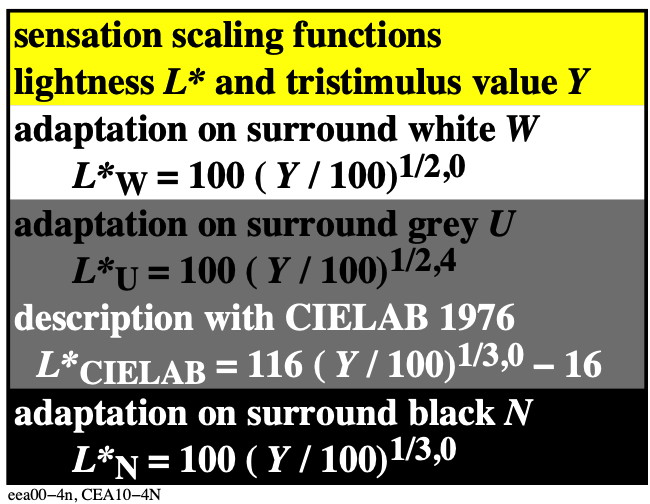
Of course a local adaptation to more blackish or more whitish colours is possible. This adaptation takes more time for dark compared to light colours.
6.23 Historic changes of Gamma from 1,8 via 2,4 to 3,0?
Until about 2005 for example the operating system Apple OSX has used the ergonomic value Gamma = 1,8 for the SDR-display output. This Gamma value is recommended according to the ergonomic standard ISO 9241-306 for the standard display reflection Y=2,5 in offices.
Since about 2005 a new default value Gamma = 2,4 according to CIELAB and sRGB has been used in OSX. However the ergonomic value Gamma=1,8 was still possible with a display-output option in the operating system OSX.
Since 2022 the use of the ergonomic value Gamma = 1,8 has disappeared in OSX. Most standard images are designed for the value Gamma =2,4. However, the standard display reflection Y=2,5 requires the value Gamma = 1,8. The realization of this value is 2024 not any more possible in OSX.
Since 2022 the default value is Gamma = 2,4 (or 2,2) within the operating system OSX. No way is known how to change the Gamma. Therefore often the two darkest grey steps of 16 steps are visually not any more distinguishable.
This property appears also for new images, which may require approximately the value Gamma = 3,0 on HDR-displays. Then additional grey and colour steps of these images may not be distinguishable on the standard SDR displays.
Some alternate solutions for Apple OSX are available.
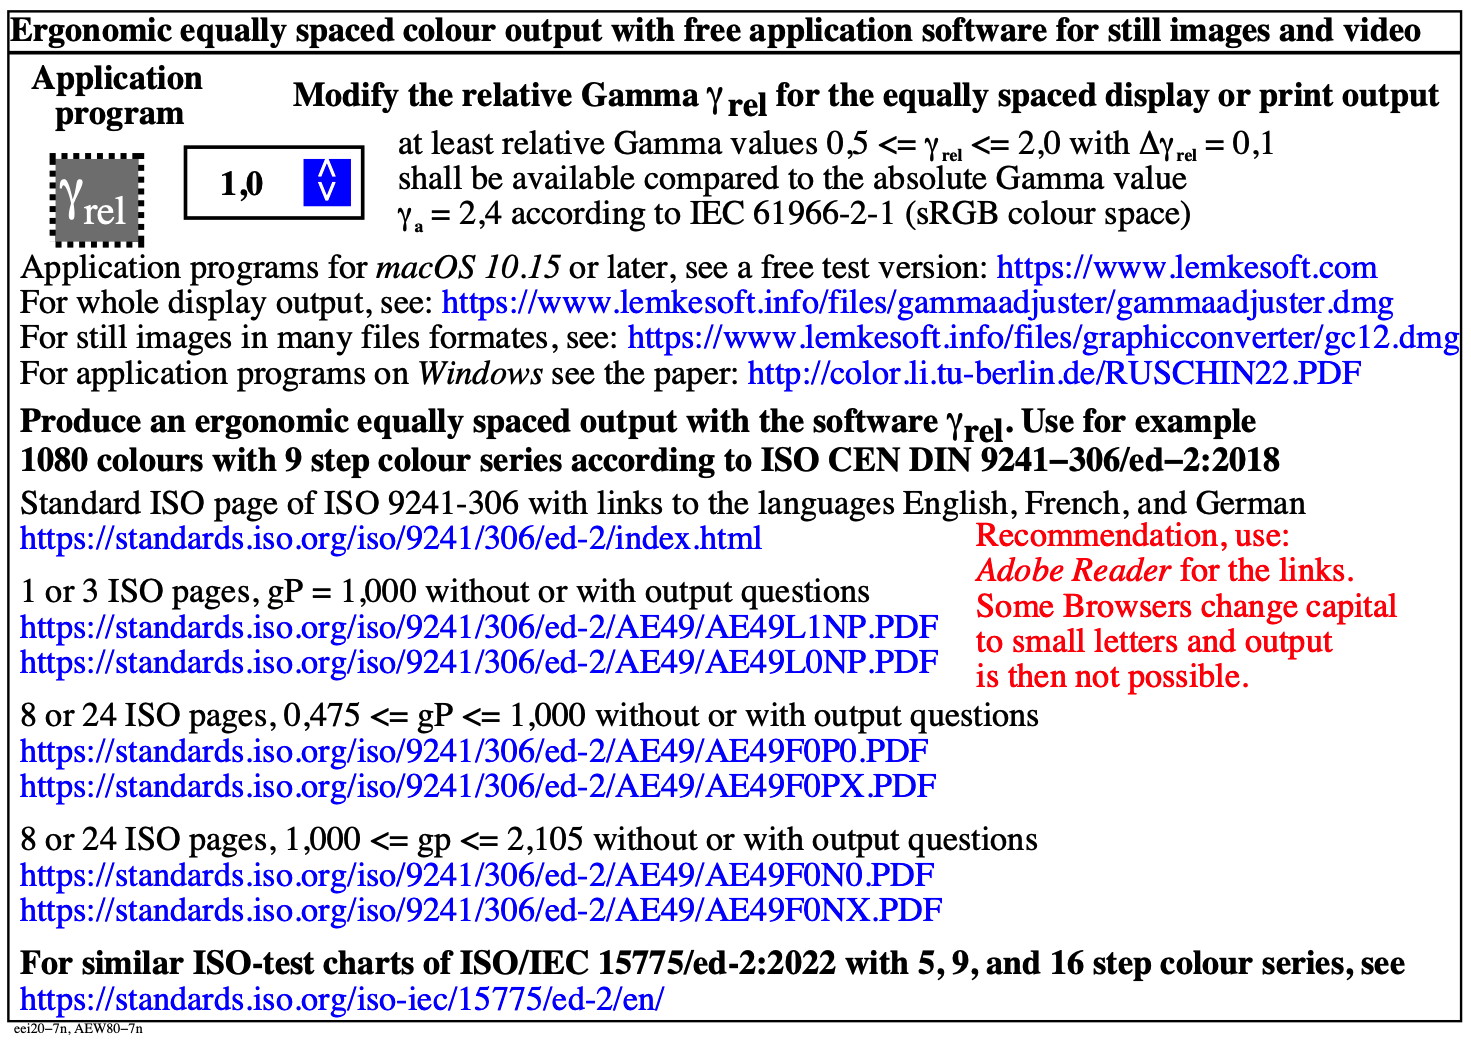
Fig. 4: Gamma software and ISO-test charts which include 16 Gamma values
For the download of this figure in the vector-pdf format, see eei20-7n.pdf.
Figure 4 shows software which allow to change the Gamma of the image output. For OSX the GammaAdjuster changes the whole display output for both still images and video. This software may replace the GammaSlider on OSX which disappeared in 2022. The display capture, transfer, and store of a changed image is not possible.
The software GraphicConverter can change the Gamma of still images in many file formats. It allows to store new images in many formats with one or 16 different Gamma values. This allows to choose the ergonomic one which is visually approximately equally spaced.
Both Gamma-software applications use relative Gamma values. The relative values between 0,5 and 2,0 correspond to the Gamma range 1,2 <= Gamma <=4,8. The user can decide the appropriate gamma for his application. This Gamma value depends on the default Gamma of the display, the display reflection of the ambient light, and the age of the observer. Yes/No questions are used in ISO 9241-306 to determine the a special Gamma out of 16 Gammas for the ergonomic equally spaced output.
Remark: The software GraphicConvertor can transfer an image in the format eps or ps to a pdf-image. This property of the software MacPreview on OSX disappeared in 2022. The software GraphicConvertor can change many other file formats in both directions.
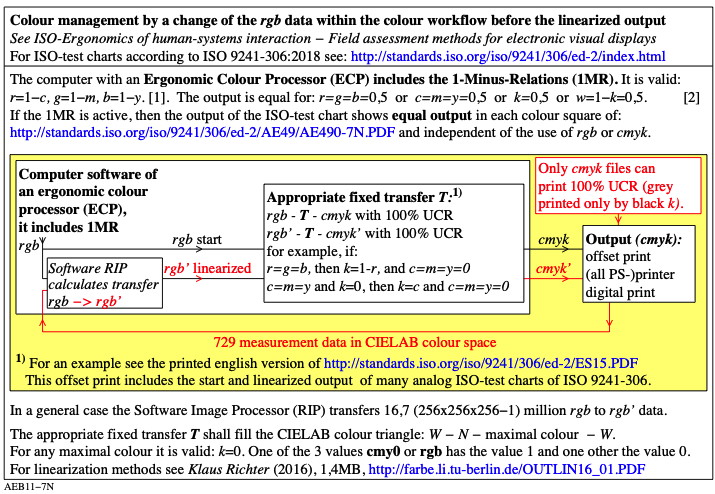
6.24 Change of Gamma in the PostScript file
The programming language PostScript includes the PS-operator { } setcolortransfer. Usually a potential function is used to change the values rgb in the range 0 to 1, for example by the equation
r' = r^2,4 with the exponent 2,4.
If a file with the extension .eps or .ps in tubtiv includes a line { } setcolortransfer near the beginning no change is produced.
However, the use of different gamma values is possible by a PostScript-frame file. For example the exponent 1,8 in the frame file is transferred to the image file and applied.
The frame file technology has been used to include both the 1MR equations and the Gamma changes within the eps and ps images. These properties are then included also in the pdf-file.
Many frame file examples are included in the tubtiv. After change of a pdf file to a ps file, the frame file can apply the 1MR equations and the Gamma to the ps file. Then a new pdf file with the intended properties 1MR and Gamma can be produced.
Remark: For many years the web browser Safari of OSX has transferred automaticly all PostScript files in the format eps and ps of tubtiv to the pdf-image output. However in 2022 this property disappeared in the web browser Safari of OSX.
6.25 Ergonomic equal spacing and image quality specification
ISO/IEC 15775, Annex G, defines the quality of the image input and output by the regularity index g*. For the ergonomic output for example the 16 step grey scale shall be equally spaced in CIELAB-lightness L*. ISO/IEC 15775 defines digital and analog test charts. For example
16 equally spaced grey steps with equal differences are specified by:
rgb* values: 0, 1/15, 2/15, ..., 14/15, 15/15 with delta_rgb*=0,066
L* values: 20, 25, 30, ..., 90, 95 with delta_L*=5,0.
The digital ISO/IEC-test charts with the above rgb* value have been used to produce the analog ISO/IEC-test chart no. 3 with the above L* values on offset paper. The analog test chart no. 3 and a test chart no. 1 on photographic paper in the range 10 <= L* <= 95 are called the originals for a colour copier.
The quality of the copy will be studied for one example output paper.
The standard office paper has the L* range: 25 <= L* <= 95.
Fluorescent copy papers have a larger contrast range in L*, and recycled copy papers have a lower contrast range.
ISO/IEC 15775 specifies the output quality by the regularity index:
g* = 100 delta_L*min / delta_L*max
If the ergonomic output appears in the copy by equal spacing, then by this equation the value is g* = 100.
If delta_L*min = 0, then two steps are not distinguishable. In this worst case the value is g* = 0.
The output value g* = 100 is called an very good copy.
The goal of ICC-colour management is very different. The goal is the minimum colour difference between the original and the copy.
The minimum colour difference is produced on the standard paper, if the two dark steps with the values L* = 20 and 25 are both reproduced equal with L*=25 in the copy. The 14 other steps shall be equal in L* compared to the original to produce the minimum colour difference.
The mean ICC-colour difference is then according to the formula
delta_L*mean = [ delta_L*1 + delta_L*2 + delta_L*3 + ... + delta_L*14 + delta_L*15] /15
= [ 5 + 14 x 0] / 15 = 0,3
Therefore the quality specification of the copy is opposite:
"very good" by the colour difference delta_L*mean = 0,3.
This value is smaler compared to the visual threshold delta_L* = 1.
"very bad" by the regularity index g* = 0.
The reason is the value delta_L*min = 0 of the two equal dark steps of 15.
For the copy example the quality specification is opposite "very good and very bad":
The quality value delta_L*mean = 0,3 specifies an very good quality according to ISO 20677;2019 (ICC color management).
Conclusion:
For an ergonomic output an equal spacing is required. Otherwise important colour image information is lost. It is therefore required to specify the colour image quality of both the original and the copy by the regularity index g* according to ISO/IEC 15775:2022, Annex G.
In colour applications there are shifts of the L* range, for example smaller L* ranges with lower contrast on recycled paper, and larger L* ranges with larger contrast on photographic paper.
In any case teh quality shall be spezified by the regulaty indes g*. The mean colour difference according to ISO 20677 (ICC colour management) is not appropriate to specify the quality.
Future application for colour copiers:
For example both users and manufacturers of a colour copier on photographic or high glossy paper wish, that the whole contrast range of the copier is used.
Proposal for the specification of the image quality for copiers
1. The mean colour difference is not usefull and shall be deleted to specify the quality.
2. The regularity index g* shall be used.
The new default option of colour management shall be the ergonomic colour management. The quality specification is based on the regularity index g*.
This index may be modified by a factor f which is defined by the ratio of the device (d) range delta_L*d and the standard offset (o) device range delta_L*o = 75 according to ISO/IEC 15775:2022. Then this modified index increase with the contrast range.
The image quality shall not be specified by the mean difference according to ISO 20670 (ICC colour management). Since 2010, more and more special image corrections, for example "black point adjustment" are used. These corrections are used with metadata and together with ICC profiles according to ISO 20670. However, every lightness step must be adjusted and not only the steps near black.
Since 2010, many user application programs for consumers have increasingly used their own interpretations of ICC profiles and metadata or ignore these. This is another source for the colour chaos in the consumer area. ICC profiles and metadata are not required for the ergonomic colour management according to ISO/IEC 15775:2022 and ISO 9241-306:2018.
6.26 Example of historic prints of 16 step grey scales
The author received in 1999 a printed official output of the standard ISO/IEC 15775:1999, and in 2019 a printed official output of the standard ISO EN DIN 9241-306/ed-2:2019
Both include prints of 16 step grey and colour scales.
The 1999 output includes 16 equally spaced grey steps.
The 2019 output shows four dark grey steps, which are visually not distinguishable.
The image quality shall be specified according to the regularity index g*. The 1999 output is specified by a value near g* = 100 and may be called "very good". The 2099 output is specified by a value g* = 0. This worst case may be called "very bad" and is not acceptable. The reasons for this example case is unknown.
One possible (wrong?) explanation:
If the pdf-file data rgb* are specified for the range 0 <= L* <= 100 of a display output without ambient reflection, then four steps with L* = 0,0 6,6, 13,2, 20,0 can not be reproduced and are printed with L*=25. This output has then the regularity index g* = 0. This output is neither ergonomic, nor efficient, nor sustainable because too much toner is used.
However, the correct output shall be equally spaced in the range 25 <= L* <= 95 with delta_L* = 4,66 between all neighbouring steps. This output has the regularity index g* = 100. Then the quality is "very good". This case has been realized in 1999.
7. Colour loop, benefits, and applications without metadata
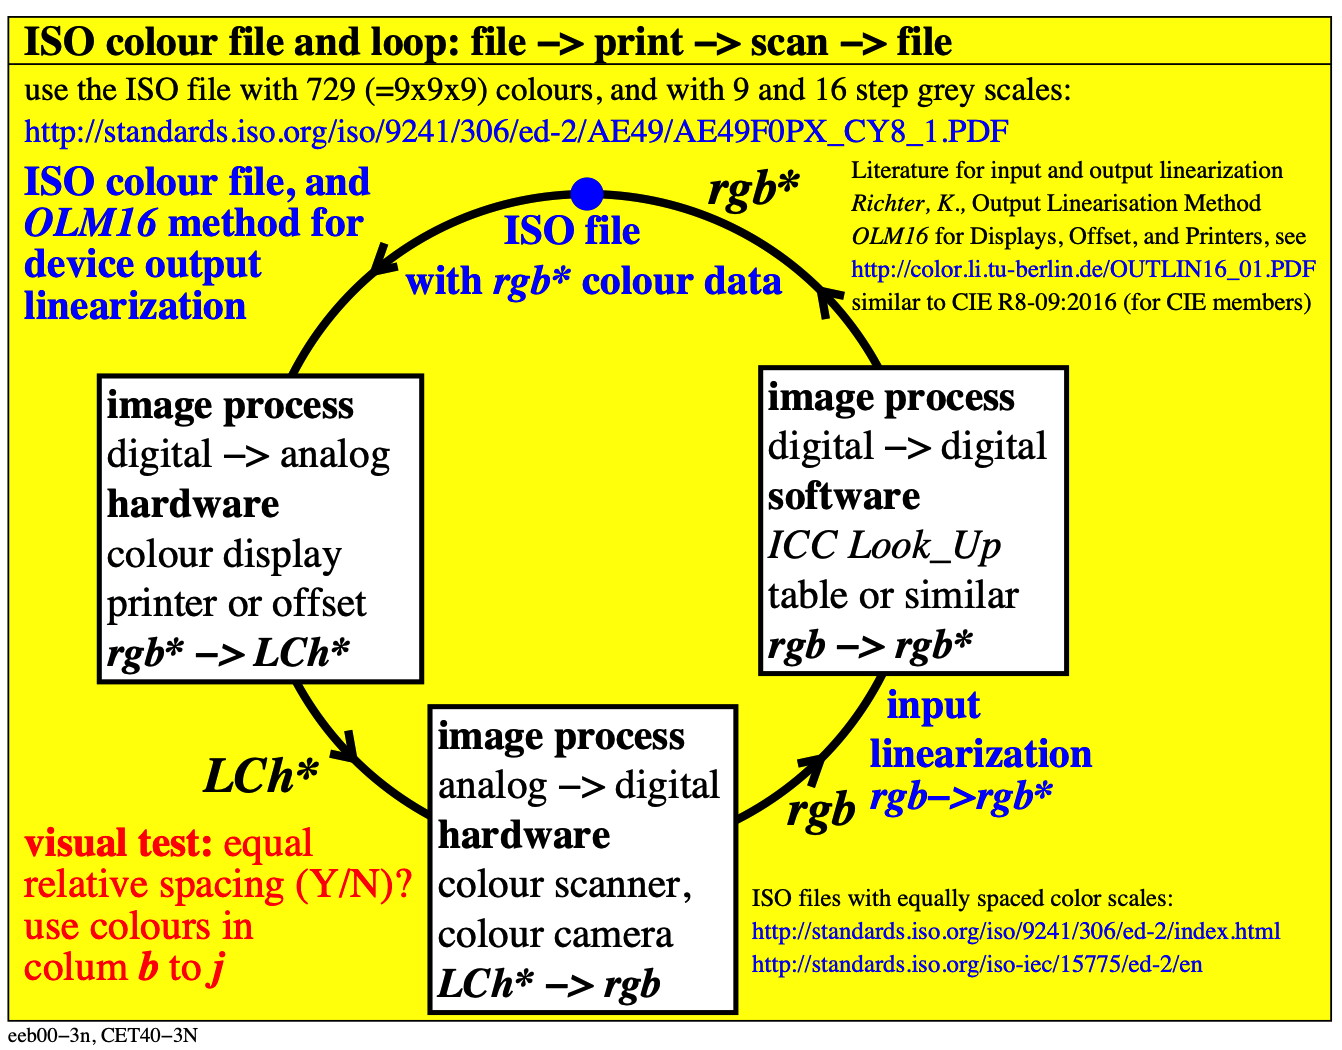
Fig. 5: Colour loop ISO-rgb* file - print - scan - ISO-rgb* file
For the download of this image in vector-pdf format, see eeb00-3n.pdf.
Figure 5 shows an ISO file with equally spaced digital rgb*-colour data with 000 for the device black and 111 for the device white. Within the colour loop, after printing and scanning, approximately the same rgb* colour data are generated compared to the beginning.
This applies for all colour-devices combinations, also for example for the display output and the photo scan of the display output. For the realization of the colour loop in Figure 5 the manufacturers or users linearize their colour devices.
The technical basis for the implementation can be found in the standard documents which are included in Figure 5. A TUB-colour vision model for chromatic and luminance adaptation allows the application in the following display areas: Low, Standard and High Dynamic Range (LDR, SDR and HDR).
The application of the colour loop of Figure 5 is ergonomic, efficient and sustainable.
8. Summary
A new future TUB development entitled:
Ergonomic architecture of colour-image processing with chromatic and luminance adaptation without colour image metadata
may use the following developments:
1. the TUB text_image_vocabulary tubtiv for education and standardization.
2. the ISO colour loop with standard documents in Figure 5.
3. The "Antagonistic TUB-relativity model of colour vision for a wide range of luminance and chromatic adaptation", see eea_s.htm.
Annex A. Structure of the "TUB text_image_vocabulary (tubtiv)"
The colour-image series consist of three Sections: 0 (1998-2010), 1 (2011-2018) and 2 (2019-present).
The latest image series of Section 2 (2019-present) is at the beginning. Older image series of Section 1 (2011-2018) and the Section 0 (1998-2010) follow.
All three Sections can be downloaded separately. To do this, the file "tubtiv_ahe" with the three Sections is replaced by "tubtiv_2he", "tubtiv_1he", or "tubtiv_0he" with one Section in each case.
All files contain text information with links to the pdf-image series, to the pdf-image in the size A4, and often to 16 individual pdf-images.
Section 2 (2019-present) contains: 5x260 image series.
Both Sections 1 (2011-2017) and 0 (1998-2010) each contain 26x100 image series.
All images are available for free download on two TUB servers, see
http://farbe.li.tu-berlin.de/index.html or
http://color.li.tu-berlin.de/index.html
Annex B. Copyright
For free copyright see:
http://farbe.li.tu-berlin.de/CEV1/CEV10-3N.PDF in English or:
http://farbe.li.tu-berlin.de/CGV1/CGV10-3N.PDF in German.
Acknowledgements
For discussions and proposals to optimize the content of the tubtiv I thank especially:
Detlef Ruschin, German Representative in CIE Div. 1 "Vision and Colour", and
Prof. Florian Suessel, German Representative in CIE Div. 8 "Image Technology".