Figure DEA0L0N1.jpg: Output in format A6 of the file DEA0L0NP.PDF, see
DEA0L0N1. PS / TXT / PDF / jpg
241201 1L2L0X0D_S2710.KTS/YEALDIN.KTS, http://farbe.li.tu-berlin.de/DEAS.HTM or http://color.li.tu-berlin.de/DEAS.HTM
For links to the
Section 2, Chapter D
Colour Appearance, Elementary Colours, and Metrics (2022),
see
For this image page with 10 colour series, see
DEAS in English,
DGAS in German.
For the previous image page, see
DEZS in English,
DGZS in German.
For the next image page, see
DEBS in English,
DGBS in German.
For the first image page of the previous chapter C, see
CEAS in English,
CGAS in German.
For the first image page of the next chapter E, see
eeas in English,
egas in German.
Content list of chapter D:
DEA_I in English or
DGA_I in German.
Summary of chapter D:
DEA_S in English or
DGA_S in German.
For the large image page of chapter D with 260 colour series, see
de2s in English or
dg2s in German.
Section 2, Chapter D
Colour Appearance, Elementary Colours, and Metrics (2022),
Image part DEAS
The following ten pages DEA0 to DEA9 of this chapter
show the content with links to the single figures
in up to six formats.
Figure DEA0L0N1.jpg: Output in format A6 of the file
DEA0L0NP.PDF, see
DEA0L0N1.
PS /
TXT /
PDF /
jpg
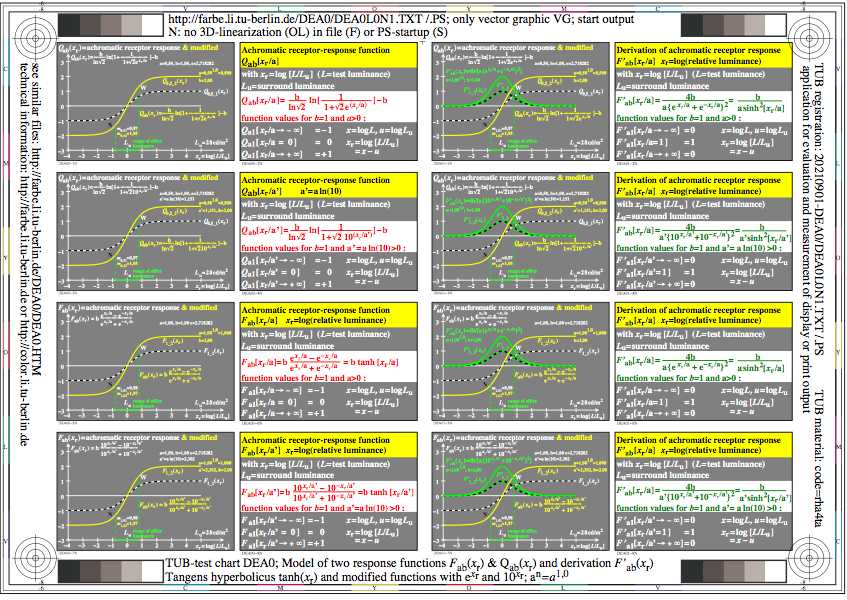
DEA0: TUB-test chart DEA0; Comparison of Qab(xr) and Fab(xr)
Line elements as integral an derivation
tanh(xr) mit e^(xr/a) und 10^(xr/a')
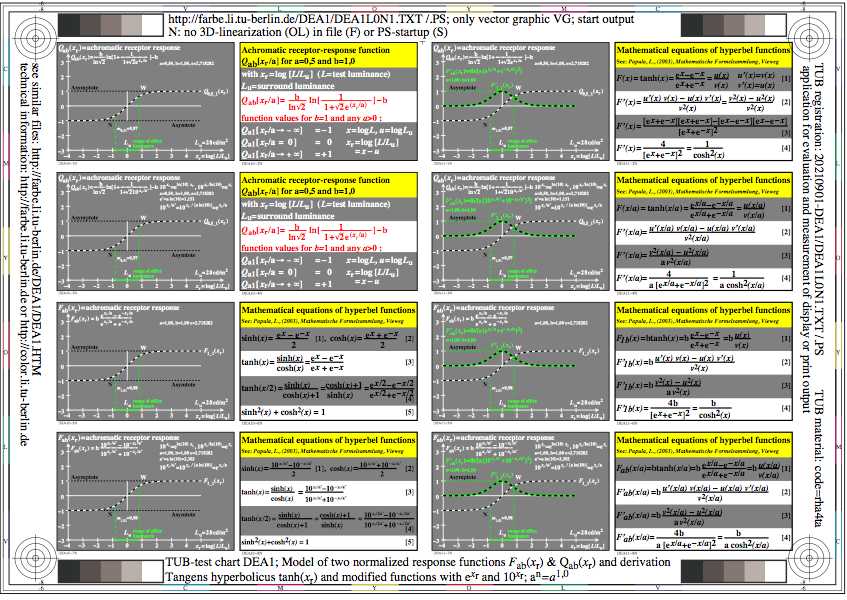
Figure DEA1L0N1.jpg: Output in format A6 of the file
DEA1L0NP.PDF, see
DEA1L0N1.
PS /
TXT /
PDF /
jpg
DEA1: TUB-test chart DEA1; Q/Fab(xr)-models for visual responses
Q/Fab(xr) with e^(xr/a) and 10^(xr/a')
a'=a ln(10); a^n = a^1,0
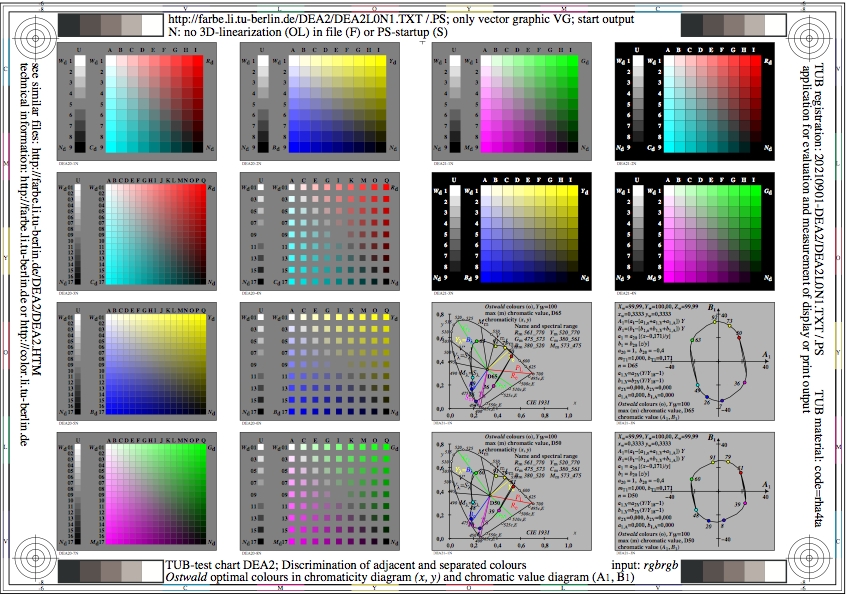
Figure DEA2L0N1.jpg: Output in format A6 of the file
DEA2L0NP.PDF, see
DEA2L0N1.
PS /
TXT /
PDF /
jpg
DEA2: TUB-test chart DEA2; Q/Fab(xr)-models for visual responses
Normalized Q/Fab(xr) with e^(xr/a) and 10^(xr/a')
a'=a ln(10); a^n = a^0,7, !!under work!!
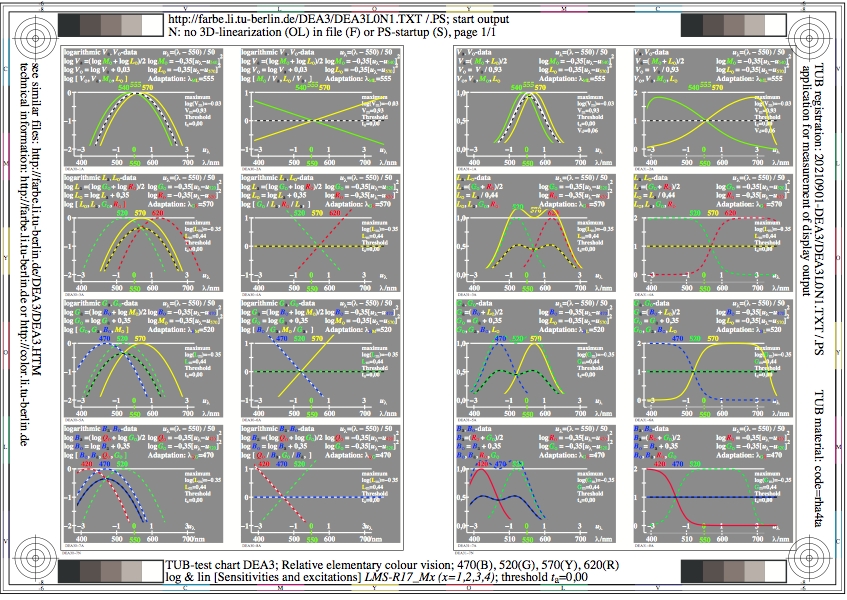
Figure DEA3L0N1.jpg: Output in format A6 of the file
DEA3L0NP.PDF, see
DEA3L0N1.
PS /
TXT /
PDF /
jpg
DEA3: TUB-Test chart DEA3; Relative elementary colour vision
log & lin [Sensitivities and excitations]; LMS_R17_Mx]
470(G), 520(G), 570(Y), 620(R), threshold ta=0,00
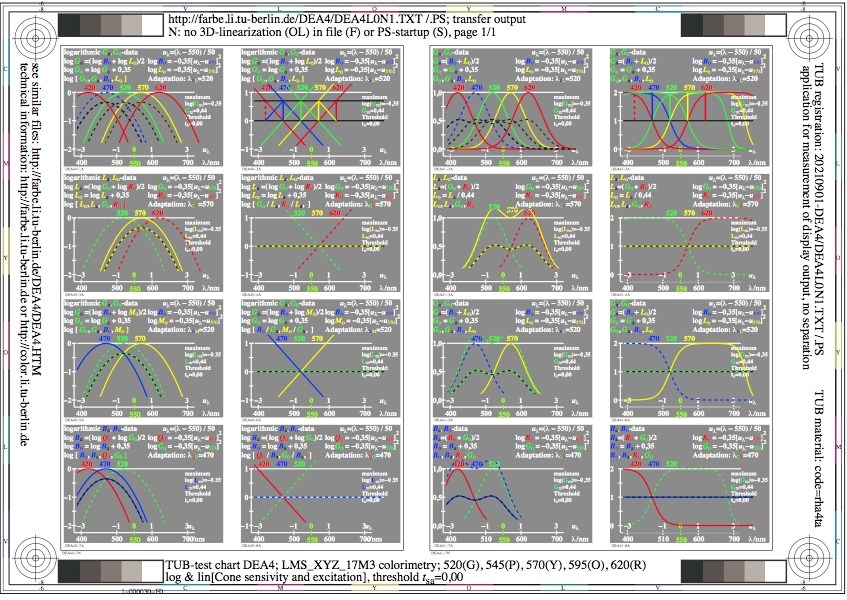
Figure DEA4L0N1.jpg: Output in format A6 of the file
DEA4L0NP.PDF, see
DEA4L0N1.
PS /
TXT /
PDF /
jpg
DEA4: TUB-Test chart DEA4; Relative elementary colour vision
log & lin [Sensitivities and excitations; LMS_R17_Mx]
520(G), 545(P), 570(Y), 595(O), 620(R), threshold ta=0,00
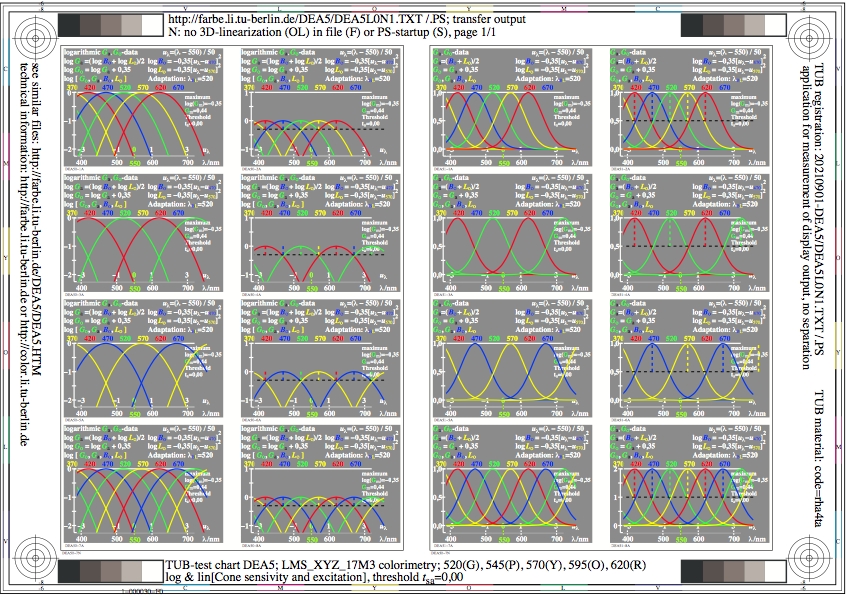
Figure DEA5L0N1.jpg: Output in format A6 of the file
DEA5L0NP.PDF, see
DEA5L0N1.
PS /
TXT /
PDF /
jpg
DEA5: TUB-Test chart DEA5; Relative elementary colour vision
log & lin [Sensitivities and excitations; LMS_R17_Mx]
520(G), 545(P), 570(Y), 595(O), 620(R), threshold ta=0,00
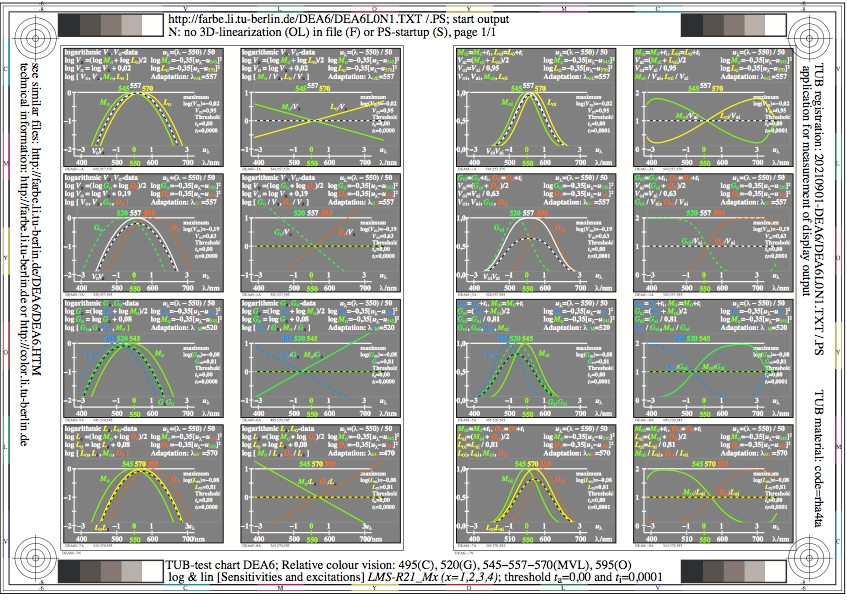
Figure DEA6L0N1.jpg: Output in format A6 of the file
DEA6L0NP.PDF, see
DEA6L0N1.
PS /
TXT /
PDF /
jpg
DEA6: TUB-Test chart DEA6; Relative receptor-colour vision
log & lin [sensitivities and exitations LMS_R21]
495(C), 520(G), 545-557-570(MVL), 595(O), ta=0,00&ti=0,0001
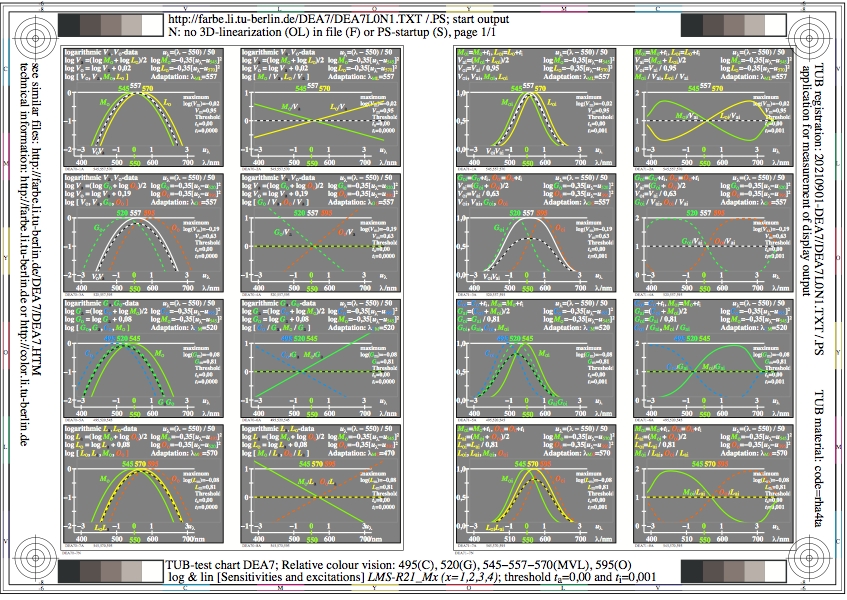
Figure DEA7L0N1.jpg: Output in format A6 of the file
DEA7L0NP.PDF, see
DEA7L0N1.
PS /
TXT /
PDF /
jpg
DEA7: TUB-Test chart DEA7; Relative receptor-colour vision
log & lin [sensitivities and exitations LMS_R21]
495(C), 520(G), 545-557-570(MVL), 595(O), ta=0,00&ti=0,001

Figure DEA8L0N1.jpg: Output in format A6 of the file
DEA8L0NP.PDF, see
DEA8L0N1.
PS /
TXT /
PDF /
jpg
DEA8: TUB-Test chart DEA8; Relative receptor-colour vision
log & lin [sensitivities and exitations LMS_R21]
495(C), 520(G), 545-557-570(MVL), 595(O), ta=0,00&ti=0,01
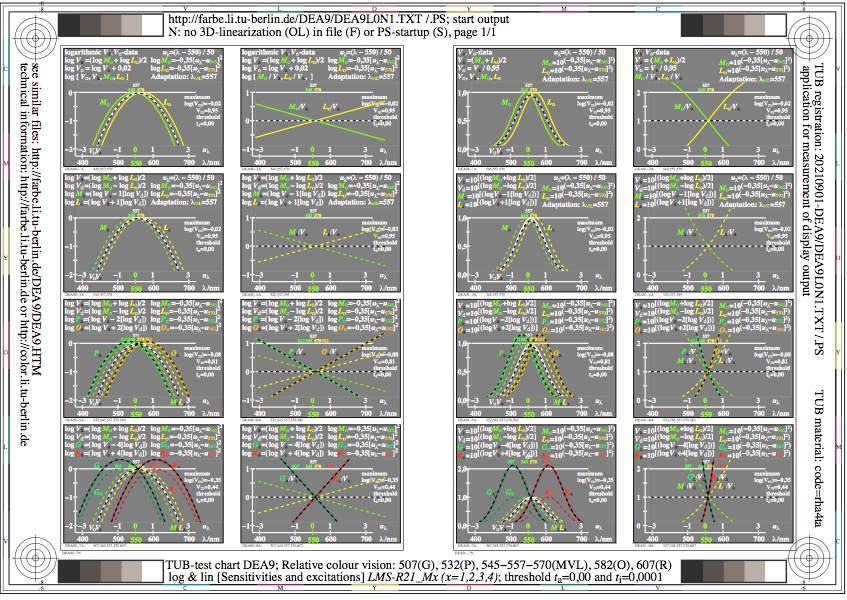
Figure DEA9L0N1.jpg: Output in format A6 of the file
DEA9L0NP.PDF, see
DEA9L0N1.
PS /
TXT /
PDF /
jpg
DEA9: TUB-test chart DEA9; Relative receptor-colour vision
log & lin [sensitivities and exitations LMS_R21]
507(G), 532(P), 545-557-570(MVL), 582(O), 607(R), ta=0,00
-------
For the archive information (2000-2009) of the BAM server "www.ps.bam.de"
(2000-2018)
about colour test charts, colorimetric calculations,
standards, and publications, see
indexAE.html in English,
indexAG.html in German.
Back to the main page of this TUB web site (NOT archive), see
index.html in English,
indexDE.html in German.