181101 and 030601: A/CE00/CE00X.HTM
For this page, see
CE00 in English or
CG00 in German.
For the previous page, see
CE99 in English or
CG99 in German.
For the next page, see
CE01 in English or
CG01 in German.
Back to the main page of this colour series, see
../CE in English or
../CG in German.
This page in German for Output Linearisation (OL) without and with MFL code by NP and FP files, see CG00X (in preparation)
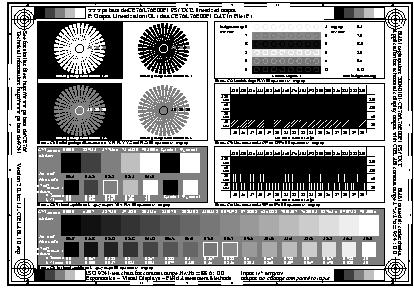
1. Basic ISO/IEC-test chart no. 1 according to ISO/IEC 15775:1999 for eight display contrast ratios on 8 pages
Fig. 1: ISO/IEC-test chart according to ISO/IEC 15775
In A4 size this test chart shows eight
pages for 8 different contrast ratios and for the PS operator
w* setgray. Each page uses one display system contrast
ratio, see (150 / 150 / 1.600 kByte)
L76E00FP.PS / TXT
/ PDF
2. Four times 16 grey steps according to ISO/IEC 15775:1999 for eight display contrast ratios on 2 pages
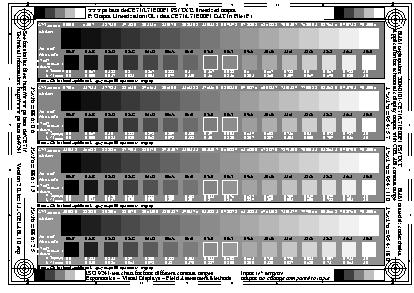
Fig. 2: Four visually equally spaced 16 step gray scales.
In A4 size this test chart shows 8
different contrast ratios on two pages for the PS operator
w* setgray. Each page uses four different display
system contrast ratios and one can test visually which output
gray scale on the two pages is visually equally spaced, see (120
/ 120 / 50 kByte)
L71E00FP.PS / TXT
/ PDF
3. Measurement problems for the 16 grey steps according to ISO/IEC 15775:1999 and solutions
The output of the 16 steps may be produced on the viewing screen of a display in A4 size or with a data projector in large size (2m x 3m).
One may consider the following main
problems if it is intended to measure the "viewing luminance
of the grey sample".
1. There may be a luminance drop from 100% in the middle of the
screen to 50% in the corners.
2. The illuminance may be measured by a low cost instrument instead
of the luminance. Then according to the cosinus sensitivity we
measure lower values at both ends of the 16 step grey scales.
3. It is hard to change the viewing angle of the luminance meter
at the observers eyes to measure the "viewing luminance of
the grey samples".
There are different files to support the luminance measurement:
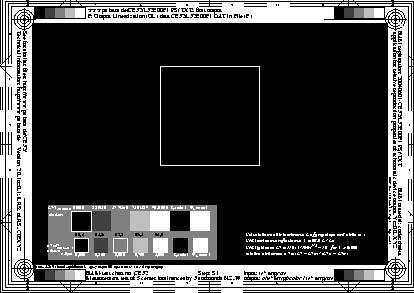
Fig. 3: Five visually equally spaced 5 step grey scales in surrounds N (Black), Z (Grey) and W (White).
The central field changes in 5 steps
form page to page.The 5 grey samples are shown in three surrounds
N, Z, W on 15 pages. Each page uses the maximul display system
contrast ratio for no screeen reflection, see (100 Kbyte, 16 pages)
L32E00FP.PS / TXT
/ PDF
Purpose: The luminance meter should measure the same luminances
in three surrounds. If not the measurement accuracy (failure)
is known.
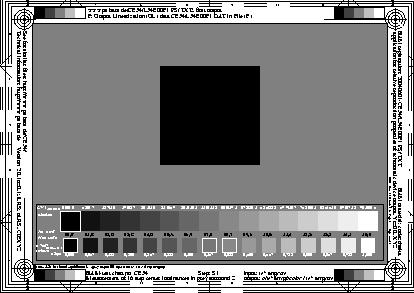
Fig. 4: Visually equally spaced 16 step grey scale in mean grey surround Z.
The central field changes in 16 steps
form page to page. The 16 gray samples are shown on 16 pages
in grey surround Z. Each page uses the maximul display system
contrast ratio for no screeen reflection, see (200 Kbyte, 49 pages)
L34E00FP.PS / TXT
/ PDF
Purpose: The luminance meter should measure the 16 luminances
of the 16 grey steps in the grey surround. The measurement accuracy
is known by the test of Fig. 3. The luminance meter has a fixed
viewing angle and distance. The 16 test samples are presented
by shifting from page to page of the PDF file. The lower scale
indicates the measurement sample out of the 16 step series.
Technical remark for the measurement
procedure:
1. It is recommended for advanced users to produce a PDF file
from the above PS file (for example by the software Adobe Acrobat
Distiller 3.0 or later).
2. This PDF file is used for output. The luminances of the 16
steps (on pages 1 to 16) are measured.
3. The 16 luminance values are included in the PS-file. The following
two example lines (arround line 60 of the PS file) include the
measured values of the first output of a real display (Apple Cinema
Display). One must exchange the two line by the measured values.
/MTLoutaS1gY [ 4.48 5.59 8.47 15.66 24.96
36.29 51.03 67.60 %20040801 ACD
86.00 107.8 131.0 155.6 184.5 213.1 247.4 287.6] def
4. It is recommended for advanced users
to produce a PDF file from this PS file with real values of the
first output.
5. This PDF file is used for output. The luminances of the 16
steps (on pages 16 to 31) are measured.
6. The 16 luminance values are included in the PS-file. The following
two example lines (arround line 70 of the PS file) include the
measured values of the second output of a real display (Apple
Cinema Display). One must exchange the two line by the measured
values.
/MTLoutaS2gY [ 4.49 7.50 12.10 18.46 26.90
36.21 47.36 60.72 %20040801 ACD
78.40 98.50 120.6 147.5 175.9 209.7 246.1 286.0] def
7. This PDF file is used for output.
The luminances of the 16 steps (on pages 32 to 47) are
not changed but include data of the measurement accuracy in the
bottom ine in a relative scale between 0 and 1 for black and white.
The accuracy of the first and the linearized output is given on the last page 49 (of the above file of Fig. 4) according to the method given in Annex G of ISO/IEC 15775. The table shows that the mean lighness difference has changed from 1.6 to 0.2 (by a factor 8).
For the production of the ISO/IEC-test chart on film in transmission mode the necessary changes are very large to produce an equally spaced 16 step grey scale. The reason is a linear instead of a nonlinear output characteristic of the image setter.
The 16 grey samples are shown within
the ISO/IEC-test chart on the first three pages (again first,
second and third output) . The first page uses the maximul
display system contrast ratio for no screeen reflection, see (200
Kbyte, 49 pages)
L47E00FP.PS / TXT
/ PDF
The accuracy of the first and the linearized output is given on page 4. The grey output in changed on the 8 pages number 5 to 12 to consider 8 room light reflections between Yr=0 to Yr=40.3. The accuracy of the 8 pages for eight luminance reflectances between Yr=0 to Yr=40.3 ist given on pages 13 to 20. The calculations are based on measurements for the grey scales on the 8 pages (see data in the above PS file arround line 125).
/MTLoutaS4gYx [0.004 0.840 2.180 3.370
4.650 6.790 10.00 13.77 %20040812 IST
18.23 24.03 31.06 38.63 47.52 58.73 70.14 83.90 %47S2E1.0
0.002 0.990 2.800 4.460 6.320 9.780 13.74 18.28 %Yr= 0.63,12
24.41 31.50 39.77 49.31 60.24 72.63 87.00 102.3
0.003 1.336 3.670 5.290 7.930 11.27 15.56 20.85 %Yr= 1.26,12
26.71 33.59 42.17 51.75 62.14 74.10 87.60 102.6
0.003 2.290 4.410 6.000 9.760 13.32 17.85 23.18 %Yr= 2.52,12
29.39 36.87 44.58 53.85 64.13 75.01 88.40 102.2
0.005 2.810 5.260 8.250 12.11 18.34 21.02 26.87 %Yr= 5.04,12
33.04 40.42 48.26 57.18 66.92 77.32 89.10 102.3
0.006 3.660 6.350 10.58 14.91 19.52 24.87 30.85 %Yr=10.08,12
37.89 44.88 52.52 61.40 70.69 80.40 90.70 102.4
0.003 4.440 8.580 13.38 18.28 23.61 29.49 35.74 %Yr=20.16,12
42.57 49.46 57.22 65.62 73.50 82.60 92.40 102.5
0.004 5.530 10.73 16.47 22.26 28.12 34.31 40.85 %Yr=40.32,13A
47.39 54.47 61.68 69.28 76.79 84.80 92.70 101.5] def
Table 1:Measurement example of relative film transmission for eight luminance reflectances used in the above PS file.
Summary
The grey sample of
the ISO/IEC-test chart according to ISO/IEC 15775 (Fig.
1) has been measured to serve for display systems tone change
and is proposed for ISO/CD 9241-306:2004. The test file is adapted
to the requirements at workplaces with 8 different display
reflections.
The ISO-test file produces 8 pages in A4 size which are equally spaced depending on different luminance reflectance ratios between larger 500:1 and 2:1. It is easy to measure this contrast ratio at any workplace with the above test chart files.
Usually the display system is calibrated for the "no" reflection (ideal) condition with a gamma of 2.4 and then no Output Linearisation (OL) method is necessary. In this case all the files may be used without modification. If the contrast ratio shown with the page output corresponds to one of the workplace reflections between 0% and 40% then the output will produce the best recognition for the 16 gray steps and the Landolt-rings.
Remark: If the display system is not calibrated for the "no" reflection case then the Output Linearization method of ISO/IEC DTR 19797 may be applied. The is described above. The MFL Code (Measurement, Lightness Function and Linearisation) for Output Linearisation (OL) is used to calibrate the display system for the "no" reflection condition. The MFL code includes the CIEXYZ luminance reflectance Y data or the CIELAB lightness L* data of the first output. The Output Linearisation is produced by one simple 16 step input - output table. The result is a linearisation of the CIELAB lightness L* of the grey scale in the output for the "no" reflection condition. All the other conditions with contrast ratios between larger 500:1 and 2:1 are related to the "no" reflection condition and are calibrated at the same time. All PS files are already prepared to include the 16 measured CIEXYZ luminance reflectance data Y or the measured 16 CIELAB lightness data L* of a first output.
-------
For an introduction (archive 2000-2009) to all folders
compared to this folder CE00, see
../CE.HTM in English or
../CG.HTM in German.
For information (archive 2000-2009) about International and
National Standards, Technical Reports, and Meetings, see
../4STAE.html in English or
../4STAG.html in German.
For information (archive 2000-2009) about colour test charts
and colorimetric calculations, see
../indexAE.html in English or
../indexAG.html in German.
For publications (archive 2000-2009) of the BAM research group, see
../XY91AE.html in English or
../XY91AG.html in German.
Back to the main page of the TU web site
(not archive), see
../../index.html in English or
../../indexDE.html in German.
The last link may not work, if you have visited
directly this archive site.
Then go to the main page of one of the
two TU web sites in a new window, see
http://farbe.li.tu-berlin.de/index.html or
http://130.149.60.45/~farbmetrik/index.html.