Figure CET0L0N1.jpg: Output in format A6 of the file CET0L0NP.PDF, see
CET0L0N1. PS / TXT / PDF / jpg
240215 1L2L0X0C_S2710.KTS/YETLCIN.KTS, http://farbe.li.tu-berlin.de/CETS.HTM or http://color.li.tu-berlin.de/CETS.HTM
For links to the
Section 2, Chapter C
Colour Spaces, Colour Differences, and Line Elements (2021),
see
For this image page with 10 colour series, see
CETS in English,
CGTS in German.
For the previous image page, see
CESS in English,
CGSS in German.
For the next image page, see
CEUS in English,
CGUS in German.
For the first image page of the previous chapter B, see
BEAS in English,
BGAS in German.
For the first image page of the next chapter D, see
DEAS in English,
DGAS in German.
Content list of chapter C:
CEA_I in English or
CGA_I in German.
Summary of chapter C:
CEA_S in English or
CGA_S in German.
For the large image page of chapter C with 260 colour series, see
ce2s in English or
cg2s in German.
Section 2, Chapter C
Colour Spaces, Colour Differences, and Line Elements (2021),
Image part CETS
The following ten pages CET0 to CET9 of this chapter
show the content with links to the single figures
in up to six formats.
Figure CET0L0N1.jpg: Output in format A6 of the file
CET0L0NP.PDF, see
CET0L0N1.
PS /
TXT /
PDF /
jpg
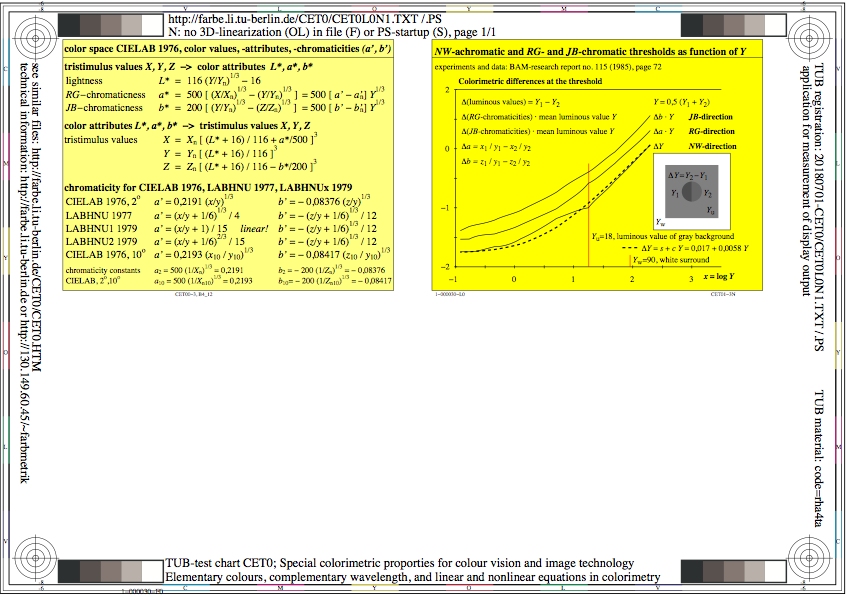
CET0: TUB-test chart CET0; Special colorimetric properties
Colour space CIELAB 1976, colour values, colour attributes
chromaticities (a', b') of CIELAB 1976 and LABHNUx 1979
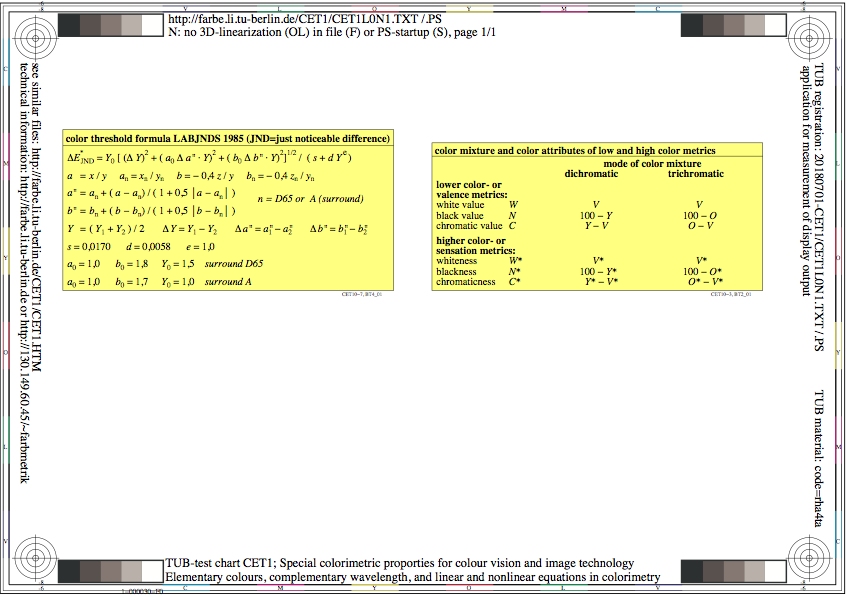
Figure CET1L0N1.jpg: Output in format A6 of the file
CET1L0NP.PDF, see
CET1L0N1.
PS /
TXT /
PDF /
jpg
CET1: TUB-test chart CET1; Special colorimetric properties
colour mixture, colour attributes of low and higher metric
colour threshold formula LABJND 1985, see CIE 230:2019
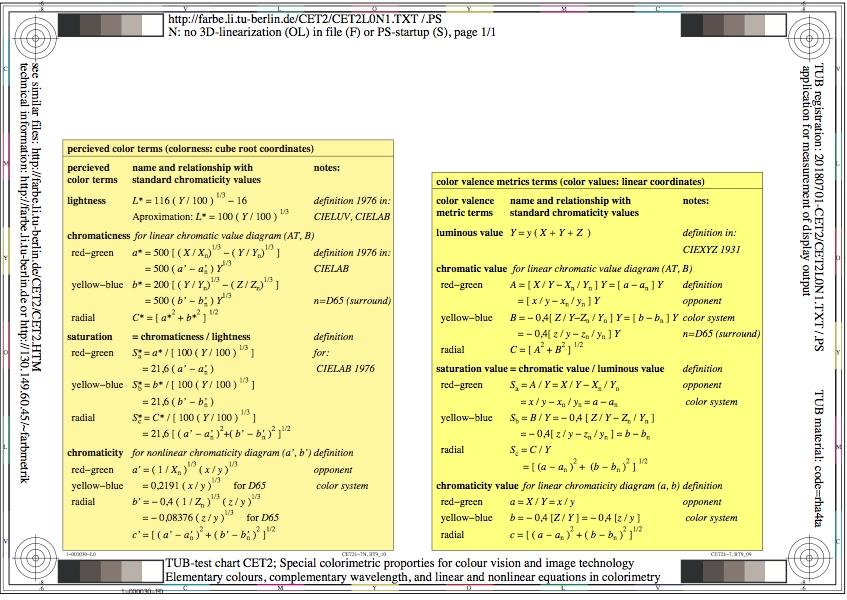
Figure CET2L0N1.jpg: Output in format A6 of the file
CET2L0NP.PDF, see
CET2L0N1.
PS /
TXT /
PDF /
jpg
CET2: TUB-test chart CET2; Special colorimetric properties
for colour vision and image technology; colour valence metric
chromatic value, saturation value, chromaticity value
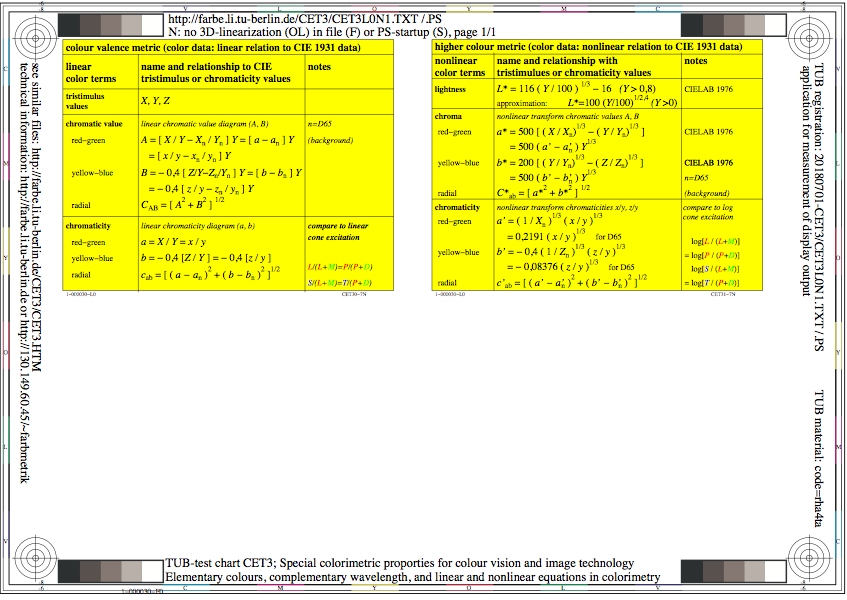
Figure CET3L0N1.jpg: Output in format A6 of the file
CET3L0NP.PDF, see
CET3L0N1.
PS /
TXT /
PDF /
jpg
CET3: TUB-test chart CET3; Special colorimetric properties
for colour vision and image technology; elementary colours
complementary wavelength; equations in colorimetry
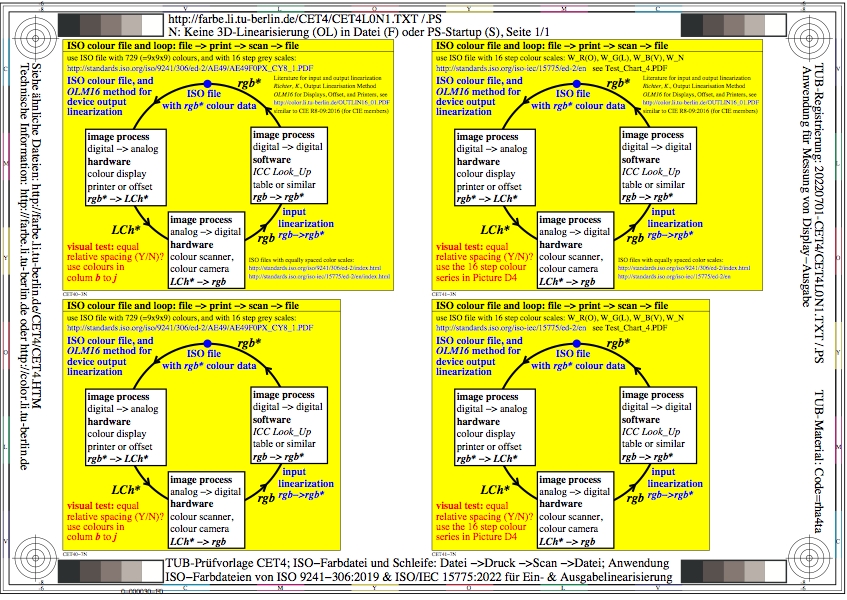
Figure CET4L0N1.jpg: Output in format A6 of the file
CET4L0NP.PDF, see
CET4L0N1.
PS /
TXT /
PDF /
jpg
CET4: TUB-test chart CET4; ISO-colour file and colour pei
Colour circle: ISO file -> print -> scan -> ISO file
ISO 9241-306 & ISO/IEC 15775: input and output linearization
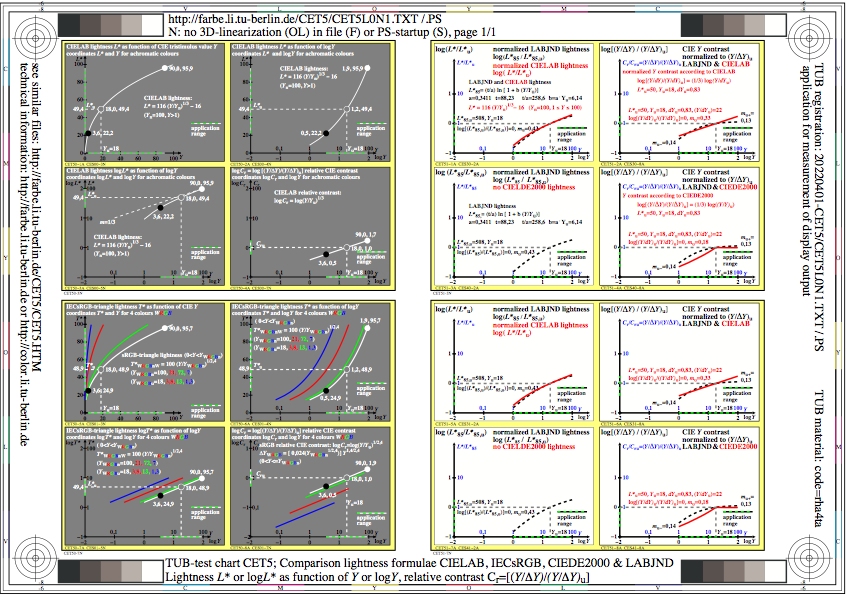
Figure CET5L0N1.jpg: Output in format A6 of the file
CET5L0NP.PDF, see
CET5L0N1.
PS /
TXT /
PDF /
jpg
CET5: TUB-test chart CET5; comparison lightness formulae
CIELAB, IECsRGB, CIEDE2000 and LABJND (CIE 230:2019)
Lightness L* and relative contrast Cr=Y/dY as function of Y
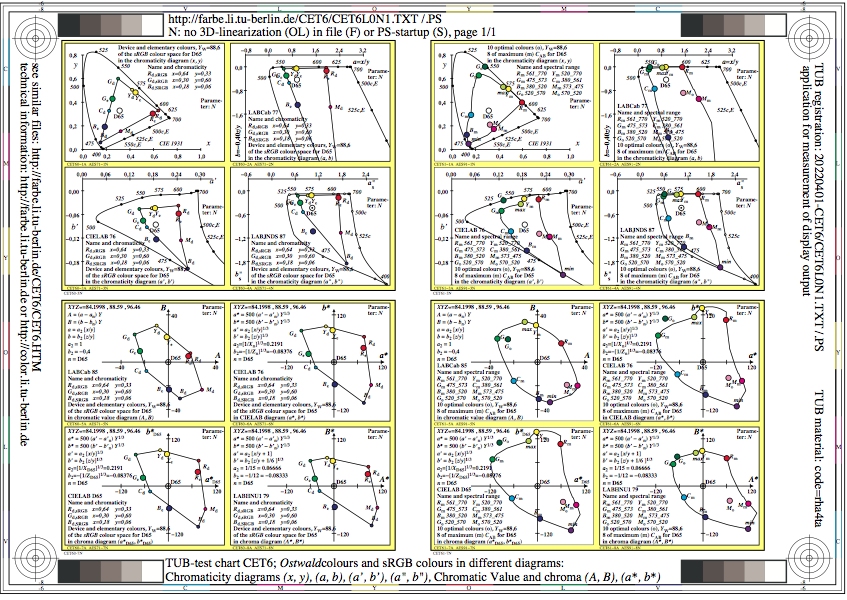
Figure CET6L0N1.jpg: Output in format A6 of the file
CET6L0NP.PDF, see
CET6L0N1.
PS /
TXT /
PDF /
jpg
CET6: TUB-test chart CET6; Ostwald colours and sRGB colours
chromaticities (x,y), (a,b), and nonlinear ones (a',b')
Chromatic values and chroma: (A,B), (a*,b*), (a*,b*)D65, (A*,B*)
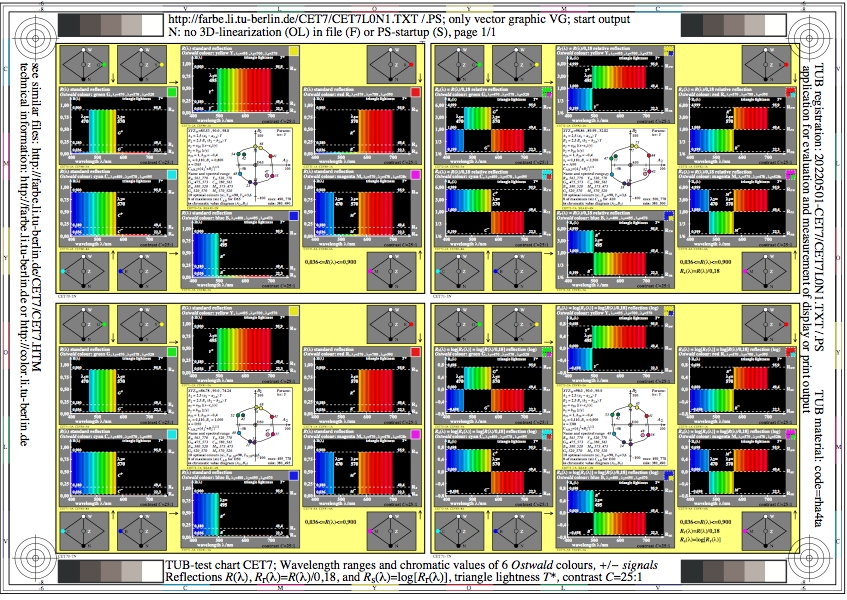
Figure CET7L0N1.jpg: Output in format A6 of the file
CET7L0NP.PDF, see
CET7L0N1.
PS /
TXT /
PDF /
jpg
CET7: TUB-test chart CET7; Wavelength ranges of 6
Ostwald colours and W, contrast C=25:1, +-signals
Reflections R, Rr=R/0,18, Rs=log(Rr), hue threshold dhA2B2=6

Figure CET8L0N1.jpg: Output in format A6 of the file
CET8L0NP.PDF, see
CET8L0N1.
PS /
TXT /
PDF /
jpg
CET8: TUB-test chart CET8; Wavelength ranges of 6
Ostwald colours and W, contrast C=2:1, +-signals
Reflections R, Rr=R/0,18, Rs=log(Rr), hue threshold dhA2B2=18
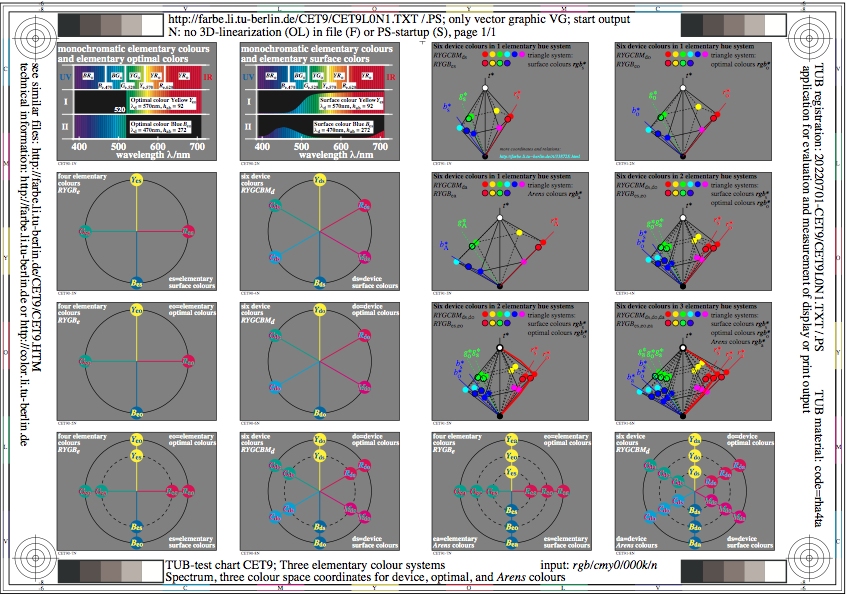
Figure CET9L0N1.jpg: Output in format A6 of the file
CET9L0NP.PDF, see
CET9L0N1.
PS /
TXT /
PDF /
jpg
CET9: TUB-test chart CET9; Three elementary-colour systems
Spectral properties of optimal and surface colours
Space coordinates: device, optimal, and Arens colours
-------
For the archive information (2000-2009) of the BAM server "www.ps.bam.de"
(2000-2018)
about colour test charts, colorimetric calculations,
standards, and publications, see
indexAE.html in English,
indexAG.html in German.
Back to the main page of this TUB web site (NOT archive), see
index.html in English,
indexDE.html in German.