Figure CEP0L0N1.jpg: Output in format A6 of the file CEP0L0NP.PDF, see
CEP0L0N1. PS / TXT / PDF / jpg
240215 1L2L0X0C_S2710.KTS/YEPLCIN.KTS, http://farbe.li.tu-berlin.de/CEPS.HTM or http://color.li.tu-berlin.de/CEPS.HTM
For links to the
Section 2, Chapter C
Colour Spaces, Colour Differences, and Line Elements (2021),
see
For this image page with 10 colour series, see
CEPS in English,
CGPS in German.
For the previous image page, see
CEOS in English,
CGOS in German.
For the next image page, see
CEQS in English,
CGQS in German.
For the first image page of the previous chapter B, see
BEAS in English,
BGAS in German.
For the first image page of the next chapter D, see
DEAS in English,
DGAS in German.
Content list of chapter C:
CEA_I in English or
CGA_I in German.
Summary of chapter C:
CEA_S in English or
CGA_S in German.
For the large image page of chapter C with 260 colour series, see
ce2s in English or
cg2s in German.
Section 2, Chapter C
Colour Spaces, Colour Differences, and Line Elements (2021),
Image part CEPS
The following ten pages CEP0 to CEP9 of this chapter
show the content with links to the single figures
in up to six formats.
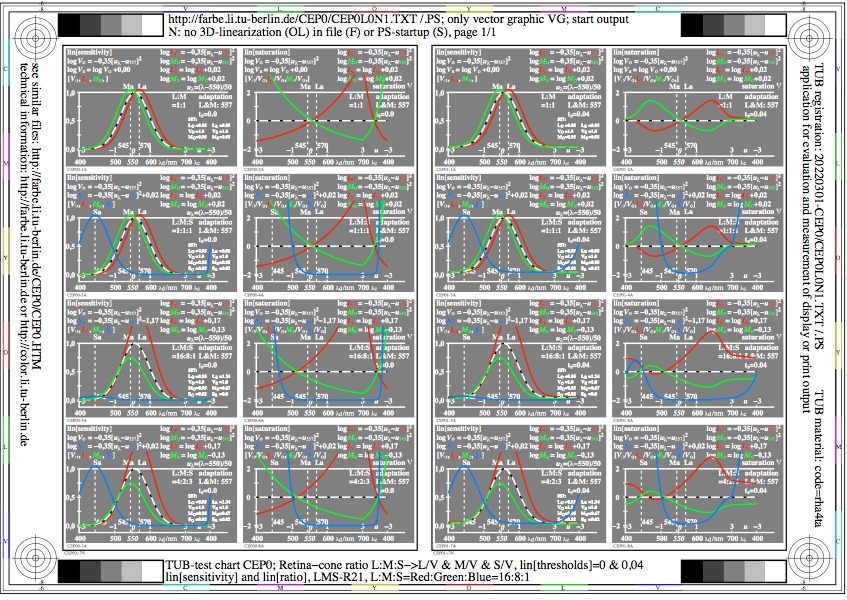
Figure CEP0L0N1.jpg: Output in format A6 of the file
CEP0L0NP.PDF, see
CEP0L0N1.
PS /
TXT /
PDF /
jpg
CEP0: TUB-test chart CEP0; LMS-R21-colour vision model
cone ratio L:M:S=red:green:blue=16:8:1
lin[sensitivities], lin[ratios], lin[thresholds]=0&0,04
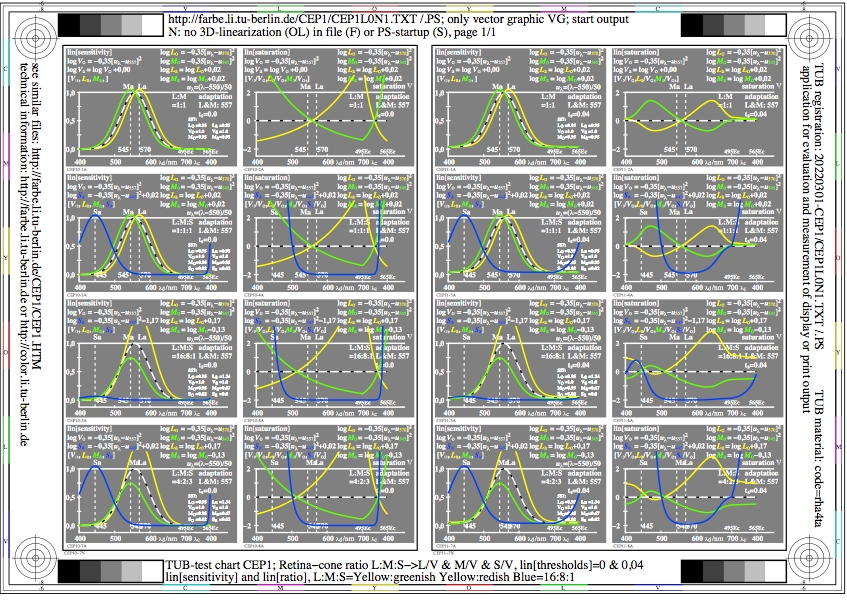
Figure CEP1L0N1.jpg: Output in format A6 of the file
CEP1L0NP.PDF, see
CEP1L0N1.
PS /
TXT /
PDF /
jpg
CEP1: TUB-test chart CEP1; LMS-R21-colour vision model
ratio L:M:S=yellow:greenish yellow:redish blue=16:8:1
lin[sensitivities], lin[ratios], lin[thresholds]=0&0,04
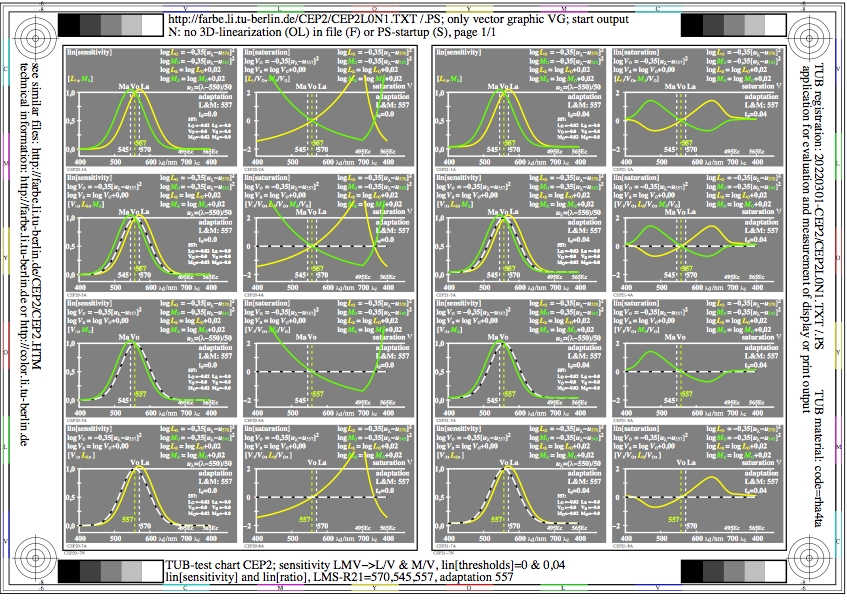
Figure CEP2L0N1.jpg: Output in format A6 of the file
CEP2L0NP.PDF, see
CEP2L0N1.
PS /
TXT /
PDF /
jpg
CEP2: TUB-test chart CEP2; LMS-R21-colour vision model
adaptation of the sensitivities 570,557,545, LVM->(LVM)/V
lin[sensitivities], lin[ratios], lin[thresholds]=0&0,04
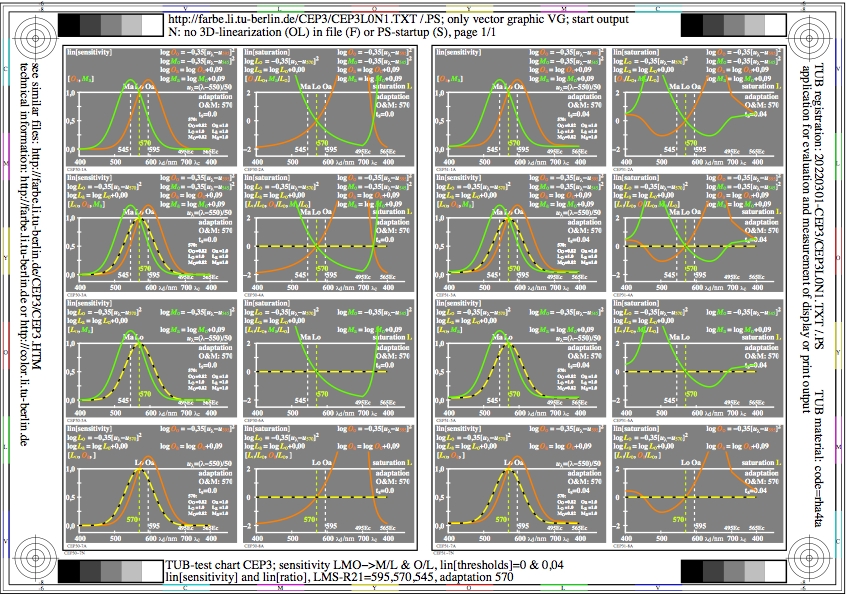
Figure CEP3L0N1.jpg: Output in format A6 of the file
CEP3L0NP.PDF, see
CEP3L0N1.
PS /
TXT /
PDF /
jpg
CEP3: TUB-test chart CEP3; LMS-R21-colour vision model
adaptation of the sensitivities 595,570,545, OLM->(OLM)/L
lin[sensitivities], lin[ratios], lin[thresholds]=0&0,04
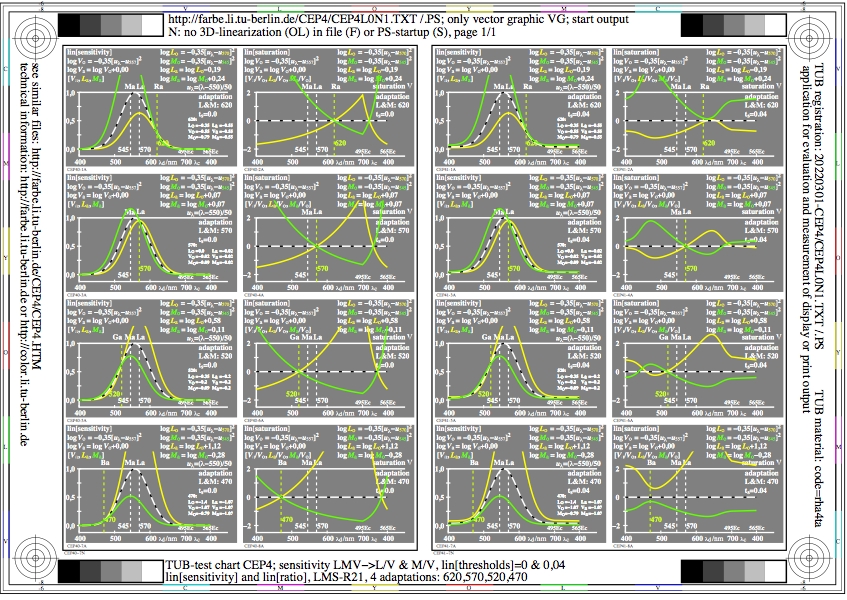
Figure CEP4L0N1.jpg: Output in format A6 of the file
CEP4L0NP.PDF, see
CEP4L0N1.
PS /
TXT /
PDF /
jpg
CEP4: TUB-test chart CEP4; LMS-R21-colour vision model
4 adaptations of 620,570,520,470, LVM->(LVM)/V
lin[sensitivities], lin[ratios], lin[thresholds]=0&0,04
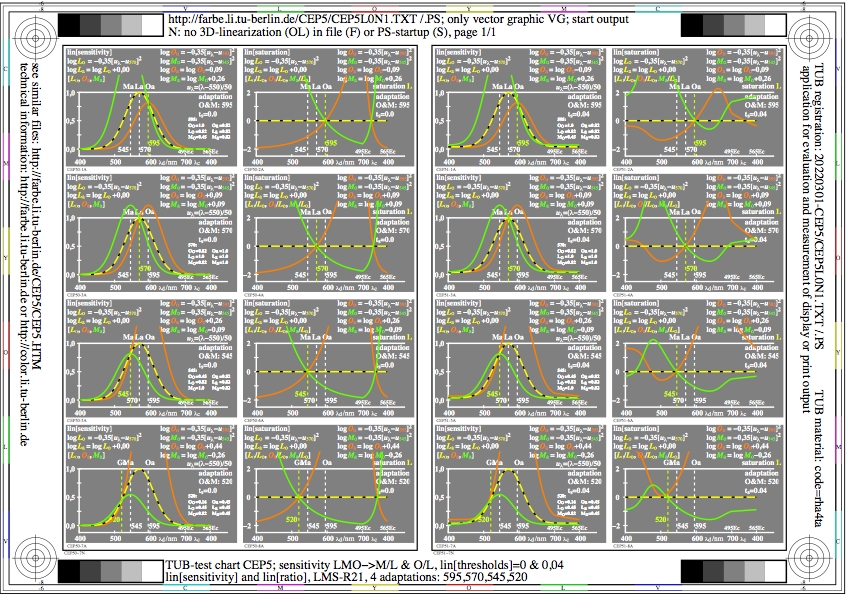
Figure CEP5L0N1.jpg: Output in format A6 of the file
CEP5L0NP.PDF, see
CEP5L0N1.
PS /
TXT /
PDF /
jpg
CEP5: TUB-test chart CEP5; LMS-R21-colour vision model
4 adaptations of 620,570,520,470, OLM->(OLM)/L
lin[sensitivities], lin[ratios], lin[thresholds]=0&0,04
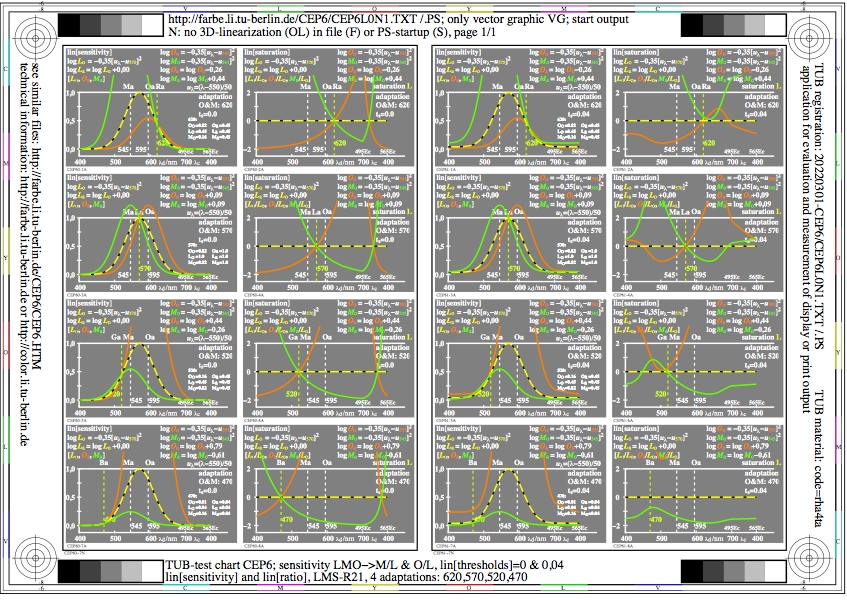
Figure CEP6L0N1.jpg: Output in format A6 of the file
CEP6L0NP.PDF, see
CEP6L0N1.
PS /
TXT /
PDF /
jpg
CEP6: TUB-test chart CEP6; LMS-R21-colour vision model
4 adaptations of 620,570,520,470, OLM->(OLM)/L
lin[sensitivities], lin[ratios], lin[thresholds]=0&0,04
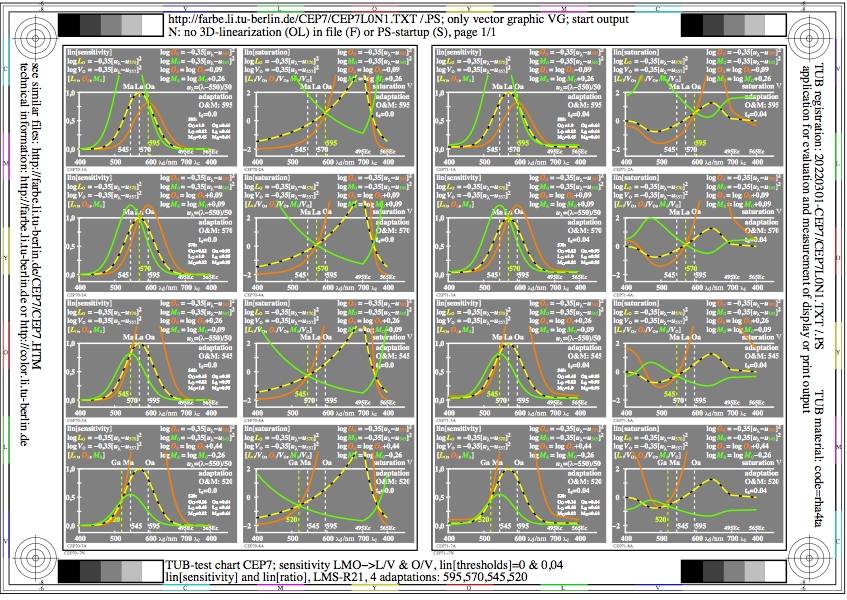
Figure CEP7L0N1.jpg: Output in format A6 of the file
CEP7L0NP.PDF, see
CEP7L0N1.
PS /
TXT /
PDF /
jpg
CEP7: TUB-test chart CEP7; LMS-R21-colour vision model
4 adaptations of 595,570,545,520, OLM->(OLM)/L
lin[sensitivities], lin[ratios], lin[thresholds]=0&0,04
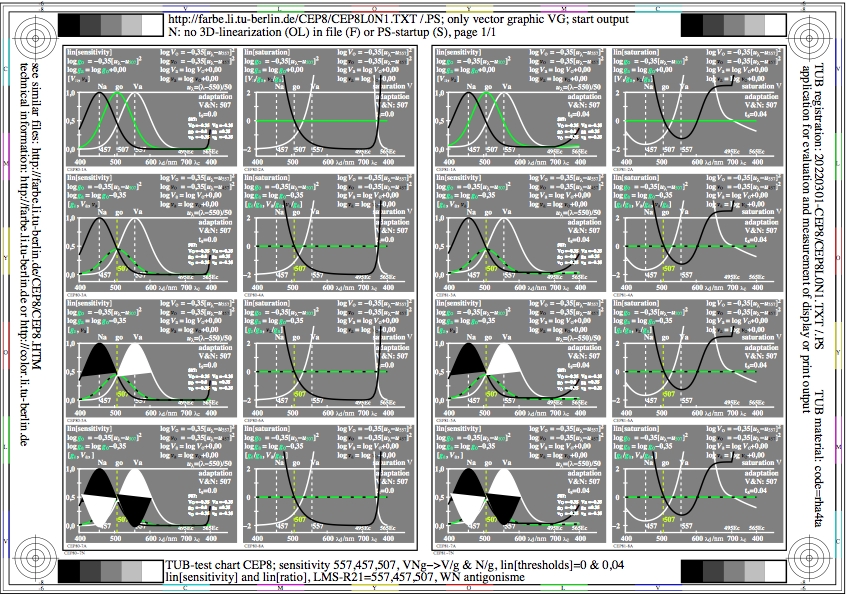
Figure CEP8L0N1.jpg: Output in format A6 of the file
CEP8L0NP.PDF, see
CEP8L0N1.
PS /
TXT /
PDF /
jpg
CEP8: TUB-test chart CEP8; LMS-R21-colour vision model
WN antagonisme of sensitivities 547,457, V,N->V/g,N/g
lin[sensitivities], lin[ratios], lin[thresholds]=0&0,04
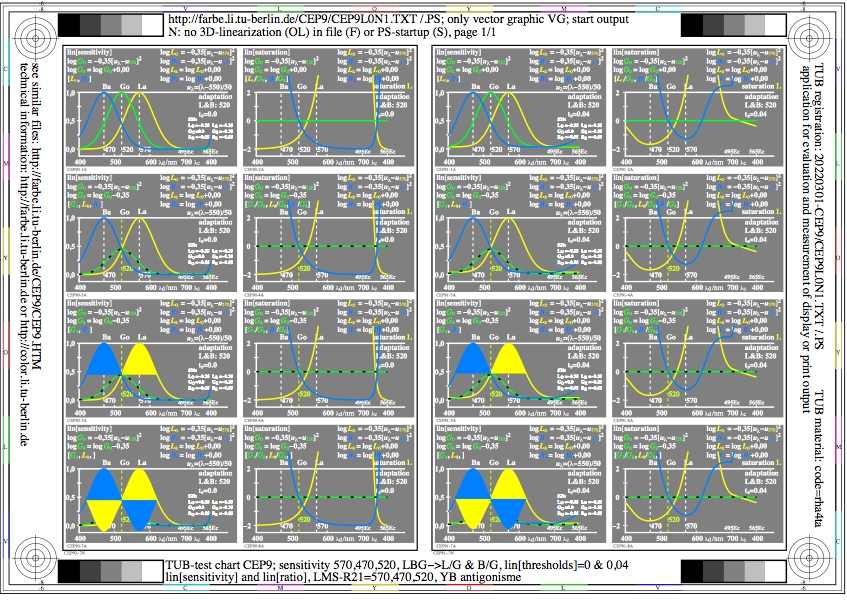
Figure CEP9L0N1.jpg: Output in format A6 of the file
CEP9L0NP.PDF, see
CEP9L0N1.
PS /
TXT /
PDF /
jpg
CEP9: TUB-test chart CEP9; LMS-R21-colour vision model
YB antagonisme of sensitivities 570,470, Y,B->J/G,B/G
lin[sensitivities], lin[ratios], lin[thresholds]=0&0,04
-------
For the archive information (2000-2009) of the BAM server "www.ps.bam.de"
(2000-2018)
about colour test charts, colorimetric calculations,
standards, and publications, see
indexAE.html in English,
indexAG.html in German.
Back to the main page of this TUB web site (NOT archive), see
index.html in English,
indexDE.html in German.