240215 1L2L0X0B_S2710.KTS/YEELBIN.KTS, http://farbe.li.tu-berlin.de/BEES.HTM or http://color.li.tu-berlin.de/BEES.HTM
For links to the
Section 2, Chapter B
Colour Vision and Colourimetry (2020),
see
For this image page with 10 colour series, see
BEES in English,
BGES in German.
For the previous image page, see
BEDS in English,
BGDS in German.
For the next image page, see
BEFS in English,
BGFS in German.
For the first image page of the previous chapter A, see
AEAS in English,
AGAS in German.
For the first image page of the next chapter C, see
CEAS in English,
CGAS in German.
Content list of chapter B:
BEA_I in English or
BGA_I in German.
Summary of chapter B:
BEA_S in English or
BGA_S in German.
For the large image page of chapter B with 260 colour series, see
be2s in English or
bg2s in German.
Section 2, Chapter B
Colour vision and Colorimetry (2020),
Image part BEES
Additive mixture of spectral colours to Ostwald optimal colours
1. Introduction and goals.
2. Additive spectral colour mixture with a colour integrator to the Ostwald-optimal colours.
3. Antagonistic model of colour vision; mixture to grey for D65.
4. Additive colour mixture for four display devices sRGB, WCGa, Offs, and Ostw.
5. Normalized reflections R/0,5 or log[R/0,2] and relations
to the lightness and to antagonistic visual signals.
The following ten pages BEE0 to BEE9 of this chapter
show the content with links to the single figures
in up to six formats.
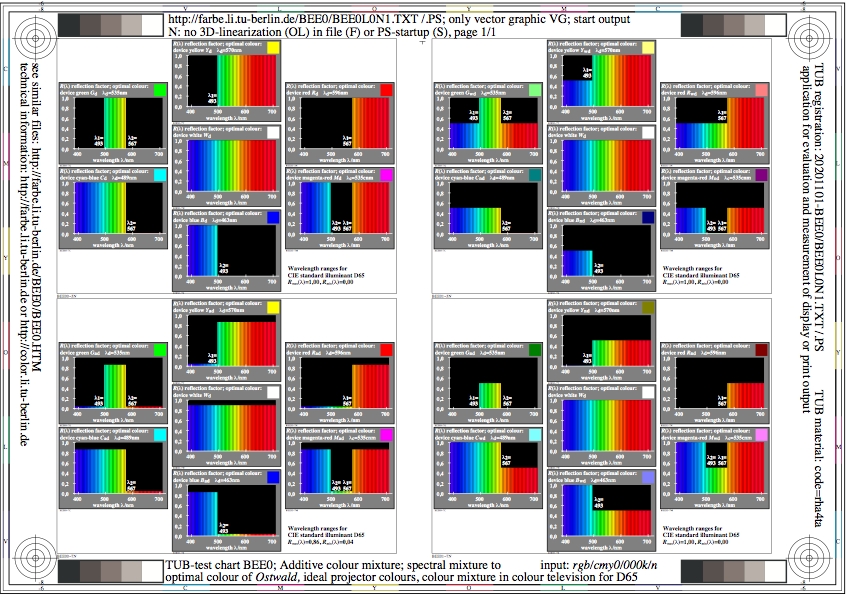
Figure BEE0L0N1.jpg: Output in format A6 of the file
BEE0L0NP.PDF, see
BEE0L0N1.
PS /
TXT /
PDF /
jpg
BEE0: TUB-test chart BEE0; Additive colour mixture, spectral
mixture to optimal colours of Ostwald, ideal
projector colours, mixture with colour integrator for D65
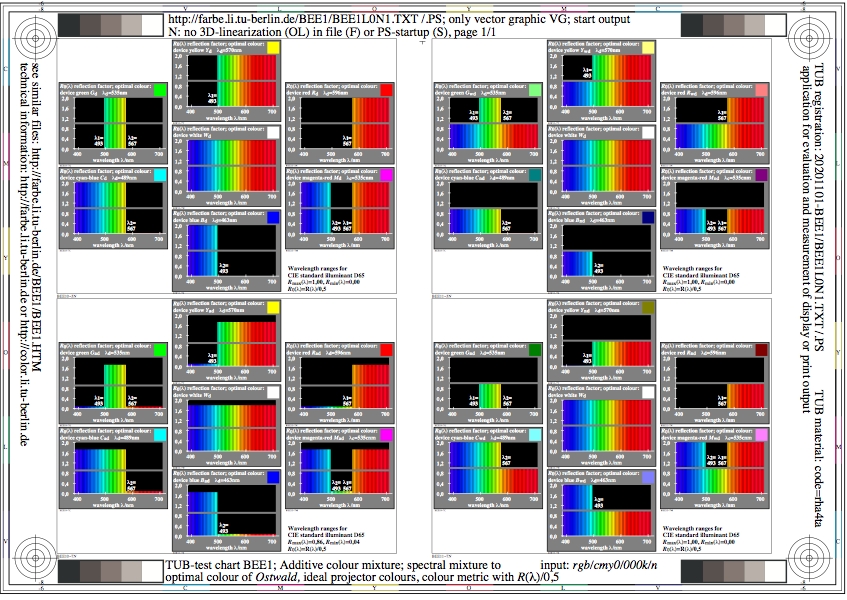
Figure BEE1L0N1.jpg: Output in format A6 of the file
BEE1L0NP.PDF, see
BEE1L0N1.
PS /
TXT /
PDF /
jpg
BEE1: TUB-test chart BEE1; Additive colour mixture, spectral
mixture to optimal colours of Ostwald, ideal
projector colours, mixture with colour integrator for D65
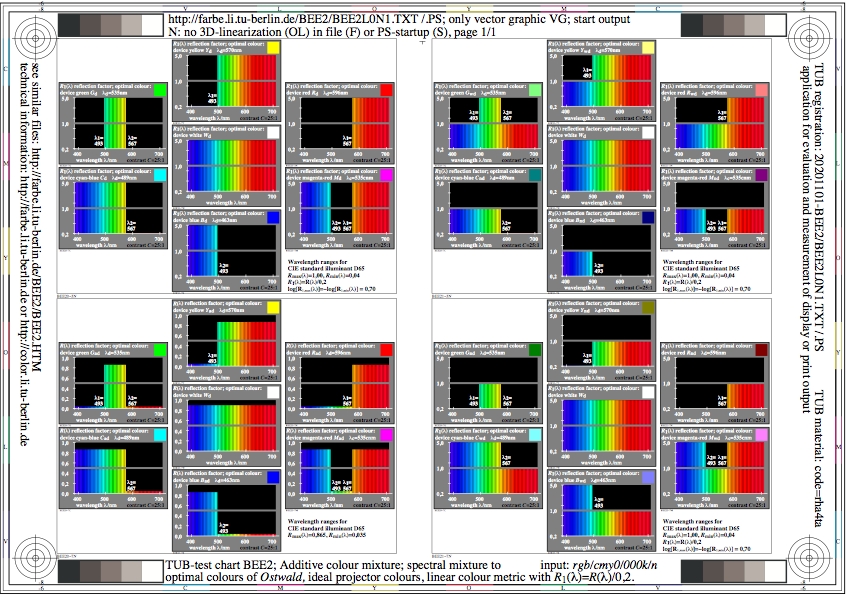
Figure BEE2L0N1.jpg: Output in format A6 of the file
BEE2L0NP.PDF, see
BEE2L0N1.
PS /
TXT /
PDF /
jpg
BEE2: TUB-test chart BEE2; Additive colour mixture, spectral
mixture to optimal colours of Ostwald, antagonistic
model of colour vision, mixture of grey for D65
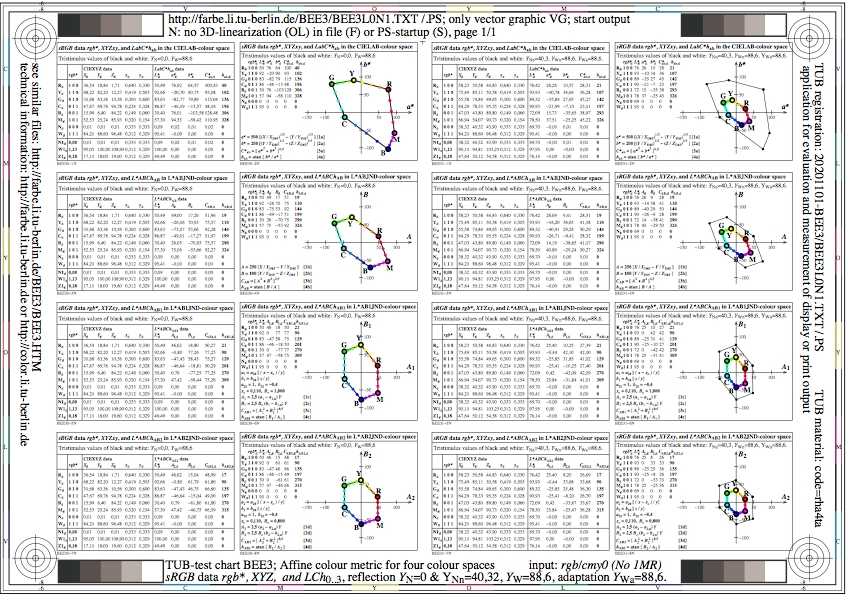
Figure BEE3L0N1.jpg: Output in format A6 of the file
BEE3L0NP.PDF, see
BEE3L0N1.
PS /
TXT /
PDF /
jpg
BEE3: TUB-test chart BEE3; Antagonistic metric in colour spaces
data rgb*, XYZ, and (Ai, Bi) of colour spaces LCHJND0 to 3
contrast steps C>=288:1 and 2:1 for sRGB display
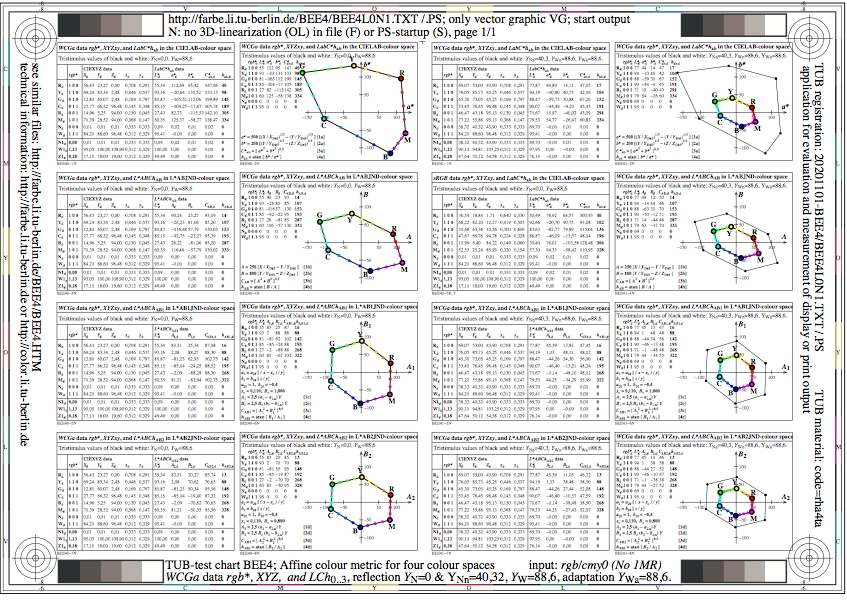
Figure BEE4L0N1.jpg: Output in format A6 of the file
BEE4L0NP.PDF, see
BEE4L0N1.
PS /
TXT /
PDF /
jpg
BEE4: TUB-test chart BEE4; Antagonistic metric in colour spaces
data rgb*, XYZ, and (Ai, Bi) of colour spaces LCHJND0 to 3
contrast steps C>=288:1 and 2:1 for WCGa display
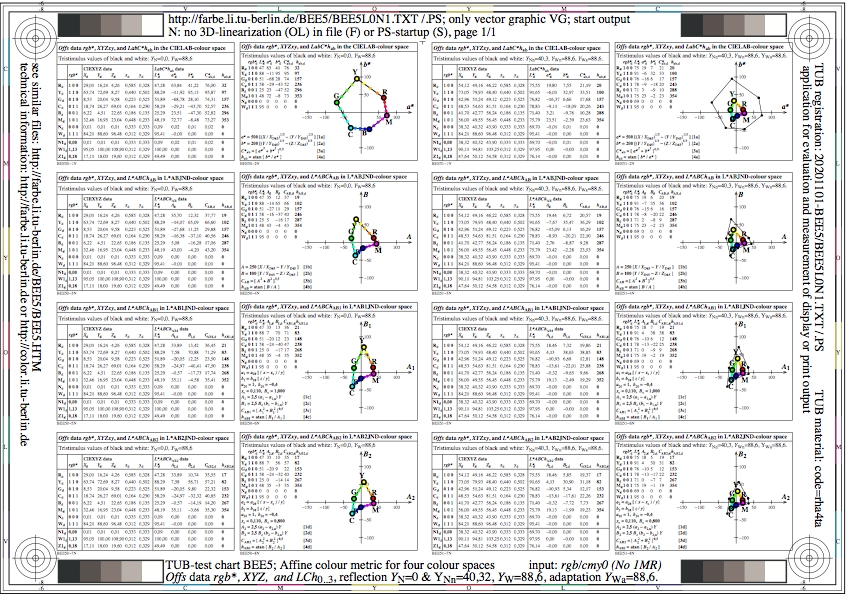
Figure BEE5L0N1.jpg: Output in format A6 of the file
BEE5L0NP.PDF, see
BEE5L0N1.
PS /
TXT /
PDF /
jpg
BEE5: TUB-test chart BEE5; Antagonistic metric in colour spaces
data rgb*, XYZ, and (Ai, Bi) of colour spaces LCHJND0 to 3
contrast steps C>=288:1 and 2:1 for Offs display
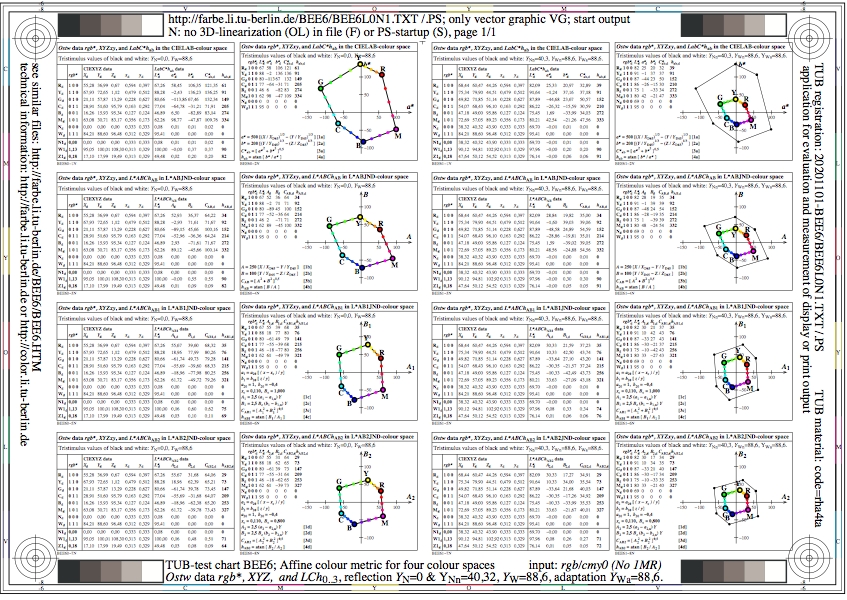
Figure BEE6L0N1.jpg: Output in format A6 of the file
BEE6L0NP.PDF, see
BEE6L0N1.
PS /
TXT /
PDF /
jpg
BEE6: TUB-test chart BEE6; Antagonistic metric in colour spaces
data rgb*, XYZ, and (Ai, Bi) of colour spaces LCHJND0 to 3
contrast steps C>=288:1 and 2:1 for Ostw display
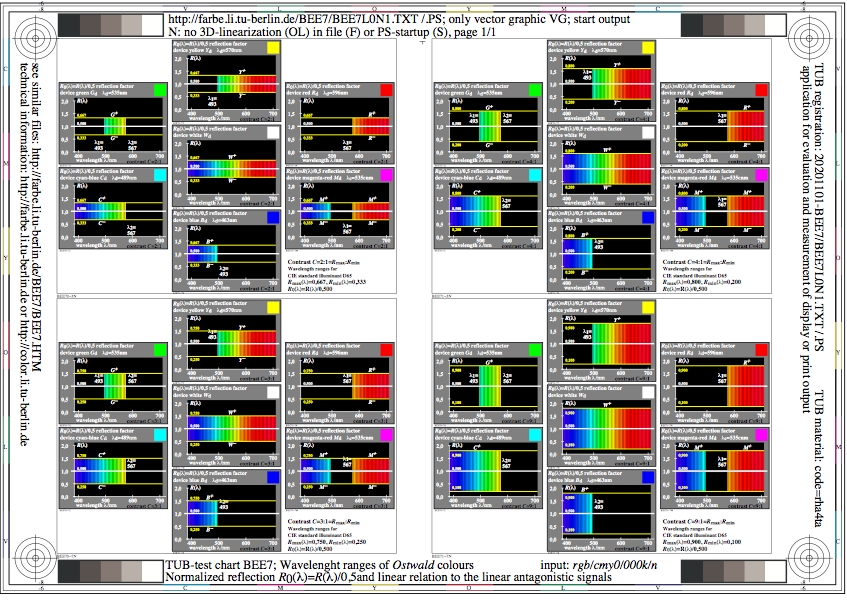
Figure BEE7L0N1.jpg: Output in format A6 of the file
BEE7L0NP.PDF, see
BEE7L0N1.
PS /
TXT /
PDF /
jpg
BEE7: TUB-test chart BEE7; Wavelength ranges of Ostwald colours
normalized reflection R/0,5 and linear model relation
to the antagonistic visual signals
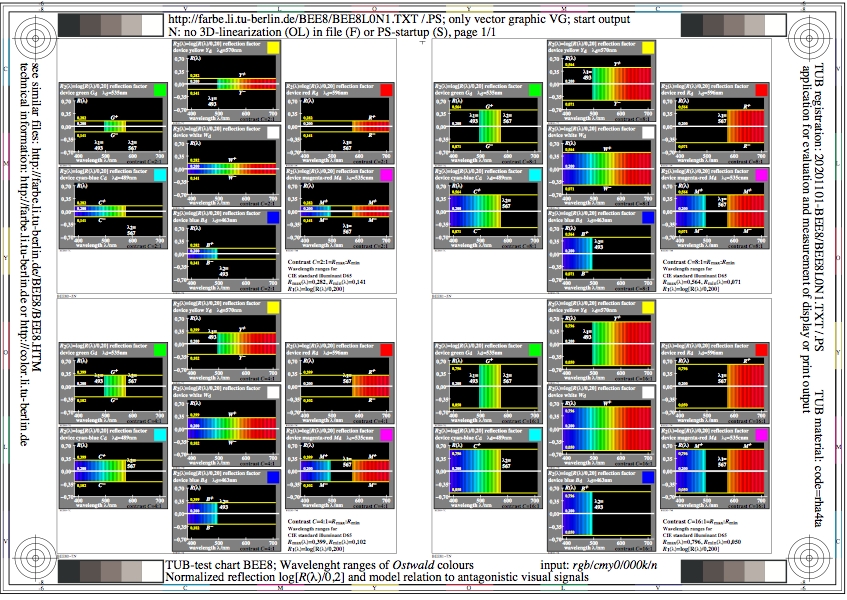
Figure BEE8L0N1.jpg: Output in format A6 of the file
BEE8L0NP.PDF, see
BEE8L0N1.
PS /
TXT /
PDF /
jpg
BEE8: TUB-test chart BEE8; Wavelength ranges of Ostwald colours
normalized reflection log[R/0,2] and model relation
to the different antagonistic visual signals
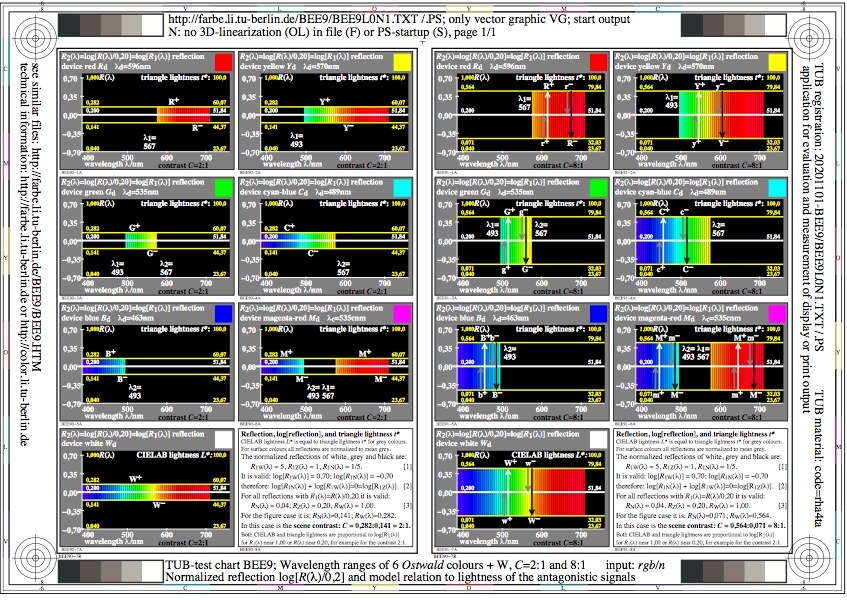
Figure BEE9L0N1.jpg: Output in format A6 of the file
BEE9L0NP.PDF, see
BEE9L0N1.
PS /
TXT /
PDF /
jpg
BEE9: TUB-test chart BEE9; Wavelength ranges of Ostwald colours
normalized reflection log[R/0,2] and model relation
to the lightness of antagonistic visual signals
-------
For the archive information (2000-2009) of the BAM server "www.ps.bam.de"
(2000-2018)
about colour test charts, colorimetric calculations,
standards, and publications, see
indexAE.html in English,
indexAG.html in German.
Back to the main page of this TUB web site (NOT archive), see
index.html in English,
indexDE.html in German.